The new liquidity pools aim to help users reduce financial risks and increase their profits across networks.
By The Numbers: How Much You Have To Invest To Become A Memecoin Millionaire
The total market capitalization for the memecoin sector reached $19 billion in the past weeks; the launch of PEPE, WOJAK, and others have attracted new participants to the market. As a result, these assets have experienced a massive surge in value and trading volume.
Over the last 24 hours, memecoin PEPE saw a 53% profit while WOJAK, AIDOGE, have experienced rallies of over 20%. Over the past week, PEPE alone saw a 629% profit while WOJAK recorded a 972% profit increasing the euphoria around these assets.

Memecoin Fever Triggers Euphoria
The increase in the price of the memecoin sector has seen traders betting a large portion of their capital in the hopes of turning into millionaires overnight. Some achieved this goal by investing as little as $20 before the memecoin explosion.
$27 $pepe wallet update:
Now worth $4,240,471.20 pic.twitter.com/jsA4BIRSms
— borovik.eth (@3orovik) May 4, 2023
One investor put $27 into PEPE and turned the capital into over $4 million in a few weeks as the token entered price discovery. Crypto is no stranger to these stories, but new data from Coingecko is trying to shine a bigger light on this phenomenon.
The analysis team behind Coingecko attempted to reply to the following question: How much money do you need to be a Meme Coin Millionaire? On average, and taking into consideration the current trending coins (PEPE, BONK, AIDOGE), and the classic memecoins (DOGE, SHIB, Baby Doge), the study concluded:
An investor would have needed $66,298.25 on average to become a meme coin millionaire, according to an analysis of 10 meme coin price returns. To reach $1 million in meme coin holdings, the minimum initial investment that is needed ranges from $11.87 for Shiba Inu, to $190,585.57 for ArbDoge AI (AIDOGE).
As seen in the chart below, AIDOGE, WOJAK, and PEPE, needed the highest initial capital to reach millionaire status. As seen in the chart below, ArbDoge AI (AIDOGE) required a $190,000 investment if buying them in 2023, while classical Shiba Inu (SHIB) and Dogecoin (DOGE) needed $820 if buying in 2022 and 2013, respectively.

How To Find The Next PEPE, WOJAK, AIDOGE?
As these assets become mainstream, it is harder for early investors to see a higher investment return. As the chart shows, earlier investors in classical memecoins needed much less capital to reach millionaire status but much more time.
In order to achieve millionaire status, an early Dogecoin investor needed 2,701 days or 7 years, while a Bonk investor needed but a week. Thus, there is an inverse correlation between initial capital and the take it would take investors to become a millionaire with these assets. Coingecko concluded:
For the 2023 meme coins in particular, it is likely that Pepe, ArbDoge AI, Wojak and Ignore Fud will subsequently surpass their current all-time highs. Although they might take longer to reach higher prices, it also means that a lower initial investment is needed to become that meme coin’s millionaire.
In the crypto industry, trends, and sectors can lose popularity and gain overnight. In that sense, finding the “next big thing” is challenging.
However, Coingecko recommends that users leverage decentralized exchange (DEX) trackers to monitor the tokens experiencing a surge in their trading volume/price. These assets are the most likely to see an uptick in their market cap and popularity, hinting at a potential bull run.
Block’s Q1 Bitcoin Revenue Rises 18% From Q4, Gains 25% From a Year Ago
For the full year, Block’s bitcoin revenue declined 29% from 2021 due to the fall in the price of bitcoin, the company said.
Coinbase Shares Rise as Q1 Revenue Grows 23% From Q4 to $773M
The crypto exchange reported first quarter results after the close on Thursday.
Bitcoin Mega Whales Are Moving Opposite To Rest Of Market: Glassnode
On-chain data from Glassnode shows the largest Bitcoin whales have been showing the opposite behavior to what other investors have been doing.
Bitcoin Market Is Observing A Moderate Distribution Phase Currently
According to data from the on-chain analytics firm Glassnode, the behavior of the largest BTC whales has once again deviated from the rest of the market. The relevant indicator here is the “Trend Accumulation Score,” which tells us whether Bitcoin investors are buying or selling.
There are mainly two factors that the metric accounts for to find this score: the balance changes taking place in the holders’ wallets and the size of the investors making such changes. This means that the larger the investor making a buying or selling move, the larger their weightage in the Trend Accumulation Score.
When the value of this metric is close to 1, it means that the larger holders in the sector are accumulating right now (or a huge number of small investors are displaying this behavior). On the other hand, the indicator has a value near the zero mark suggesting the investors are currently displaying a distribution trend.
This indicator is generally defined for the entire market but can also be used on specific investor segments. In the below chart, Glassnode has displayed the data for the Bitcoin Trend Accumulation Score of the various holder groups in the market.
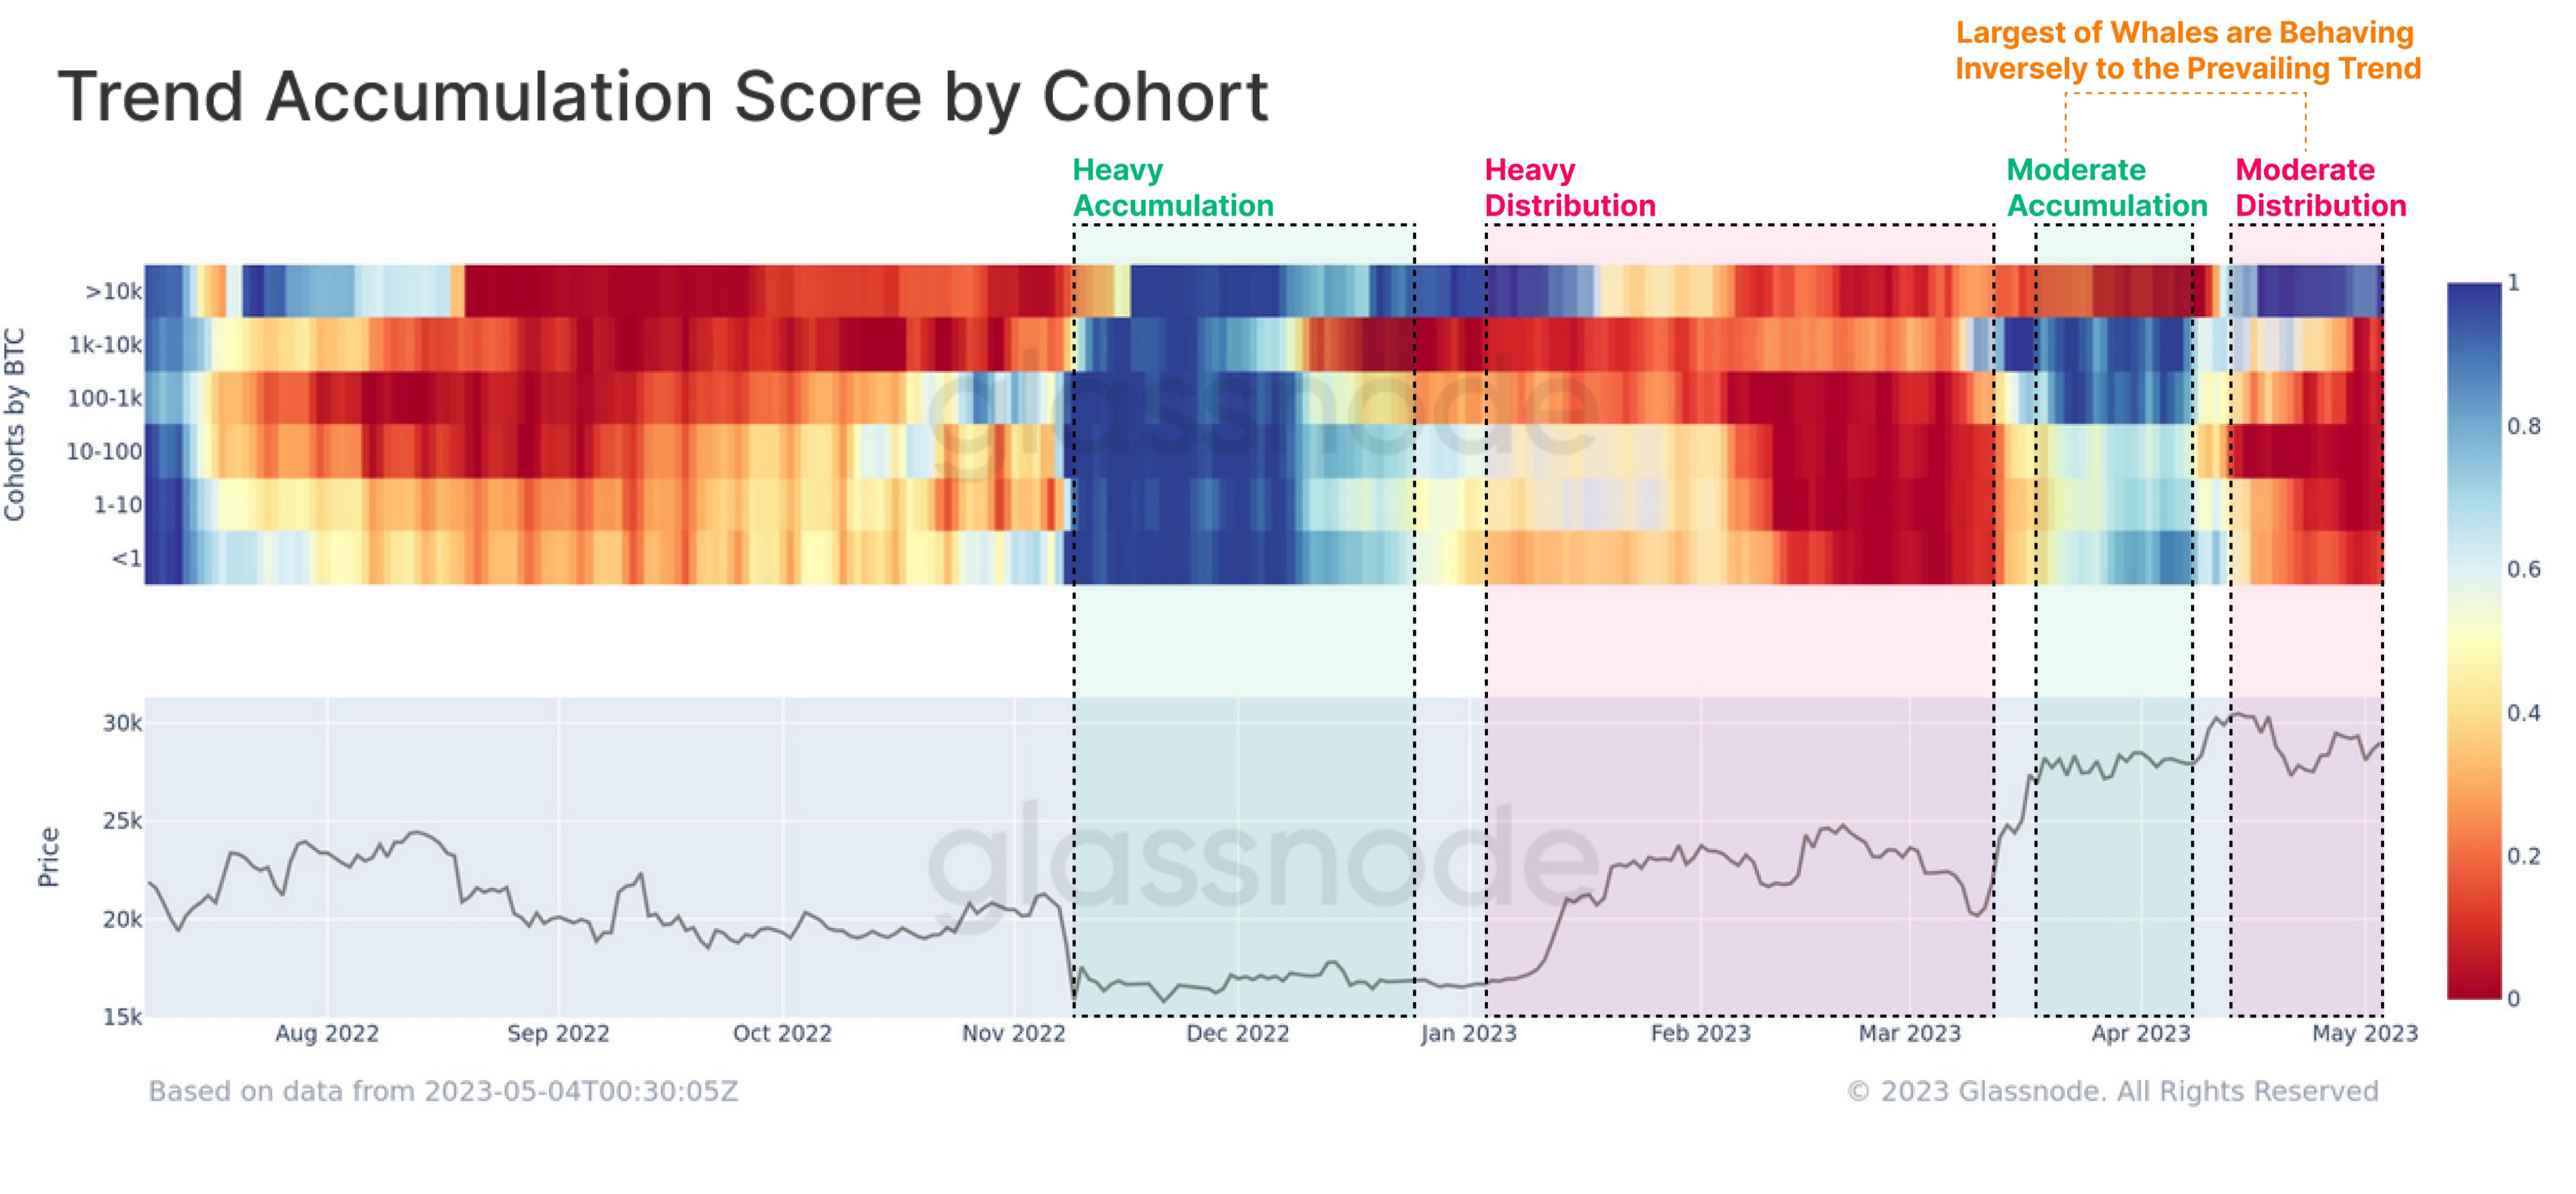
Here, the investors in the market have been divided into six different cohorts based on the amount of BTC that they are carrying in their wallets: under 1 BTC, 1 to 10 BTC, 10 to 100 BTC, 100 to 1,000 BTC, 1,000 to 10,000 BTC, and above 10,000 BTC.
From the above graph, it’s visible that the Trend Accumulation Score for all these groups had a value of about 1 at the bear market lows following the November 2022 FTX crash, suggesting that the market as a whole was participating in some heavy buying back then.
This accumulation continued until the rally arrived in January 2023, when the market behavior started shifting. The holders began distributing during this period, selling especially heavily between February and March. Following this sharp distribution, the rally lost steam, and the price plunged below $20,000.
However, these investors once again started to accumulate as the price sharply recovered and the rally restarted. Though, this time, the accumulation was only moderate.
Interestingly, while the behavior in the market had been more or less uniform in the months leading up to this new accumulation streak (meaning that all the groups had been buying or selling at the same time), this new accumulation streak didn’t have the largest of the whales (above 10,000 BTC group) participating. Instead, these humongous investors were going through a phase of distribution.
Since Bitcoin broke above the $30,000 level in the middle of April 2023, the investors have again been selling, showing moderate distribution behavior.
Like the accumulation phase preceding this selling, the above 10,000 BTC whales haven’t joined in with the rest of the market; they have rather been aggressively accumulating and expanding their wallets. These holders seem to have decided to move in the opposite direction of the general market.
BTC Price
At the time of writing, Bitcoin is trading around $28,900, up 1% in the last week.
FTX bankruptcy judge approves sale of LedgerX

The judge said he read all the papers and declarations related to the FTX debtors’ motion for the sale of LedgerX and was “satisfied” with the proceedings.
US Regional Bank Failures Trigger Bitcoin Surge, $30,000 Level In Sight
Bitcoin (BTC) is on the verge of reaching the $30,000 milestone, but regional banks in the United States face significant anxiety and fear. Investors are concerned about the potential for contagion following the recent struggles of PacWest, a California-based lender.
The bank’s shares have plummeted by as much as 60% overnight, causing it to reassure investors and confirm that it is in talks with potential partners and investors about a deal, as reported by The Telegraph.
Despite insisting that it has not experienced any unusual deposit flows, regional bank stocks are down by more than 5% today, with not one of the 349 banks in the sector seeing gains.
Regional Banks Take A Hit, 130 Stocks Down Over 5%
The fears surrounding regional banks are undoubtedly fueled by the recent failure and sale of First Republic Bank to JPMorgan Chase. This high-profile event has highlighted the potential risks and challenges facing smaller banks, particularly in the current economic climate.

Despite the broader concerns in the financial sector, Bitcoin has climbed above the $29,000 level, up by 1.7% in the last 24 hours, potentially fueled by the ongoing concerns surrounding the US banks.
This suggests that there may be some investors who are turning to alternative assets as a potential hedge against the risks and uncertainties in traditional financial markets, which have shown no signs of relief for the short term.
Furthermore, according to CryptoCon, a Bitcoin market analyst, the accurate BTC bull market is here. This is based on the mid-line crossover of the 3 Week Keltner Channels, a technical indicator measuring volatility and trend in Bitcoin. When BTC crosses over the mid-line, currently priced at $26,500, it is a strong signal that a bull market has begun.

Additionally, CryptoCon notes that historically, Bitcoin has not returned under the mid-line after crossing, supporting the argument that a bull market is underway. According to the analyst, this has been true, as the crossover has consistently brought months of bull market activity.
Bitcoin On The Rise As US Bank Failures Mount
Daan Crypto Trades, a cryptocurrency market analyst, has analyzed Bitcoin’s dominance and potential impact in the broader cryptocurrency market. According to the analyst, Bitcoin dominance, which measures the percentage of the total cryptocurrency market capitalization made up of Bitcoin, is currently trading at its range highs at the 48-49% area.
Daan suggests that if Bitcoin can push through this range and make new local highs, it could move toward 52% or higher. This likely leads to continuing the ongoing trend of Bitcoin dominance, which has increased in recent months.
However, the analyst notes that if Bitcoin remains range-bound between $27-30K, it could lead to a recovery in ALT/BTC pairs, seeing Bitcoin dominance come down. This would suggest that altcoins, or alternative cryptocurrencies to Bitcoin, could outperform Bitcoin in the short term.
When writing, the top cryptocurrency in the market is trading at $29,000. In the past 24 hours, there has been a total liquidation of $100 million in short positions. The question is whether Bitcoin will continue its upward trend or experience a healthy pullback to fill in the liquidity below its crucial resistance levels.
Featured image from iStock, chart from TradingView.com
Microsoft axes Bing wait list, giving users free access to GPT-4

Bing is set to receive several much-requested AI-powered features that could put it in competition with OpenAI’s ChatGPT Plus subscription service.
The Reactionary Political Theater of CBDC Bans
The jury is out on whether the benefits outweigh the risks of central bank digital currencies, but stymying research and passing premature legislation comes with its own harms.
There’s a simple formula for adding crypto to your portfolio

What’s the impact of swapping equities for cryptocurrency? Here’s a formula that may help you answer that question.
Liquid Staking Platform Lido Surpasses 6M Ether Deposits as Shanghai Upgrade Spurs Inflows
Ethereum’s Shanghai upgrade spurred deposit inflows to liquid staking protocols, including to the largest player Lido.
SUI Gets A Bear Introduction On Day 2, Will Sell Pressure Continue?
Yesterday marked a new dawn in the crypto industry as the SUI Layer 1 blockchain launched on Mainnet with its hyped native token SUI. The news of the token launch on major exchanges brought excitement to the crypto community, and SUI did not disappoint as its native token rallied massively, recording over 2,000% in the first hour of listing.
The layer 1 blockchain token was seen to hit the $2.16 mark at the time of its launch and listing on exchanges before it retraced due to selloffs.
However, while crypto investors have been drawn to the opportunities and price potential a layer 1 blockchain token can offer, SUI has temporarily failed to continue its price rally on day 2 of its listing. Bears have sent a welcome message.
SUI Token Price Falls Short On Day 2
The Sui layer 1 blockchain token has experienced a price decline in today’s trading session after a significant rally that followed its launch and listing yesterday on major exchanges.
Related Reading: Polygon (MATIC) Price Shows Vigor, Are Bulls Up To Something?
According to trading data reports from Coingecko, the native token, which trades at $1.33 at the time of writing, is on a negative 38.46% from its 24-hour all-time high of $2.16.
Bears are seen to take over in today’s trading session as the token struggles to hold the price on its red candle on the daily timeframe.
Why Is The Ethereum Killer Falling In Price
The recent price decline of the layer 1 blockchain token may be attributed to selloffs from holders and traders who took part in the SUI recognition sale. Weeks earlier, before the mainnet and token launch, SUI had announced a community access program to enable its community members to receive its native tokens in the “early phases of the network’s life.”
Instead of carrying out airdrops as rewards, the SUI Foundation proposed a recognition sale for its user champions and network supporters. Community members and users eligible for the recognition sale were reported to have met specific requirements as stated by the foundation.
Related Reading: Bitcoin Rips Above $29,000, But Why Is The Mean Transaction Size At A 3-Year Low?
Eligible community members were required to register on a participating exchange, which would then notify them via email on how to purchase the allocated SUI tokens. Bybit, a participating crypto exchange for the recognition sale, made available 1,500 SUI tokens at a unit price of $0.03 for each eligible user purchase.
At this price, each eligible user purchased and received allocations of 1,500 SUI tokens at a total price of $45 before the public listing on May 3, 2023.SUI, upon launch, rallied massively, and at a high of $2, crypto traders who participated in the recognition sale made around $3,000 from their $45 investments.
As it is with airdrops and community recognition sales, the price of the reward token is subject to temporary retracements and price dumps due to selloffs and users cashing out their rewards. While SUI may experience selling pressure, it is important to note that the hype surrounding it is very much active as some call it the Ethereum killer and, as such, may recover in price.
Bitcoin’s price movements also have a major role and effect on the price direction of many altcoins, including SUI, and may dictate if selling pressure continues.
Arbitrum’s Chronos reaches $217M TVL with staking, becomes 8th largest DEX

Chronos set a new TVL milestone just seven days after its launch on the Arbitrum blockchain as DEXs draw traders amid regulatory uncertainty in the United States.
Judge Upholds Freeze on SpartacusDAO’s $35M in Lawsuit Served Via Discord, NFT
Activist investors are suing the leader of SpartacusDAO. He hasn’t shown up in court after ignoring multiple attempts to serve him.
Polkadot (DOT) Under Sell Pressure As Bears Retaliate
Over the last week, Polkadot (DOT) has had trouble gaining traction, falling by 8.41% from April 30 to May 4. However, the price is trading sideways and there might be a modest recovery next week as investors take advantage of this dip to acquire more DOT.
According to CoinMarketCap, Polkadot ranks #11 among all cryptocurrencies with a current market price of $5.75. Polkadot’s 24-hour trading volume is up by 29.40% in 24 hours, while its market cap has also gained 1.57% within the same time frame.
Polkadot’s (DOT) Fear & Greed Index today is 46. This level indicates that bulls are pushing the price up gradually, but the bears are still in their positions.
Over the last few days, Polkadot (DOT) has been showing some bullish signs; so expect a possible recovery within the next few weeks as investors take advantage of the current momentum.
DOT Price Analysis
Polkadot trades between the 200-day simple moving average and the 50-day simple moving average (SMA). This indicates that the market is in a neutral or consolidation phase.
The price does not trend significantly in either direction. During this phase, traders and investors may use the 50-day and 200-day SMAs as support and resistance levels while trading.
Related Reading: Check Out This Shocking Pepe Coin Versus Bitcoin Comparison
However, if the price exceeds the 50-day SMA, it could indicate a short-term uptrend, giving investors a buying opportunity.
The Relative Strength Index (RSI) level of DOT is 41, indicating that its market is heading towards the neutral zone and there’s indecision among investors.
But the 24-hour volume indicator shows that the trading activity is gradually growing, which could mean investors are building interest in the coin. This may increase liquidity and potential price movement in favor of DOT.

The chart above shows the key support and resistance levels of Polkadot (DOT). Polkadot now trades between $5.587 and $6.07 primary support and resistance levels. DOT’s first important resistance level is $6.07. If the price rises above this level, the next resistance levels are $7.970.

Future Developments For Polkadot
Many upcoming developments on the Polkadot network might push its adoption, usage, and price in the nearest future.
For instance, the community voted to onboard a Bridge Hub system parachain to Polkadot. Also, Mythical Games plans to migrate its Mythical Chain to the Polkadot blockchain.
Furthermore, the developers are discussing establishing Polkadot Hubs in South-East Asia, with Bali and Indonesia as the first focus.
These development proposals and discussions depict the team’s effort to enhance the network’s efficiency, connectivity, and interoperability. In time, more adoption and activities may affect DOT prices positively.
Featured image from Pixabay and chart from Tradingview.com
North Carolina House passes bill banning CBDC payments to the state

The latest version of the legislation included limiting the Federal Reserve from using the U.S. state as a potential testing ground for its own CBDC pilot.
How does quantum computing impact the finance industry?

Quantum computing could revolutionize finance by solving complex problems quickly, improving risk management and enhancing cybersecurity measures.
Examining global successes and challenges in regulating crypto: Report

Crypto regulation remains controversial, with different governments taking different approaches, but growing adoption will likely lead to more clarity.
Blockchain Developer Platform Alchemy Launches Public Support for ZK Rollup StarkNet
The blockchain is the first with native account abstraction that the web3 developer platform offers, allowing developers to build applications with Alchemy’s infrastructure on StarkNet.
Coinbase And Ripple CLOs Meet, Will XRP Listing Follow?
A new tweet by Coinbase Chief Legal Officer (CLO) Paul Grewal has sparked interest and speculations in the crypto community. The CLO expressed his appreciation to Ripple’s General Counsel, Stuart Alderoty, for their meeting, stating they needed to meet more often.
In response, Stuart Alderoty thanked him for chatting with their legal team. After the tweet, two top lawyers in the community supported the strategic meeting, and some others called on Coinbase to relist XRP on its marketplace.
Ripple And Coinbase OfficlainsLeading The Battle, Deaton
One of the notable reactions to the meeting between Ripple and Coinbase CLOs came from CryptoLaw founder John Deaton.
Deaton is the attorney representing thousands of XRP holders. His response to the tweet was that the picture shows two valiant General Counsels leading the front line in battle. Further, Deaton wrote that he “tipped his cap” to Alderoty and Grewal to express his respect.
By saying “frontline in battle,” Attorney Deaton reiterates his position that the crypto industry is battling with the US Securities and Exchange Commission. Notably, the attorney shared a tweet to that effect in March, calling every stakeholder in the industry to meet and share strategic ideas to win the war.
Following the recent tweet, the two firms battling SEC’s lawsuit may have listened to Deaton’s suggestion.
Another prominent figure that responded to the recent development was the Australian-based lawyer Bill Morgan. The lawyer stated that teamwork against a common foe is the best strategy to win.
However, Morgan further said he doesn’t regard Coinbase as a friend of XRP holders as it “ceased secondary market trading in its exchange.”
Crypto Users Call For XRP Relisting
Other responses following the recent tweet were calls for Coinbase to relist XRP. A Twitter user going by Jon Mann, who responded, asked Coinbase to relist XRP, stating that the meeting is the tag team the Ripple community has been waiting to see.

Another user XRPcryptowolf also supported the call maintaining that Coinbase should relist XRP if they need Ripple’s help beating the SEC.
There has not been any mention of why the parties met yet. However, the crypto space still hopes for a favorable summary judgment that will bring regulatory clarity for XRP.
Featured image/Pixabay and chart/


