In a shocking twist, Bitcoin (BTC), the undisputed king of cryptocurrencies, has plunged to levels not seen since the early days of 2023.
The battle-hardened Bitcoin bulls have suffered another crushing defeat, leaving investors on edge, anxiously pondering whether the dreaded sub $20,000 abyss will haunt them again.
With relentless uncertainty gripping the market, the burning question lingers: Has Bitcoin truly hit rock bottom, or is BTC in for an even darker descent?
Bitcoin Path Aligned With 1930 Stock Market Crash
According to Mike McGlone, Bloomberg’s Senior Macro Strategist, Bitcoin’s current trajectory bears an uncanny resemblance to the US stock market crash of 1930.
In his analysis, McGlone highlights the clear rollover pattern and downward trend evident in Bitcoin’s 100-week moving average (MA) graphic.
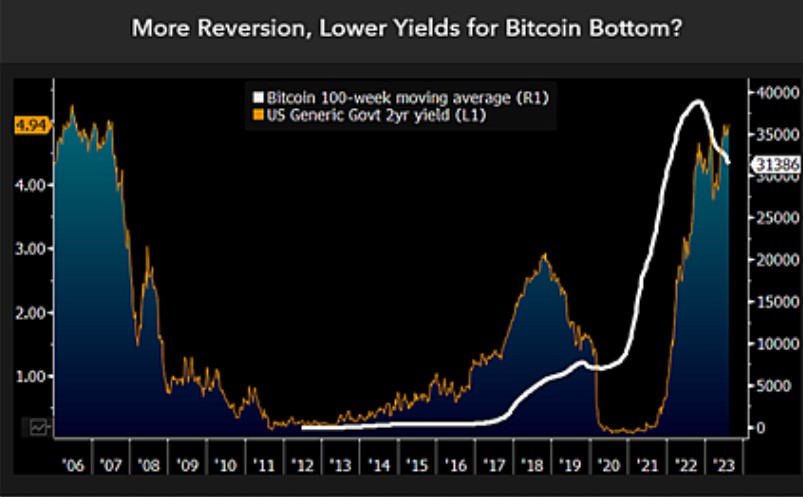
The implications of this pattern, combined with the fundamental principle of “not going against” the Federal Reserve (Fed) and the potential for reversion of one of history’s best-performing assets, warrant serious consideration.
Adding to the potential headwinds for Bitcoin, US Treasury two-year notes yield nearly 5%, marking a historic high in the crypto realm.
Bitcoin, born in the aftermath of the 2008 financial crisis and during a period of highly low-interest rates, may now be facing an extended period of retracement.
According to Mcglone, in an era of near-zero and negative interest rates, the allure of a digital equivalent to gold can be captivating. However, the landscape is shifting as the world’s safest securities offer approximately 10% total return over two years. This shift may pressure the prices of riskier assets, including Bitcoin.
The significance of the US Treasury two-year note’s approximate 5% yield has historical parallels. It harkens back to before the financial crisis and the birth of Bitcoin. This correlation suggests potential headwinds for most risk assets.
McGlone’s analysis, focusing on the 100-week moving averages, reinforces the prevailing downward biases observed in Bitcoin, particularly when compared to the steepest Treasury yield competition witnessed in almost two decades.
Analyst Warns Of Potential Sub-$20,000 Levels
Bitcoin’s recent price trajectory has left many investors uncertain about its future, with some analysts drawing parallels to historical price crashes. Material Indicators co-founder Keith Alan has shared insights on the current market conditions.
Since the beginning of the bear market, Alan has been closely monitoring Bitcoin’s price movements and sharing a chart that suggests the potential for retesting sub-$20,000 levels.
While acknowledging the possibility of short-term scalping opportunities, Alan advises caution and limited exposure to preserve capital for what he believes could be a generational buying opportunity. Notably, Alan emphasizes that he does not believe the bottom has been reached for Bitcoin.
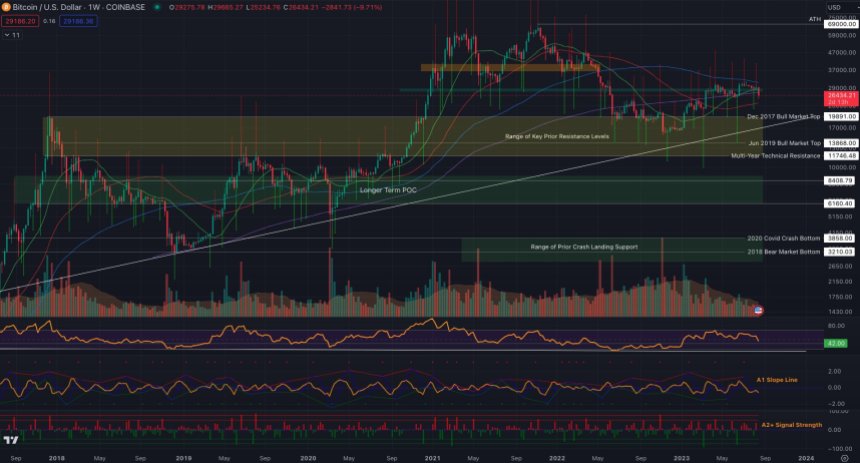
The chart highlights various downrange levels, showcasing Alan’s belief in the potential for further downside movement.
As depicted in Alan’s chart, the Bitcoin market faces a critical juncture where the strength of support at $25,000 is crucial for the bullish case in the near term. Failure to hold this level could lead to a revisit of the December 2017 bull market peak at $19,800.
Adding to concerns for Bitcoin, there is the possibility of continuing the downside momentum, potentially reaching a four-year low around the June 2019 bull market top of $13,800. This scenario would catch many bulls off guard, especially considering the prevailing belief throughout 2023 that the crypto winter was ending.
The momentum has shifted for the most prominent cryptocurrency in the market, and the bulls must defend their remaining support levels to avert an extended decline throughout the remainder of the year.
BTC has briefly reclaimed the $26,000 threshold; however, it remains down by over 7% in the past 24 hours.
Featured image from iStock, chart from TradingView.com


