Solana’s Surge: Here’s Why This Analyst Is Predicting A Rise To $360

Recently, a popular crypto trader and YouTuber has predicted a substantial surge in Solana price, forecasting it could reach as high as $360 soon.

This prediction is underpinned by a technical pattern on Solana’s chart—a bullish signal suggesting a potential reversal from bearish to bullish momentum.

Technical Insights Into SOL Potential $360 Rise

According to the trader, CryptoJack on X,  SOL has developed a “rounding bottom pattern” over an extended period, indicating it is on the brink of a significant breakout.

Notably, the ’rounding bottom’ pattern, characterized by a gradual decline followed by a stabilizing trend and an upward breakout, is a classic bullish indicator in technical analysis.

CryptoJack’s analysis points out that Solana is setting up for a significant uptick, aiming for a price target double its current value of approximately $146.

Not only does CryptoJack see a bright future for Solana, but other analysts, such as Altcoin Sherpa, also maintain a bullish stance, with projections of the token potentially surpassing $500 this year.

This would represent a 300% increase from its current level, adding to the 589% growth it has already achieved year-to-date.

Solana Challenges Ethereum

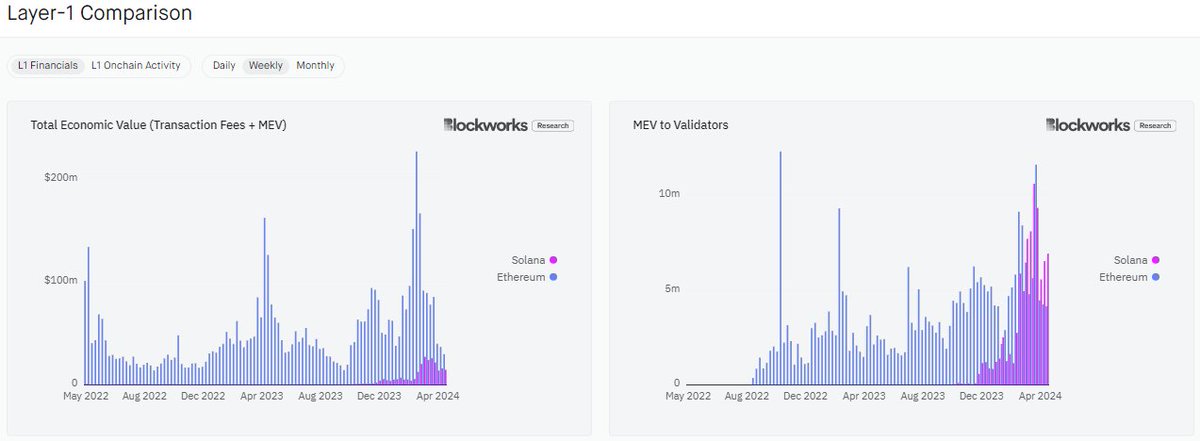
While Solana has shown notable growth, some of its key metrics are also beginning to keep up the pace. Dan Smith, a senior research analyst at Blockworks, suggests that Solana could soon surpass Ethereum regarding transaction fees and capture Maximal Extractable Value (MEV).

Smith’s analysis of X highlights that Solana’s total economic value is nearing Ethereum’s, indicating its increasing relevance in the blockchain space.

Despite this competition, Ethereum maintains a significant lead in daily transaction fees and total value locked (TVL). In the last 24 hours, Ethereum generated over $2.75 million in fees, compared to Solana’s $1.49 million.

Solana vs Ethereum transaction fees.

Moreover, according to data from DeFillama, Ethereum’s TVL of over $53 billion dwarfs Solana’s $3.96 billion, representing just about 7.2% of Ethereum’s scale.

Meanwhile, Ethereum does not come close to Solana in terms of market performance. Solana has seen quite outstanding growth in the past year, surging by over 500%. On the other hand, Ethereum has only seen a 66% surge over the same period.

NewsBTC News Analysis Learn Directory Events CasinosTry Play GamesTry Crypto CasinoTry No KYC CasinoNew Breaking News: BREAKING: Former Binance CEO CZ Behind Bars: Sentenced To Jail For 4 Months News Analysis Learn Directory Events CasinosTry Play GamesTry Crypto CasinoTry No KYC CasinoNew Bitcoin (BTC) Bitcoin’s Make-Or-Break Moment: Trading Guru Predicts Rally Amid Market Uncertainty Samuel Edyme by Samuel Edyme May 3, 2024 in Bitcoin News Reading Time: 3 mins read Seasoned trader Peter Brandt has reignited discussions with a bullish Bitcoin forecast that could see the premier cryptocurrency soar to new heights. Amid skepticism and divergent market opinions, Brandt’s projection places Bitcoin on a potential path to reclaim its all-time high near $74,000. Related Reading: Bitcoin Bull Run Over? Analyst Predicts What To Expect Now Brandt’s Bullish Bitcoin Vision Peter Brandt, synonymous with market foresight, recently outlined a scenario where Bitcoin could experience a significant rally. His analysis, shared via a social media post on X with a BTC analyzed chart, suggests Bitcoin’s recent price movements align with patterns historically indicative of a bull market’s continuation. Despite the market’s recent downturns, Brandt’s projection points towards a potential surge to $74,000, a figure mirroring Bitcoin’s peak valuation. While Brandt’s optimistic outlook for Bitcoin has garnered attention, it also faces scrutiny from parts of the crypto community. Critics point to his past predictions, including significant downturns and peak valuations, as a reason for caution. 570% up to 12 BTC + 300 Free Spins for new players & 1 BTC in bonuses every day, only at Wild.io. Play Now! Bruh was writing articles about Bitcoin Top and now saying it’s a correction. Come on man, Choose a side. — Sial (@aftabsial8) May 2, 2024 In response, Brandt emphasizes the critical role of adaptability in trading, noting: I can tell you know that you will end up losing all your capital. I’ve supported myself by trading for 50 years and know that successful traders have and execute the ability to be flexible. I’ll welcome your money. Split On Market Forecast Meanwhile, the broader crypto analyst community remains divided. Some echo Brandt’s sentiments, seeing the market’s current state as a temporary correction before a bullish reversal. Others, like analyst Scott Melker, suggest more bearish outcomes. They note the absence of key support levels that could lead to further declines if not held. Melker’s analysis indicates that, without these supports, Bitcoin could freefall to as low as $52,000. BitStarz Player Lands $2,459,124 Record Win! Could you be next big winner? Further complicating the landscape are indicators like the Relative Strength Index (RSI), which Melker points out has not reached oversold levels — typically a sign of a potential rebound. $BTC Daily Broke and retested range lows as resistance. Nothing but air until around $52,000 on the chart. My biggest concern I have been discussing for months (in newsletter) is that RSI never made the trip to oversold. Almost there now, all lower time frames oversold. This… pic.twitter.com/5YZTWipBo8 — The Wolf Of All Streets (@scottmelker) May 1, 2024 This absence suggests a tepid confidence among investors, potentially paving the way for further price drops. Related Reading: Bitcoin Slide Over? Top Analysts Unanimously Call $56,000 The Bottom Despite the debates and technical analyses, the sentiment among some traders remains buoyantly optimistic. Traders like Marco Johanning argue that the structural market dynamics still favor a bull market scenario. This suggests that Bitcoin’s current price adjustments are part of a broader upward trend that will resume soon. Solana (SOL) price chart on TradingView

Featured image from Unsplash, Chart from TradingView

Bitcoin’s Bold Bet: Options Traders Eye $100K Surge By September

The crypto market is currently buzzing with anticipation as Bitcoin options traders position themselves for what they foresee as a “substantial price rally” in September.

Particularly, the derivatives market is expressing confidence, with a significant number of traders betting on Bitcoin surpassing the $100,000 mark.

Bitcoin Market Optimism Amidst Whale Movements

Recent analysis from industry experts highlights a significant trend in Bitcoin options that points to growing optimism among traders. According to insights from QCP Capital, a noticeable shift has occurred in the risk reversals landscape, with calls (options to buy) now priced higher than puts (options to sell).

QCP Capital noted that this change underscores a “stronger demand” for potential price increases rather than hedges against declines.

The preference for call options, particularly those pegged at ambitious strike prices of $75,000 and $100,000 for September, underscores the bullish sentiment permeating through the market.

Data from the Deribit derivatives exchange corroborates this trend, revealing that call options with a strike price of $110,000 for the end of September are currently seeing the highest volume.

Bitcoin top options volume.

This enthusiasm in the options market is a strong indicator of the traders’ bullish outlook for Bitcoin, suggesting that many are betting on a significant price uptick by the end of the third quarter.

However, the skies are not clear. Bitfinex analysts have pointed out actions by Bitcoin whales that might signal potential short-term volatility. The whale ratio on exchanges—a metric indicating the amount of Bitcoin large holders are moving to exchanges—has seen an uptick.

Bitcoin Exchange Whale Ratio.

This could typically suggest that these major players are considering selling, which could introduce increased sell pressure in the market.

Bitfinex’s recent Alpha report revealed that while the short-term holders of Bitcoin seem to be at a pivot point with a realized price of $58,700 acting as an “important support level,” the increased activity by whales on exchanges might lead to heightened price fluctuations.

Long-Term Perspectives And Market Recoveries

Despite these potential short-term pressures, the broader Bitcoin market has shown signs of recovery. After a drop from its peak above $73,000 in March, Bitcoin has demonstrated resilience with a 5.8% increase over the past week and a 2.8% rise in the last 24 hours alone. This recovery has brought its trading price to around $63,791 at the time of writing.

Bitcoin (BTC) price chart on TradingView

Adding to the long-term confidence in Bitcoin, Michael Saylor of MicroStrategy shared his views on the future catalysts for Bitcoin’s price.

In his perspective, regulatory decisions, particularly those rejecting spot exchange-traded funds (ETF) applications for other cryptocurrencies, will further solidify Bitcoin’s standing as an unmatched digital asset.

Saylor disclosed that this regulatory moat could potentially steer more institutional investments towards Bitcoin, as it remains the ‘steel’ of the cryptocurrency world—unparalleled and indispensable.

Featured image from Unsplash, Chart from TradingView

Dogecoin on the Rise: Over 5 Million Wallets Now Profitable As Potential Surge Looms

So far, Dogecoin has emerged as a significant player among the largest altcoins, exhibiting signs of a strong comeback, particularly highlighted by the recent profitability of numerous wallet addresses.

A Surge In Dogecoin Profitable Addresses

Recent data from IntoTheBlock reveals a notable uptick in the profitability of Dogecoin addresses. Of the myriad wallets in the Dogecoin ecosystem, roughly 82.66%, representing approximately 5.21 million addresses, are currently profitable.

According to data from IntoTheBlock, the profitability price range remains between $0.143 and $0.150.

Dogecoin addresses metric.

Conversely, a smaller segment of the network, about 13.5% or 850,400 addresses, remains in the red. These addresses are positioned to turn profitable if Dogecoin’s market price is between $0.183 and $0.671.

An intriguing midpoint exists where approximately 3.83% of addresses, totaling 241,340, will break even if prices reach between $0.150 and $0.167.

DOGE’s Market Dynamics And Future Prospects

Despite the positive sentiment, Dogecoin’s journey is not devoid of challenges and speculative dynamics. The meme coin, often buoyed by social media trends and celebrity endorsements, particularly from figures like Elon Musk, is gaining traction through technical milestones and broader ecosystem developments.

Analytical experts like Ali have pointed out significant patterns on Dogecoin’s charts that echo its historical rallies. Notably, Ali identifies a recurring descending triangle breakout akin to those seen before substantial price surges in 2017 and 2021.

If historical patterns hold true, Dogecoin might revisit its all-time high and potentially exceed it, with targets set ambitiously at $1.2 and even $6 in the ongoing bull cycle.

Furthermore, sentiments from market analysts like Altcoin Sherpa reinforce the bullish outlook for Dogecoin. Sherpa’s analysis, based on long-term consolidation phases and current market positioning, suggests that Dogecoin could outperform other cryptocurrencies significantly this year. Sherpa noted:

DOGE is looking good. I strongly feel like this is going to be a strong coin for 2024. I think averaging between $.12 and $.14 would be a solid play and this one should outperform many other tokens for a lot of reasons. It chopped for almost 2 years, it’s going to moon later.

Meanwhile, Dogecoin’s price has recently experienced a notable uptick, rising over 10% in the past week. However, in the last 24 hours, it has slightly declined by 2.4%, trading at $0.155 at the time of writing.

Dogecoin price is moving sideways on the 4-hour chart. Source: DOGE/USDT on TradingView

Featured image from Unsplash, Chart from TradingView

Ethereum’s Wild Fluctuations: Here’s What ETH Implied Volatility Tells Us

The cryptocurrency market has recently exhibited distinct divergences in the behavior of its two leading assets, Bitcoin and Ethereum. While Bitcoin appears to be stepping into a phase of relative stability, Ethereum’s journey paints a contrasting picture of sustained uncertainty, particularly in its options market.

This divergence is highlighted by the sustained high levels of implied volatility associated with Ethereum options, signaling a cautious outlook among investors regarding its future price movements.

Ethereum Persisting Volatility: A Comparative Analysis

Implied volatility (IV) serves as a crucial indicator in the options market, providing insights into the expected price fluctuations of an asset over a specific period. It reflects the market’s temperature, gauging the intensity of potential price movements traders anticipate.

Recent analyses suggest that while Bitcoin’s implied volatility has settled down significantly post-halving, Ethereum’s has not followed suit. As Bitcoin’s IV dipped to a multi-month low, indicating a calming market, Ethereum’s IV remains stubbornly high.

Contrary to the calming waves in the Bitcoin market, Ethereum wrestles with heightened volatility. According to data from Bitfinex Alpha Report, Bitcoin’s volatility index sharply declined from 72% at the time of its latest halving event to about 55%.

Bitcoin (BTC) implied volatility.

On the other hand, Ethereum saw a more modest reduction in its volatility index, dropping from 76% to 65% in the same period. This persistent volatility in Ethereum’s market is primarily fueled by uncertainties surrounding significant upcoming regulatory decisions and broader market implications.

Ethereum (ETH) implied volatility.

The Ethereum market is particularly jittery in anticipation of the US Securities and Exchange Commission’s (SEC) impending decision on two spot Ethereum ETFs, slated for late May 2024.

This upcoming regulatory milestone is considered a critical event that could either catalyze a major market move or exacerbate the current volatility.

The Bitfinex Alpha report underscores that regulatory uncertainty is a primary driver behind Ethereum’s less significant drop in its Volatility Risk Premium (VRP) compared to Bitcoin’s.

ETH And BTC Show Signs of Recovery Amid Volatility

Ethereum and Bitcoin have shown signs of recovery over the past week in terms of trading performance. Bitcoin has seen a 4.1% increase, while Ethereum reported a more modest gain of 2.4%.

Ethereum (ETH) price chart on TradingView

However, the last 24 hours have been less favorable for Ethereum, with a slight dip of 0.7%, underscoring the ongoing volatility and investor caution.

Moreover, Ethereum’s network dynamics also reflect a subdued activity with a marked decrease in ETH burn rate attributed to reduced transaction fees.

This technical aspect further complements a cautious Ethereum market narrative, poised on the brink of potentially significant shifts depending on external regulatory actions.

Despite all these, analysts like Ashcrypto suggest that the current volatility could set the stage for a strong rebound in the year’s third quarter. Drawing on historical patterns, Ethereum’s speculative forecast is potentially reaching the $4,000 mark, provided market conditions align favorably.

Featured image from Unsplash, Chart from TradingView

Ethereum Burn Rate Hits Yearly Low: What This Means For ETH’s Future

In recent weeks, Ethereum has displayed subtle signs of recovery amidst a generally bearish crypto market, with the altcoin mimicking Bitcoin’s modest uptrend.

Despite Ethereum’s price increasing slightly by 0.2% over the last 24 hours, a parallel trend that might significantly affect Ethereum’s economic model has been unfolding beneath the surface.

Decline In Network Activity Reduces ETH Burn

April witnessed Ethereum’s ETH burn rate hitting an annual low, primarily due to a significant decrease in network transaction fees.

These fees have typically fluctuated just below 10 gwei this year, but recent weeks have seen them dip to some of the lowest levels, directly influencing the rate at which ETH is burned.

Ethereum Average Gas Fee.

This reduced burn rate is evidenced by the stark drop in daily burned ETH, which reached a low of 671 ETH in the past day a notable decrease from the daily figures of 2,500–3,000 ETH seen earlier in the year.

Ethereum Burn Rate in the past day.

Such a decline in burn rate is not merely a statistical anomaly but a reflection of broader shifts within the Ethereum network.

A significant factor contributing to the lowered gas fees is the increased migration of network activities to Layer 2 solutions, which enhance transaction speeds while lowering costs.

Moreover, innovations like blob transactions, introduced in Ethereum’s recent Dencun upgrade, have further optimized costs on these secondary layers.

Notably, Blobs are a feature introduced to enhance Ethereum’s compatibility with Layer 2 solutions like zkSync, Optimism, and Arbitrum by efficiently managing data storage needs. This functionality is part of the Dencun upgrade, which integrates proto-danksharding via EIP-4844.

While beneficial in reducing transaction fees, these technological strides pose challenges to Ethereum’s deflationary mechanisms.

This upgrade introduced a new fee structure in which a part of every transaction fee, the base fee, is burned, potentially reducing the overall ETH supply. However, with decreased transaction fees, the anticipated deflationary pressure via burning has softened, signaling a shift to a more inflationary trend in the short term.

According to Ultrasoundmoney, Ethereum’s supply dynamics have swung to a mildly inflationary mode with a growth rate of 0.498%. This shift could realign if network activity intensifies, leading to increased transaction fees and, consequently, higher burn rates.

Ethereum supply growth rate.

Ethereum Market Response

Despite these underlying network dynamics, Ethereum’s market price has struggled to regain its former highs above $3,500. The asset trades around $3,085, reflecting a slight downturn over recent weeks.

Ethereum (ETH) price chart on TradingView

This price behavior underscores the broader market’s reaction to internal network changes and external economic factors, such as regulatory struggles from the US Securities and Exchange Commission (SEC) and macroeconomic uncertainties.

Looking ahead, the trajectory of Ethereum’s gas fees and subsequent ETH burn rate will be crucial in determining the sustainability of its economic model.

Featured image from Unsplash, Chart from TradingView

Shiba Inu Stands Strong: Over 650K Wallet Addresses Still Profitable Amid Recent Price Drop

Shiba Inu (SHIB) has demonstrated resilience despite recent market downturns. Data reveals that roughly over 700 trillion SHIB tokens held by more than 650,000 wallet addresses remain profitable, reflecting steadfast confidence among holders in the token’s long-term value.

Shiba Inu Market Resilience Amid Volatility

Recent on-chain analytics have uncovered an interesting trend among Shiba Inu investors. Despite a general dip in SHIB’s market price, investors continue to hold a substantial volume of tokens—totaling 733 trillion—showing unrealized gains.

These holdings, maintained by approximately 653,530 individual wallets, were acquired at prices ranging from $0.000002 to $0.000022, averaging out at $0.000011.

This indicates not only a significant level of acquisition but also a broad base of investors who entered the market at lower valuations, positioning themselves in profit despite the coin’s fluctuating fortunes.

The “Break Even Price” indicator, a crucial tool derived from on-chain data, suggests that many SHIB holders are still in the green financially. This could point to a collective strategy among holders to weather short-term price movements, with an eye on potential long-term returns.

Break even price for Shiba Inu.

Such data reinforces the notion of SHIB as more than just a speculative asset, hinting at a deeper conviction among its community regarding the token’s future potential.

Long-Term Outlook And Ecosystem Developments

Despite a decline of 5.2% over the past week and 11.9% over the past month, Shiba Inu has seen a recent uptick of 3.3% in its price in the last 24 hours, trading at $0.00002389. Shiba Inu (SHIB) price is moving sideways on the 4-hour chart. Source: SHIB/USDT on TradingView.com

Notably, this upward trajectory in value mirrors the asset’s trading volume, which has also surged from below $400 million last week to above $600 million as of today.

This recovery aligns with significant developmental strides within the Shiba Inu ecosystem, particularly the completion of a hard fork in its Layer-2 blockchain solution, Shibarium.

The Shibarium hard fork, executed at block height 4504576, introduced enhancements aimed at improving usability and transaction efficiency. This was a response to community feedback advocating better performance and lower costs.

This upgrade is expected to boost transaction speeds and stabilize transaction fees on Shibarium, making costs more predictable for users.

Moreover, the recent hard fork’s dual focus—enhancing the Bor and Heimdall components of Shibarium—aims to refine the platform’s technical infrastructure.

By improving the calculation of state sync confirmation and ensuring deterministic finality, the Shiba Inu team appears keen on improving the network’s reliability and scalability.

Featured image from Unsplash, Chart from TradingView

Bitcoin’s Make-Or-Break Moment: Trading Guru Predicts Rally Amid Market Uncertainty

Seasoned trader Peter Brandt has reignited discussions with a bullish Bitcoin forecast that could see the premier cryptocurrency soar to new heights.

Amid skepticism and divergent market opinions, Brandt’s projection places Bitcoin on a potential path to reclaim its all-time high near $74,000.

Brandt’s Bullish Bitcoin Vision

Peter Brandt, synonymous with market foresight, recently outlined a scenario where Bitcoin could experience a significant rally.

His analysis, shared via a social media post on X with a BTC analyzed chart, suggests Bitcoin’s recent price movements align with patterns historically indicative of a bull market’s continuation.

Despite the market’s recent downturns, Brandt’s projection points towards a potential surge to $74,000, a figure mirroring Bitcoin’s peak valuation.

While Brandt’s optimistic outlook for Bitcoin has garnered attention, it also faces scrutiny from parts of the crypto community. Critics point to his past predictions, including significant downturns and peak valuations, as a reason for caution.

In response, Brandt emphasizes the critical role of adaptability in trading, noting:

I can tell you know that you will end up losing all your capital. I’ve supported myself by trading for 50 years and know that successful traders have and execute the ability to be flexible. I’ll welcome your money.

Split On Market Forecast

Meanwhile, the broader crypto analyst community remains divided. Some echo Brandt’s sentiments, seeing the market’s current state as a temporary correction before a bullish reversal.

Others, like analyst Scott Melker, suggest more bearish outcomes. They note the absence of key support levels that could lead to further declines if not held. Melker’s analysis indicates that, without these supports, Bitcoin could freefall to as low as $52,000.

Further complicating the landscape are indicators like the Relative Strength Index (RSI), which Melker points out has not reached oversold levels — typically a sign of a potential rebound.

This absence suggests a tepid confidence among investors, potentially paving the way for further price drops.

Despite the debates and technical analyses, the sentiment among some traders remains buoyantly optimistic. Traders like Marco Johanning argue that the structural market dynamics still favor a bull market scenario. This suggests that Bitcoin’s current price adjustments are part of a broader upward trend that will resume soon.

Bitcoin (BTC) price chart on TradingView

Featured image from Unsplash, Chart from TradingView

Massive SHIB Movement Ignites Market Speculation: Is A Big Surge On The Horizon?

Shiba Inu (SHIB) is capturing significant attention following a colossal transfer of tokens and a prediction of a bullish breakout.

This event has piqued the curiosity of both traders and analysts alike, sparking debates and expectations about the future trajectory of this popular meme coin.

Large SHIB Token Transfer Sparks Speculation

Recently, the crypto community witnessed an extraordinary transaction involving the movement of nearly two trillion SHIB tokens from the trading platform Robinhood to an undisclosed wallet.

This transfer, identified by Whale Alert, a blockchain tracking service, involved two tranches of 875 billion SHIB each, culminating in a total of 1.75 trillion SHIB. Valued at approximately $39.2 billion, this movement has led to rampant speculation about the potential implications for the SHIB market.

The timing and scale of this transaction have raised questions about its motives, whether it be a strategic move by a major investor or simply a reallocation within diverse portfolios. The lack of clarity surrounding the destination wallet adds intrigue and uncertainty within the trading community.

Bullish Forecasts Amidst Market Corrections

Amidst this massive token movement, cryptocurrency analysts have been closely monitoring SHIB’s performance. Notably, Ali Charts, a respected figure in the crypto analysis sphere, has projected a potential bullish breakout for SHIB.

Ali suggests that SHIB could reach as high as $0.000072323 and advises traders to consider buying around the $0.000018343 mark to capitalize on the anticipated surge.

Shiba Inu (SHIB) price chart on TradingView

Meanwhile, Shiba Inu’s 8% decline last week, juxtaposed with a 7.8% increase in the past day, illustrates the volatile nature of meme coin investments.

Analysts like Bunchhieng have recently speculated that Shiba Inu could reach $0.0001. This projection is based on SHIB’s 2021 rally patterns, suggesting a repeat could propel the meme coin to new highs.

Bunchhieng emphasized that similar historical trends might lead to significant price movements for Shiba Inu, considering the increased burn rate that could positively impact its valuation.

Addressing skepticism regarding SHIB’s market cap and potential growth, Bunchhieng reassured that the crypto sector often defies conventional expectations, opening possibilities for substantial gains.

Adding to the optimistic forecasts, notable cryptocurrency investor Armando Pantoja predicted that SHIB could climb to $0.001 by the end of 2025, citing long-term growth factors and market dynamics.

Featured image from Unsplash, Chart from TradingView

Bitcoin Hits ‘Danger Zone’: Peter Schiff Warns Of ‘Do or Die’ Scenario

Bitcoin is facing a critical juncture as it has entered a ‘danger zone,’ according to prominent gold advocate Peter Schiff. This investor, known for his skepticism toward Bitcoin, suggests that the cryptocurrency is entering a “do or die” phase, potentially marking the end of its bullish run if current trends continue.

Breaking Points And Bearish Signals

Peter Schiff has often voiced his bearish outlook on Bitcoin, and his latest comments come as Bitcoin has just slipped below the crucial $60,000 mark.

This level had previously served as strong support during the short-term bull run, and its breach has intensified the bearish sentiment among investors. Schiff warns that staying below this threshold could spell doom for the bullish fervor, potentially derailing Bitcoin’s momentum.

At the time of writing, Bitcoin is trading at approximately $57,054, teetering close to its 100-day Exponential Moving Average (EMA). Schiff points out that remaining below this EMA could confirm a bearish trend, signaling an end to the rally.

Amidst these developments, the market has seen an increase in trading volume, coupled with the price drop, indicating strong selling pressure.

Over the last 24 hours, Bitcoin’s trading volume has dropped from $45 billion to $48 billion, coinciding with a 6.3% price dip during the same period. This heightened activity is a traditional bearish indicator, lending weight to Schiff’s prediction of a downturn.

Moreover, investor sentiment is treading thin ice with significant outflows from Bitcoin spot ETFs, hitting a weekly high of $162 million. This departure of funds is particularly poignant as it unfolds just before the FOMC meeting, where potential interest rate hikes are on the agenda.

These outflows reflect a broader market trend, with the Grayscale Bitcoin Trust (GBTC) experiencing a substantial daily outflow of $93.23 million.

The Bitcoin ETF Conundrum And Market Forecasts

It is worth noting that last month was quite challenging for US Bitcoin ETFs. After a promising start with positive inflows in the initial months following their launch, April witnessed collective outflows amounting to $182 million across all active spot Bitcoin ETFs in the US.

This pullback is attributed to macroeconomic concerns and geopolitical tensions, which have clouded the investment landscape.

Bitcoin (BTC) price chart on TradingView

As the market braces for further turbulence, analysts such as Micheal Van de Poppe are forecasting an additional correction, potentially pushing Bitcoin’s price down to $55,000 before any sign of recovery.

Featured image from Unsplash, Chart from TradingView

Bitcoin Bottom Out? Analyst Signal Turnaround Amid Market Slump

Bitcoin has recently concluded April, marking its most significant monthly decline. Despite the bearish momentum, leading market analysts, including Michael van de Poppe, believe that the worst may soon be over, suggesting that Bitcoin is nearing the end of its current correction phase.

Bitcoin At The End Of Correction?

April was challenging for Bitcoin, as its value plunged nearly 20%, dipping below $57,000, the lowest level traded since late February.

This drop is part of an intense market sell-off that has slashed the combined cryptocurrency market cap by nearly 10%, bringing it down to $2.2 trillion. Amid these declines, Michael van de Poppe, a revered figure in the crypto analysis space, provided hope.

In his recent statements on the social platform X, Van de Poppe suggested that Bitcoin’s current price levels might be nearing the bottom of this correction cycle.

Bitcoin (BTC) price chart on TradingView

He highlighted the critical price range of $56,000 to $58,000 as pivotal for Bitcoin’s short-term trajectory, indicating potential areas for a rebound.

A Closer Look At Predictions And Market Sentiments

Van de Poppe isn’t alone in his optimistic outlook. Other analysts, like Checkmate, an on-chain expert, have analyzed Bitcoin’s historical data to predict future movements.

Checkmate introduced the term “chopsolidation,” describing it as a phase of stagnant yet volatile market conditions that could precede a significant bullish run.

He expects this phase to last about six months, followed by a potential 6 to 12 months of explosive growth reminiscent of past cycles. Furthermore, historical data from Bitcoin’s Halving years support the theory that after a halving event, the market tends to perform strongly towards the end of the year.

However, there are not all optimistic forecasts in the crypto realm. The spot Bitcoin ETF market witnessed over $300 million in net outflows in April, breaking a three-month streak of inflows, reflecting a broader sentiment of caution among investors.

Moreover, Charles Edwards, founder of Capriole Investments, has voiced concerns over the market’s extraordinary bullishness, warning of the necessity for corrections within such a volatile asset class.

Featured image from Unsplash, Chart from TradingView

Upcoming Token Releases: These Altcoins Are Set To Inject Billions Into The Crypto Market By May

May 2023 is poised to become a landmark month for the crypto market, with major token releases slated to inject substantial liquidity and potentially catalyze shifts in market dynamics.

Key developments from AEVO and PYTH and significant contributions from other projects are set to channel over $3 billion into the sector.

Substantial Crypto Releases Set the Stage

Token Unlock, a platform dedicated to tracking the release schedules of digital assets, indicates that May will witness one of the most substantial influxes of tokens into the cryptocurrency market this year.

At least 20 crypto projects are preparing to unleash tokens worth more than $10 million each, cumulatively amounting to $3.661 billion. These releases underscore the activity and continuous growth within the crypto sector, even amid fluctuating market conditions.

Among the tokens set to be released, AEVO and PYTH stand out with their billion-dollar injections, underscoring their strong market presence and investor confidence.

AEVO, a decentralized exchange, is scheduled to release 827.6 million AEVO tokens on May 15, which surpasses $1.25 billion at current valuations. This release will dramatically increase AEVO’s circulating supply by 757.95%

PYTH Network, known for providing decentralized market data, plans to follow suit with its considerable token release. On May 20, PYTH will distribute 2.13 billion tokens, valued at around $1.21 billion, representing 141.67% of its existing circulating supply.

Such movements are pivotal for the projects and the broader market, influencing liquidity and potentially price stability.

In addition to AEVO and PYTH, Wu Blockchain reports that Token Unlock has identified several other cryptocurrencies set for significant releases in May.

These include DYDX, ENA, SUI, MEME, GAL, MAVIA, APT, STRK, ARB, APE, IMX, ROSE, PIXEL, and AVAX. ID, YGG, OP, and PRIME are poised to release tokens valued at over $10 million each, rounding out a comprehensive list for the month.

Anticipating An Altcoin Surge

Meanwhile, El Crypto Prof, a prominent crypto analyst on X, recently projected a significant rally for the altcoin market based on historical market cycles. He notes that post-Bitcoin halving periods, like those in 2016 and 2020, typically lead to a phase of accumulation in altcoins, followed by a market rally.

The analyst suggests the current market mirrors these past cycles, indicating a potential upcoming surge. He believes this could result in the altcoin market cap potentially doubling from its current estimate of around $1 trillion to $2 trillion.

Additionally, Daan Crypto Trades, another analyst, supports the view that the ETH/BTC ratio is a more accurate measure of altcoin market sentiment than the SOL/BTC ratio, signaling positive prospects for altcoins.

Crypto market cap excluding BTC on TradingView

Featured image from Unsplash, Chart from TradingView.

Bitcoin’s Profit Crunch: Hash Price Hits Record Low Post-Halving—What’s Next For Miners?

In Bitcoin mining, the activity’s profitability is significantly influenced by a metric known as the ‘hash price.’ This metric has recently plummeted to unprecedented levels, causing concerns within the mining community.

Bitcoin’s Latest Halving Sends Hash Price Into Freefall

As Bitcoin underwent its fourth halving event on April 20, expectations were high regarding a potential increase in miner revenue. However, contrary to these expectations, the hash price witnessed a steep decline, currently valued at less than $50 per PH/s per day.

Bitcoin Hashprice Index

The concept of hash price, developed by Luxor, a Bitcoin mining services company, helps understand the daily dollar earnings a miner can expect per unit of hashing power.

Despite Bitcoin’s hash rate remaining strong, the halving event, which reduced the mining reward from 6.25 BTC to 3.125 BTC per block, has exerted downward pressure on the critical profitability metric.

This reduction in potential earnings comes when the overall cryptocurrency market, including Bitcoin, is experiencing volatility.

This downturn in hash price is not isolated but coincides with other declining metrics in BTC. According to TradingView, Bitcoin’s dominance index has also reduced, highlighting a decrease in capitalization relative to the total crypto market.

Bitcoin’s dominance has declined from 57.10% mid-month to approximately 54.69% today. Concurrently, Bitcoin’s market value has also trended downward; over the past week, the cryptocurrency experienced a decrease of about 4.4%.

This downward trend persisted into the past day, with Bitcoin’s price dropping an additional 0.8%.

Bitcoin (BTC) price chart on TradingView

Signs Of A Bullish Future Amid Bitcoin Current Slump

Despite the downward turns, analysts like those from CryptoQuant suggest that bullish signals might still be on the horizon. They point to the Adjusted Spent Output Profit Ratio (aSOPR), which, despite current market indecisiveness, continues to exhibit bullish trends.

Moreover, expert analysts like Rekt Capital have weighed in with a long-term perspective, suggesting that Bitcoin could see a significant rally as part of this halving cycle, drawing parallels with previous cycles.

Historical data shows that Bitcoin typically reaches a market peak within 500-550 days post-halving. If these patterns hold, Bitcoin could be poised for substantial gains by mid to late 2025, reinforcing the cyclical nature of this leading digital asset’s market movements.

Overall, while the immediate effects of the halving on hash price and market dynamics paint a sad picture, the underlying data indicates a mix of caution and optimism.

Featured image from Unsplash, Chart from TradingView

Cracking the Crypto Code: ETH/BTC Signals The Next Altcoin Explosion – Here’s How

Recently, a seasoned crypto investor, Daan Crypto Trades, offered a fresh perspective on evaluating altcoin market sentiment.

Daan believes the ETH/BTC ratio is a superior indicator of altcoin market sentiment over the SOL/BTC ratio, showing data that suggests the potential for an upcoming altcoin season.

ETH/BTC vs. SOL/BTC: Decoding The True Alts Barometer

Daan Crypto Trades has challenged the emerging view that SOL/BTC might be a better gauge for altcoin strength, arguing instead for the enduring relevance of ETH/BTC. According to Daan, while Solana’s performance has been notable, it hasn’t significantly impacted Bitcoin’s dominance, which remains strong.

This observation suggests that SOL/BTC may not accurately reflect broader alternative coins market trends. On the other hand, ETH/BTC has historically mirrored shifts in altcoin market sentiment more closely, making it a more reliable metric.

This distinction is crucial for investors seeking to understand the real-time health and potential shifts within the broader altcoin market.

Daan’s analysis points out that significant movements in the ETH/BTC ratio have often preceded dynamic phases in the altcoin market, commonly referred to as ‘altcoin seasons.’ These periods are characterized by rapid price increases across altcoins, often outpacing Bitcoin.

Signs Of An Emerging Altcoin Season?

Current market analysis by Daan and on-chain data from Santiment underline a brewing sentiment that could lead to another alternative coins season. Santiment’s report highlights an unusual accumulation pattern across altcoins, with their Market Value to Realized Value (MVRV) ratios suggesting many are undervalued.

Over 85% of altcoins analyzed are currently positioned in what Santiment describes as the historical “opportunity zone.” This zone indicates that the assets are trading below their realized value, presenting potential buying opportunities for savvy investors.

Further reinforcing this sentiment, the Bitcoin dominance index (BTC.D), which tracks Bitcoin’s market cap relative to the entire crypto market, has slightly declined. BTC.D has dropped from 57.10% as of the middle of this month to roughly 54.69% as of today.

Bitcoin Crypto Market Dominance on TradingView

This decline could suggest that capital is beginning to flow more substantially into altcoins. Notably, the combination of favorable MVRV ratios and shifting dominance lends credence to Daan’s assertion that an alternative coins season may be on the horizon, ready to unleash notable gains similar to past cycles.

Featured image from Unsplash, Chart from TradingView

Expert Makes Bold Call: It’s Time To Swap Your Dollars For Bitcoin

Billionaire investor Anthony Scaramucci, the founder of SkyBridge Capital, recently discussed the viability of financial assets. He took to X, a social media platform previously known as Twitter and owned by Elon Musk, to highlight the decreasing purchasing power of the United States dollar in comparison to the potential of Bitcoin (BTC).

US Dollar Vs. Bitcoin Value Performance

In the post on X, the SkyBridge Capital founder pointed out that a dollar from 2020 is now only worth about 75 cents, underscoring a significant devaluation due to inflation.

According to Scaramucci, this scenario illustrates why investors should reconsider traditional fiat currencies as a reliable store of value, advocating instead for the inherent benefits of digital assets like Bitcoin.

Scaramucci’s critique comes at a time when the global economy grapples with heightened inflation rates, which have eroded the real value of fiat money.

He specifically cited a “25.14% compounded inflation rate” as a critical indicator of why the dollar is losing ground. In contrast, Bitcoin has not only maintained a strong profile but has also appreciated in value, further cementing its position as a viable hedge against inflation and a potential safe haven for investors.

So far, Bitcoin’s market performance has been quite appealing. Particularly, despite the significant downturn experienced in the past few years, the asset has managed to come out of the bloodbath and recently soared to an all-time high above $73,000 in March.

This peak performance labels Bitcoin as not just a digital asset but a major player in the global financial landscape.

However, despite Scaramucci’s bullish outlook, it’s worth noting that Bitcoin has seen its share of volatility. It has been struggling to maintain its appeal recently, with a modest 0.9% increase in the last 24 hours – a slight recovery from a 2% drop over the past week.

Bitcoin (BTC) price chart on TradingView

BTC Shifting Market Sentiments

Further insights into the market’s behavior towards Bitcoin reveal changing dynamics. Data from CryptoQuant highlighted a negative turn in the Bitcoin funding rate for the first time since October 2023, indicating a cooling interest in speculative trading on the asset.

This shift suggests that while the long-term outlook might still be strong, short-term investor sentiment has become cautious, possibly awaiting clearer signals before making further commitments.

The current market sentiment is also reflected in the technical analysis of a prominent crypto analyst, Ali. In Ali’s recent post on X, a notable mention was made of a “death cross” seen in Bitcoin’s 12-hour chart, where the short-term moving average dips below a long-term counterpart, traditionally a bearish signal.

Additionally, the Tom Demark (TD) Sequential indicator points to potential price reversals after a consistent trend, adding another layer of complexity to Bitcoin’s trading strategy.

Despite these potentially bearish indicators, on-chain data from Santiment shows an interesting trend: Bitcoin whales have increased their holdings significantly, now owning 25.16% of the total supply.

This accumulation suggests that while retail sentiment may be bearish, large-scale investors are seeing the dips as buying opportunities, potentially prepping for a future bullish run.

Featured image from Unsplash, Chart from TradingView

Cardano Crisis Or Comeback? ADA’s Key Metric Hits Low, What This Means For Investors

Data from analytics platform IntoTheBlock have illuminated a troubling trend within the Cardano (ADA) network, showing a significant dip in ‘profitability’ for its holders.

While cryptocurrencies like Bitcoin and TRX show a high percentage of holders in profit, Cardano stands in stark contrast, with only 35% of its holders currently seeing gains.

This insight into the Cardano ecosystem reveals deeper challenges, as many of ADA’s transactions now appear to be at a loss.

Details Into ADA Investors Profitability

The report’s specifics indicate that out of 1.59 million addresses holding 14.07 billion ADA, a substantial amount of these tokens were acquired at higher price points that are not profitable under current market conditions.

In particular, 2.73 million addresses are underwater, holding 20.07 billion ADA purchased at price levels between $0.5975 and $0.7265. This significant segment of loss-bearing investments places downward pressure on ADA’s market price, contributing to recent price volatility.

Cardano (ADA) holders metric.

Despite the immediate bearish outlook, ADA has shown resilience with a weekly gain of 4.2%, bringing its price to $0.4661 at the time of writing. This slight recovery suggests that while short-term pressures are evident, investor confidence remains in the token’s fundamentals.

Notably, the crypto community is buzzing about potential future gains for ADA based on historical data and technical analysis. Prominent crypto analyst Ali has pointed out that ADA’s Market Value to Realized Value (MVRV) ratio is lower than -22%, indicating that the asset is significantly undervalued.

This situation is similar to June 2023, following which ADA experienced a substantial 75% increase in value. Ali forecasts a potential surge in ADA’s price to $0.80 from these past trends, which would mark a significant recovery and the highest value for the token in over a year.

Cardano Technical Analysis Supports Bullish Predictions

Another analyst, Trend Rider on X, further supported the optimistic projections for ADA and noted that Cardano’s technical indicators signal a potential bull run.

According to Trend Rider, ADA’s Relative Strength Index (RSI) and Simple Moving Average (SMA) crossovers form a pattern that mirrors previous setups, leading to major price increases. For instance, a similar formation was observed before ADA’s monumental rise from $0.05 to $3.00.

This confluence of technical and market value analyses presents a compelling case for Cardano’s potential turnaround. While current holder profitability is low, the technical indicators and historical performance suggest that ADA could be on the cusp of a significant upward trajectory.

ADA price chart on TradingView

Featured image from Unsplash, Chart from TradingView

Is Bitcoin’s Rally Over? Leverage Drops As Halving Highs Fade: Report

Recent trends in the crypto market have indicated a notable shift in trader behavior, particularly among those investing in Bitcoin.

Using data from CryptoQuant, Bloomberg has revealed that the Bitcoin funding rate—the cost for traders to open long positions in Bitcoin’s perpetual futures—has turned negative for the first time since October 2023.

Bitcoin Funding Rates

This change suggests a “cooling interest” in leveraging bullish bets on Bitcoin, coinciding with the fading impact of major market drivers.

Bitcoin Market Dynamics Post-Halving

The decline in Bitcoin’s funding rate correlates with a reduction in net inflows to US spot Bitcoin Exchange-Traded Funds (ETFs), which previously pushed the cryptocurrency to record highs.

Despite the anticipation surrounding the Bitcoin Halving—an event reducing the reward for mining new blocks and theoretically lessening the supply of new coins—the price impact has been surprisingly muted.

According to Bloomberg, this subdued response has compounded the effects of broader economic factors, such as geopolitical tensions and changes in monetary policy expectations, leading to increased risk aversion among investors.

Following the latest Bitcoin halving, the market has not seen the bullish surge many expected. Instead, Bitcoin has only seen a correction of over 10%, from its all-time high (ATH) in March with prices stabilizing in the $63,000 region, at the time of writing.

Bitcoin (BTC) price chart on TradingView

As CryptoQuant’s Head of Research Julio Moreno pointed out, the recent downturn in Bitcoin’s funding rates to below zero underscores a “decreased eagerness” among traders to take long positions.

According to Bloomberg, this trend is supported by a significant drop in daily inflows to US spot Bitcoin ETFs and a reduction in open interest in Bitcoin futures at the Chicago Mercantile Exchange (CME), which indicates a broader cooling of enthusiasm for crypto investments.

In a Bloomberg report, K33 Research analyst Vetle Lunde noted that the “current streak of neutral-to-below-neutral funding rates is unusual,” suggesting that the market might be entering a price-consolidation phase.

Notably, this period of reduced leverage activity could potentially lead to further price stabilization, but it also raises questions about the near-term prospects for Bitcoin’s recovery.

Adjustments In Mining Difficulty And Market Implications

Interestingly, alongside these market adjustments, Bitcoin’s mining difficulty has increased for the first time immediately following the fourth halving.

The difficulty adjustment, which occurs every 2016 block, increased by 2%, reaching a new high of 88.1 trillion, according to Bitbo data.

Bitcoin Mining Difficulty History Chart.

This adjustment contradicts past trends where the difficulty typically decreased post-halving due to reduced profitability pushing less efficient miners out of the market.

This anomaly in mining difficulty suggests that despite lower rewards post-Halving, miners remain active, possibly buoyed by more efficient mining technologies or strategic shifts within mining operations.

This resilience in mining activity could help sustain the network’s security and processing power. Still, it reflects the complexities of predicting Bitcoin’s market dynamics solely based on historical halving outcomes.

Featured image from Unsplash, Chart from TradingView

Is A $72K Bitcoin Surge On The Horizon? Glassnode’s Latest Analysis Points To An Answer

Recent insights from Glassnode’s cofounders, shared under their X (formerly Twitter) account ‘Negentrophic’ have sparked interest in Bitcoin market dynamics, leading to a promising stabilization and possible price surge.

Market Sentiments And EMA Trends

With Bitcoin’s value recently wavering below the $70,000 mark, a detailed analysis from the cofounders suggests that a strong support level around the $62,000 50-day Exponential Moving Average (EMA) could set the stage for a significant rebound.

This crucial support level indicates a strong buying sentiment, indicating the market’s confidence in the cryptocurrency’s value and a potential resistance against further declines.

Using the strategic placement of the 50-day EMA as a support point, the analysis suggests that investors might see the current price levels as a solid base, preventing significant downward movements.

This perspective is reinforced by recent price movements, where despite a pre-halving general dip, Bitcoin has experienced a 7.1% increase in value over the past week, and the same uptick continued in the last 24 hours.

Bitcoin (BTC) price chart on TradingView

Further analysis by the Glassnode cofounders delves into the behavior of EMAs over different durations. Short-term EMAs indicate a growing inclination among investors to buy, while longer-term EMAs lean towards selling.

This contrasting behavior between short and long-term EMAs sheds light on the current phase of the market, which seems to be in a period of consolidation after the notable 92% increase in Bitcoin’s price over six weeks earlier in the year.

Such insights are vital as they offer a deeper understanding of the underlying market forces and investor behavior during volatile periods.

Meanwhile, Glassnode’s team’s analytical approach extends beyond simple price movements. Yesterday, they compared the current market conditions to the early 2021 “strong correction,” which they term “wave 4” of the ongoing market cycle.

This historical perspective provides a lens through which current trends can be evaluated, suggesting a cyclic return to bullish conditions reminiscent of past market behaviors.

Bitcoin Bullish Projections And Market Dynamics

Bitfinex analysts have highlighted significant activities around Bitcoin withdrawals, supporting the optimistic outlook on Bitcoin. The current levels, echo those of January 2023, suggest that investors are increasingly moving their Bitcoin to cold storage—a sign that many anticipate further price increases.

Veering back to Glassnode’s projections yesterday based on their indexes and Fibonacci levels, the cofounders were boldly optimistic, anticipating a potential 350% increase from current market levels.

Notably, this forecast highlights the expected financial trajectory and underscores a growing confidence among experts and market analysts in Bitcoin’s market performance and its foundational economic principles.

Featured image from Unsplash, Chart from TradingView

Samson Mow On Bitcoin Halving: Brace For Supply Shock, Omega Candle In Sight

Samson Mow, the chief executive at Jan3, recently spoke to Forbes about the latest Bitcoin halving and its potential to catalyze what he refers to as the “Omega candles” – significant price movements that could elevate Bitcoin to the $1 million mark.

According to Mow, halvings ensure a controlled distribution of Bitcoin, maintaining scarcity and value.

The Mechanics Of Halving And Its Market Implications

Samson Mow detailed in the interview with Forbes the mechanics behind Bitcoin halvings—a critical process built into Bitcoin’s framework by its creator, Satoshi Nakamoto.

This mechanism is designed to halve the block rewards given to miners every 210,000 blocks, or approximately every four years, reducing the reward by 50%.

So far, the most recent halving has reduced the reward for mining from 6.25 BTC to 3.125 BTC per mined block. However, initially, miners received 50 BTC per block.

Still, due to the halvings, this amount has decreased over time to manage inflation and extend the mining lifecycle of Bitcoin’s capped supply of 21 million coins. If not for these halvings, the total supply of Bitcoin would have already been mined.

In the same discussion, Mow highlighted the significant impact of newly approved spot-based Bitcoin ETFs, which received SEC approval earlier this year. He believes these ETFs, combined with the reduced block rewards from the halving, could precipitate a “supply shock” in the BTC market.

Mow further speculated on the occurrence of what he calls “Omega candles”—large price movement events in the Bitcoin market.

He noted that even before the recent halving, the daily demand for Bitcoin was significantly outstripping supply, predicting these Omega candles as almost certain events due to their high volatility and substantial price changes.

Mow views these developments as marking the beginning of a new era for Bitcoin, coinciding with its next, or fifth, halving in the coming four years.

Bitcoin Bright Future And Market Performance

Regarding positive sentiment on Bitcoin, Geoff Kendrick of Standard Chartered also supports this bullish outlook, projecting substantial inflows into BTC akin to those experienced by gold with the advent of gold ETFs.

Kendrick suggests that the maturation of the spot ETF market could channel between $50 and $100 billion into BTC.

However, despite the post-halving price not reaching the anticipated heights, BTC has demonstrated resilience and potential for considerable growth. Meanwhile, analysts remain confident, predicting significant long-term value increases.

For instance, Michael Sullivan’s analysis suggests a possible reach of $245,000 by 2029 if BTC maintains a 30% compound annual growth rate, underlining the optimistic projections shared by several market experts.

This optimism is further supported by recent trends, including a 7.1% increase in Bitcoin’s price over the last week, which indicates a possible recovery on the horizon.

Bitcoin (BTC) price chart on TradingView

Featured image from Unsplash, Chart from TradingView

‘More Upside Is Coming’: Crypto Market Set For 350% Growth, Predicts Glassnode Cofounders

Negentropic, the official X (formerly Twitter) account of Glassnode’s cofounders, has offered its own bullish sentiment for the crypto market.

Glassnode Cofounders: There Would Be A Massive Growth Beyond Recent Corrections

According to their analysis, the market, excluding the top 10 cryptocurrencies, known as “OTHERS,” is showing signs of a strong uptrend with the potential for “more upside” growth.

This observation amidst increased volatility and uncertainty following the recent Bitcoin Halving event on April 20 reduced miners’ block subsidy rewards from 6.25 BTC to 3.125 BTC.

The cofounders pointed out an intriguing pattern in the market’s behavior, comparing the current conditions to the “strong correction” seen in early 2021, which they identified as “wave 4” in the market cycle.

Using their index and Fibonacci levels, Glassnode’s cofounders anticipate approximately a 350% increase from the current market levels, noting:

More upside is coming. This index and our Fibonacci levels gives us, that we may see ~350% upside from current levels.

Notably, this bullish projection underscores their confidence in the potential for further market expansion despite recent downturns.

Crypto Market Recovery Amid Bitcoin Criticism And Post-Halving Predictions

While the Glassnode Co-founders have predicted significant growth for the crypto market, it’s important to note that the overall market sentiment remains bullish. After a notable decline last week, the global crypto market is showing signs of recovery, with nearly a 3% increase in the past 24 hours.

This upward movement can be attributed to major cryptocurrencies like Bitcoin and Ethereum, which have seen gains of 2.7% and 1.7% over the same period.

BTC price chart on TradingView amid crypto news

Bitcoin, the flagship cryptocurrency, has recently faced criticism from prominent figures like Peter Schiff, who criticized its high transaction fees and longer processing times.

Due to these challenges, Schiff labeled Bitcoin as a “failure” in terms of digital currency. However, it’s worth noting that Bitcoin’s average transaction fee has significantly decreased to $34.86 on April 21, following a record high of $128.45 the day before.

Bitcoin Average Transaction Fee

Meanwhile, analyst and founder of the Capriole Investment fund Charles Edwards has shared three possible scenarios for Bitcoin after the Halving.

Edwards highlighted the increase in Bitcoin’s electrical cost to $77,400 per new BTC coin produced, while the overall miner price, including block rewards and fees, surged to $244,000.

He predicts that Bitcoin’s price may skyrocket, approximately 15% of miners may shut down their operations, or transaction fees will remain elevated. Edwards expects a combination of these scenarios to unfold, ultimately leading to Bitcoin’s price surpassing $100,000.

Featured image from Unsplash, Chart from TradingView

Crypto Guru Reveals Top Altcoin Picks And DeFi Risks: What You Need To Know

Renowned crypto analyst Lark Davis recently shared insights into the world of altcoin and decentralized finance (DeFi), offering high-risk, high-reward options and established projects.

During a live stream, Davis discussed his current portfolio holdings, while emphasizing the volatility inherent in these markets.

High-Risk Ventures Altcoin And Established DeFi Projects

During his discussion, Davis advised against investing in Bitcoin SV (BSV), expressing doubts about Craig Wright’s claim to be Satoshi Nakamoto. He emphasized the importance of doing thorough research before investing in cryptocurrencies.

Additionally, he mentioned Bitcoin Cash (BCH) as a potential candidate for the next ETF approval in the US due to its slight variations from Bitcoin.

Regarding altcoins and DeFi, Davis highlighted different projects in his portfolio, including “Puff, Benji, and Foxy,” which he categorized as “high-risk, high-reward ventures.” Davis also mentioned DeFi projects like “Jup and Arrow,” which are known for their governance features and staking rewards.

Furthermore, Davis discussed projects with considerable potential for growth, such as Solana, Trader Joe, and Mantle. However, he emphasized these investments’ volatile nature and recommended that viewers approach them cautiously.

In addition to Davis’s insights, Solana has recently become the fourth-largest cryptocurrency by market capitalization, surpassing XRP and Dogecoin. With a market cap of $68.7 billion and a price of $154.66 at the time of writing, Solana’s rise reflects growing interest in the project.

SOL price chart on TradingView amid Altcoin news

Analysts’ Perspectives On Altcoins

Meanwhile, analysts offer contrasting views on the future of altcoins. Altcoin Sherpa suggests that these alternative tokens may stagnate for 1-4 months, needing time to consolidate after a significant run.

However, Crypto Jelle presents an opposite outlook, suggesting that altcoins could rally massively in the coming months.

Crypto Jelle points to historical patterns, noting that altcoins typically consolidate after breaking out from a resistance zone before entering a new bull run. If history repeats itself, altcoins could demonstrate significant growth potential shortly.


Featured image from Unspalsh, Chart from TradingView