Bitcoin Price Surges Towards $61,000, Eyeing Potential Breakout To $67-$68k Range

Bitcoin (BTC), the largest cryptocurrency in the market, has experienced a notable resurgence in its bullish momentum, with the Bitcoin price reclaiming the crucial $61,000 threshold. 

This recovery follows a week-long downtrend that led to a 20% drop to $56,000 on Wednesday. As the bullish momentum returns, the possibility of further testing upper resistance levels and reclaiming previously lost price levels grows stronger.

Bitcoin Bulls Eye $68,000

According to market expert Justin Bennett, a recovery of the $61,000 resistance level would open up potential areas such as $67,000 to $68,000. However, at the present moment, this level continues to pose a significant resistance.

Analyzing the recent correction in the Bitcoin price, analyst Crypto Con suggests that the market correction was necessary for the long-term price trajectory. 

The full retest of the 20-week Exponential Moving Average (EMA) support at $56,700 and the return to indicator support zones, such as the Directional Movement Index, indicate a healthy price consolidation.

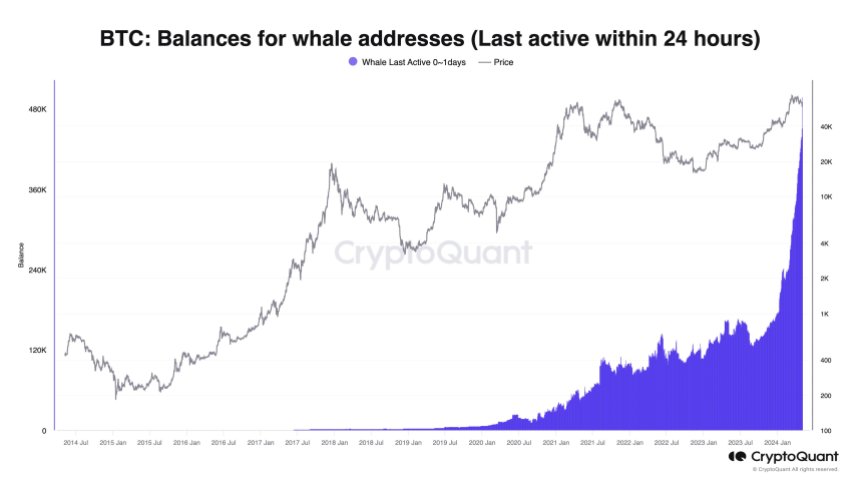
In addition to the technical indicators, on-chain and market data analytics firm CryptoQuant’s founder and CEO, Ki Young Ju, highlights the current bullish sentiment. 
Bitcoin price

According to their data, whales accumulated a significant amount of Bitcoin, totaling 47,000 BTC, within the past 24 hours. This increased accumulation by large investors further bolsters the positive outlook for Bitcoin’s price.

Bitcoin Price Poised For Bullish Surge

Crypto analyst Titan of Crypto has provided further bullish predictions for the Bitcoin price, suggesting that recent corrections have resulted in the grabbing of leverage longs liquidity. In addition, the Stochastic Relative Strength Index (RSI)on the 5-day chart is on the verge of crossing into bullish territory. 

This occurrence has historically been followed by an upward price movement in Bitcoin, leading to higher highs. Such a pattern has the potential to fuel renewed investor confidence and attract further buying pressure.

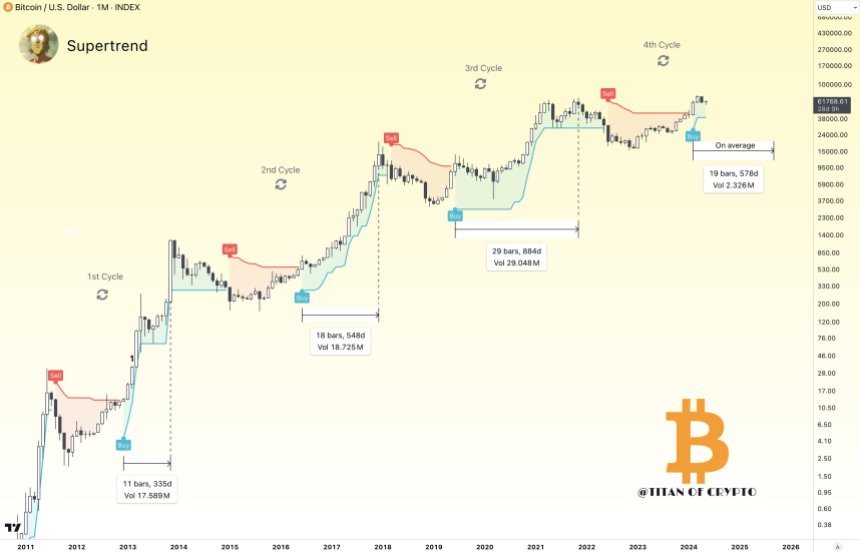
Another positive signal highlighted by Titan of Crypto is the recent buy signal generated by the Supertrend indicator, as seen in the chart below. This technical tool helps identify trends in an asset’s price movement. 
Bitcoin Price

The buy signal, which occurred just three months ago, implies that Bitcoin may still have significant room for growth before reaching its cycle top. According to the analyst, historical data suggests that the average duration from the buy signal to the cycle top is approximately 19 months, indicating the potential for a sustained upward trend.

Bitcoin price

Currently trading at $61,600, Bitcoin has seen a significant increase of 4.7% in the last 24 hours alone. It remains to be seen if BTC will successfully break above resistance levels, while also challenging the ability of previously retested support levels to withstand potential future downtrends.

Featured image from Shutterstock, chart from TradingView.com

Record $1 Billion In Shorts Risk Liquidation If Bitcoin Hits This Price

The Bitcoin price is creeping up once again, rising to a new all-time high above $71,000 in the early hours of Monday. As the price surge continues, it has put a record number of shorts at risk, where a less than 10% move upward from here will see $1 billion in shorts liquidated.

$1 Billion In Shorts At Risk Of Liquidation

Crypto trader and analyst Ash Crypto took to X (formerly Twitter) to share a map that showed the number of short positions at risk as the price of Bitcoin rises. The map shared in the post showed that short liquidation leverage had risen above $1 billion.

These short leverage positions had been rising along with the price with a large number of crypto investors expecting the price to crash after pumping to a new all-time high. However, Bitcoin seems to have other plans in mind with its price surging close to $72,000 and increasing the risk of liquidations for these positions.

For these positions, Bitcoin reaching $75,000 would be detrimental to them. At this price level, over $1 billion worth of short positions will be liquidated. “$1,000,000,000 WORTH OF SHORTS WILL GET LIQUIDATED IF BTC HITS $75,000,” Ash Crypto revealed.

Will Bitcoin Stop Anytime Soon?

The Bitcoin price has seen a 10.33% increase in the last week and shows no signs of stopping soon. However, the debate of whether it continues upward or downward continues to wax strong as crypto analysts far and wide proffer their own predictions.

One crypto analyst know as MarcPMarkets suggests that the price of Bitcoin could hit resistance and then spiral back down if Bitcoin fails to properly clear the $70,000. But the analyst also explains that there is a possibility that the positive price action does continue if price does push above $71,500 and makes a close above it.

At the time of writing, Bitcoin is trading above $71,700, which shows it has cleared the level highlighted in the analyst. Now, what remains is to see if the cryptocurrency is able to make a daily close above $71,500, something that would be incredibly bullish for price. In this case, the BTC price could rise as high as $80,000 following this breakout.

The Bitcoin move over $71,000 has already had a significant impact on traders in the last day. Over $333 million has been lost by traders in one day. But interestingly, the majority of liquidations (64.29%) happen to be long positions, according to data from Coinglass.

Bitcoin price chart from Tradingview.com

Bitcoin Surges To New 26-Month High, ‘Whales Go Parabolic’ As Analyst Forecasts Rally Toward $60,500

Bitcoin (BTC), the leading cryptocurrency, has experienced a surge of over 3.6% in the past 24 hours and an impressive 27% in the last month. These gains have propelled the Bitcoin price to reach a new 26-month high of $53,360 on Monday, signaling investors renewed optimism.

BTC Whales Make Waves

Adding to the bullish sentiment surrounding Bitcoin, crypto analyst Ali Martinez highlights the significant activity of the BTC whales, stating that “whales are going parabolic.” 

Notably, In the past month alone, more than 150 new BTC addresses have appeared, each with more than 1,000 BTC. This surge in whale activity indicates a heightened confidence in Bitcoin’s long-term prospects and offers a positive outlook for its future price movements.

Bitcoin

Martinez emphasizes a “megaphone pattern” observed on Bitcoin’s daily chart. According to the analyst, this pattern suggests that if BTC maintains its position above the $50,000 level, a sustained close above $53,000 could catalyze a substantial rally toward the $60,520 mark. 

Bitcoin Rally Led By Leveraged Long Positions? 

As detailed in a recent Bloomberg report, BTC’s rise has been driven in part by a surge in spot demand and momentum traders capitalizing on a breakout after a period of consolidation, according to Chris Newhouse, a decentralized finance (DeFi) analyst at Cumberland Labs.

Newhouse highlights that the current price action has seen a relatively balanced level of liquidations, indicating that excessive short liquidations do not drive the recent rally. Instead, leveraged long positions have quickly replaced the liquidated shorts, suggesting a shift in sentiment toward bullishness.

Moreover, the report highlights that open interest for perpetual Bitcoin futures has experienced a noticeable increase, indicating growing market participation and interest in BTC derivatives. 

Simultaneously, Newhouse explains that short positions have been forced to close amid the latest rally, potentially a result of fresh long positions entering the market.

Nevertheless, the cryptocurrency’s ability to sustain its upward momentum and navigate key resistance levels will be crucial in determining its next growth phase.

In a further boost to Bitcoin’s optimism, MicroStrategy, the enterprise software firm known for its strategic Bitcoin purchases, announced that it has acquired an additional 3,000 cryptocurrency tokens this month for approximately $155.4 million. 

With a total Bitcoin holding of about $10 billion, MicroStrategy continues to demonstrate its confidence in its long-term value and potential.

Bitcoin

Featured image from Shutterstock, chart from TradingView.com
Can Bitcoin Overcome Past Trends? Examining The Pre-Halving Rally And Resistance Levels

Bitcoin (BTC), the largest cryptocurrency in the market by trading volume and capitalization, has embarked on a renewed bullish uptrend, reclaiming previously lost territories and surpassing resistance levels, igniting optimism among investors. 

Currently trading just below its 25-month high of $49,000 at $47,900, Bitcoin has experienced a remarkable price increase of over 6% within 24 hours and a significant 11% surge over the past seven days. 

Mapping BTC’s Path Amidst Pre-Halving Rally

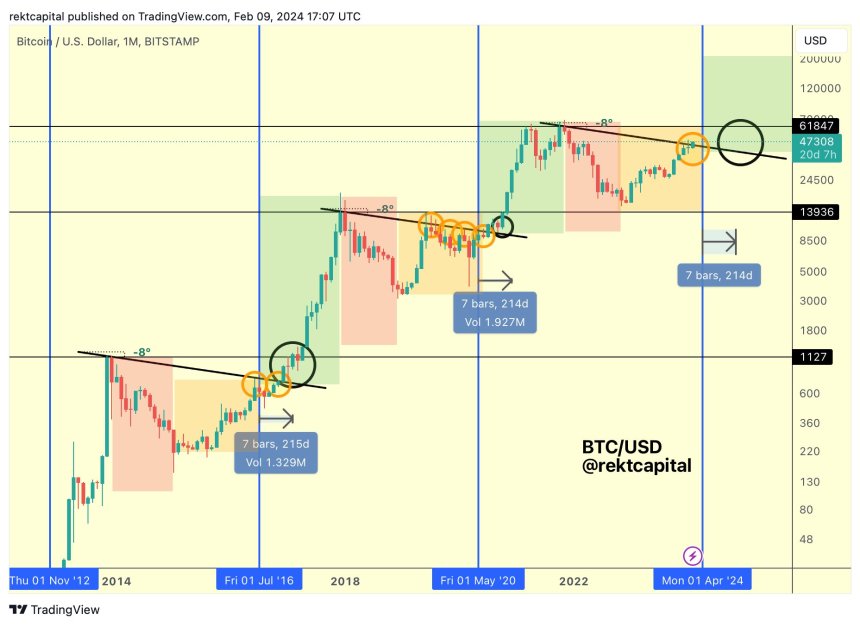
However, amidst the market’s excitement, it is crucial to consider historical tendencies and their potential impact on Bitcoin’s trajectory leading up to the upcoming halving event. Market expert and analyst Rekt Capital highlights two noteworthy historical patterns:

Firstly, the “Pre-Halving Rally” phase appears to be commencing. This phase refers to a period where Bitcoin experiences a surge in price before the halving event takes place. 

Secondly, historical data reveals that Bitcoin has struggled to break beyond the macro diagonal resistance before the halving, which Rekt places at $47,000. Additionally, it has encountered difficulty surpassing its Four Year Cycle resistance, which is approximately $46,000 in the current cycle.

It is worth noting that even though the price has surpassed these resistance levels, a consolidation or continuation of the uptrend must be seen, as a retracement could take place and leave the BTC price stuck between these resistances.

Bitcoin

Given these historical trends, exploring how Bitcoin could potentially reconcile these patterns is interesting. Rekt Capital offers insights into one possible path that Bitcoin could take:

During the pre-halving rally phase, Bitcoin may produce limited upside, resulting in an upside wick at the end of February. This pattern has been observed in previous months and 2019. 

Following this, Bitcoin might establish another range at higher price levels in March, potentially allowing altcoin rallies to take center stage. Finally, a few weeks before the halving event, Bitcoin could experience a pullback, creating a pre-halving retrace.

This proposed path suggests that Bitcoin could surpass the Macro Diagonal resistance with an upside wick but remain below it in terms of end-of-month monthly candle closes during this gradually concluding pre-halving period.

Bitcoin Bull Run Indicator Flashing Buy Signal

Crypto analyst Ali Martinez has added to the growing bullish sentiment surrounding Bitcoin by highlighting a key indicator that suggests potential upside movement. 

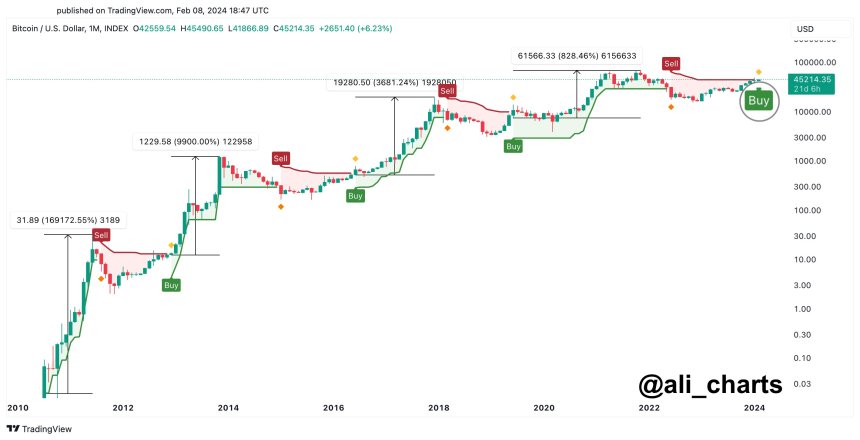
According to Martinez, the Super Trend indicator flashed a buy signal on the BTC monthly chart. This tool is renowned for its precision in predicting bullish trends in Bitcoin markets.

The indicator’s track record underscores the significance of this buy signal. Martinez points out that the Super Trend has issued four buy signals since Bitcoin’s inception, and all four have been validated, leading to substantial gains. These gains amount to an impressive 169,172%, 9,900%, 3,680%, and 828%, respectively.

Bitcoin

However, amidst the bullish outlook, Martinez also highlights a potential strategy that may soon impact Bitcoin’s price.

According to the Bitcoin liquidation heatmap, a scenario is unfolding where liquidity hunters could drive the price of Bitcoin down to $45,810. The intention behind this move would be to trigger liquidations amounting to a substantial $54.73 million.

It is important to understand that liquidity hunters aim to exploit price movements to trigger forced liquidations among overleveraged traders. By strategically driving the price down, they can force these traders to sell their positions, resulting in cascading liquidations that potentially amplify price downward movements.

Bitcoin

Featured image from Shutterstock, chart from TradingView.com 
Bitcoin Price Soars, Smashing Through $45,000 On The Back Of Two Key Factors

In the past 14 days, the Bitcoin price has displayed a significant uptrend of 14.5%, signaling a resurgence in bullish sentiment. This rally comes as Bitcoin spot exchange-traded funds (ETFs) have been trading for nearly a month, with the market already factoring in this development. As a result, Bitcoin is back on its natural course, gaining momentum ahead of the scheduled halving in April.

Currently, Bitcoin has not only regained its bullish momentum after a brief dip to the $38,500 level but has also surpassed the $45,300 mark. It now edges closer to its 25-month high of $49,000, with the $50,000 milestone within reach. 

Achieving this level would significantly narrow the gap between the current price and Bitcoin’s all-time high (ATH) of $69,000. However, what are the main catalysts behind this uptrend, and how far can the Bitcoin price climb?

Reduction Of GBTC Flows And Net Positive BTC Spot ETF Inflows

According to the latest analysis by QCP Capital, two key factors are driving Bitcoin’s upward trajectory: 

Daily outflows from the Grayscale Bitcoin Trust (GBTC) have decreased from $500-600 million to $100-200 million. Simultaneously, total inflows across all Bitcoin ETFs are now positive. This shift in the GBTC flows, and the emergence of net positive BTC spot ETF inflows contribute to the current bullish trend, according to the crypto trading firm’s analysis

Additionally, notable price movements have been observed around “spot ETF fixings.” Between 3-4 pm EST, QCP has recorded that the Bitcoin price tends to tick higher, possibly due to the one-hour observation window used by the BlackRock ETF (IBIT) to calculate its Net Asset Value (NAV). 

Conversely, downward pressure is typically observed after 4 pm EST as GBTC employs a point fix, leading market makers to sell around and after the fix.

Strong Performance In US Equities

Despite the Federal Reserve’s hawkish stance and higher US yields driven by robust February Non-Farm Payroll data (353k actual vs. 180k expected), US equities continue outperforming. 

Companies like NVDA and META have rallied due to strong earnings and positive headlines. Underallocated investors will likely continue buying any equities dips as they chase returns. 

According to the analysis, this bullish sentiment is expected to “spill” over into BTC and Ethereum (ETH), further fueled by the upcoming BTC halving and the ETH spot ETF narratives.

Ultimately, the trading firm assesses significant interest in accumulators, which enable investors to purchase Bitcoin or ETH at a “substantial discount” to the current spot price. This strategy is believed to present an attractive opportunity for bullish investors looking to build long positions throughout the year.

Bitcoin Price Faces Strong Barriers On Its Way To $50,000

Despite the uptrend, notable resistance levels could impede further upward movement and potentially lead to a consolidation phase for Bitcoin. 

To assess the nearest-term resistances accurately, the 1-hour chart indicates potential price paths for Bitcoin in the coming days if these bearish thresholds are breached.

In the immediate time frame, the $45,500 level emerges as Bitcoin’s next resistance level. This level previously marked a correction in the Bitcoin price shortly after the introduction of ETF trading.

Bitcoin price

Subsequently, the next target would be the $46,600 level if the immediate resistance at $45,500 is surpassed. However, while these two thresholds may present challenges, no significant resistance levels are evident on Bitcoin’s hourly chart until the $48,500 level. 

This particular level represents the final hurdle for Bitcoin before reclaiming its previous high reached on January 11, immediately following the approval of ETFs by the US Securities and Exchange Commission (SEC).

Considering the combined factors of Grayscale’s reduced sell-off and the overall performance of the equity market, alongside renewed investor sentiment, Bitcoin could potentially surge to previous highs and even surpass them, marking new highs since the end of the crypto winter. 

The key factor to be seen is how Bitcoin’s price will respond when encountering these highlighted resistance walls and whether the buying pressure will be sufficient to propel Bitcoin back on track toward the bullish momentum observed at the beginning of 2024.

Featured image from Shutterstock, chart from TradingView.com
Bitcoin Crash Ahead: Expert Predicts Testing $20K Before Rebound

Bitcoin, the largest cryptocurrency in the market, experienced a price recovery on Friday; however, industry experts anticipate a further test of sub-$30,000 levels in the near term. 

The prolonged downtrend observed over the past fourteen days, coupled with mounting selling pressure, has raised concerns about the sustainability of the recent rebound.

BTC’s Local Bottom Predicted

Chris Burniske, co-founder of a New York-based venture crypto firm, highlights several factors contributing to the anticipated downward movement of Bitcoin. 

Burniske suggests that the consolidation phase may extend longer than expected due to many variables, including crypto-market dynamics, macroeconomic conditions, adoption trends, and new product developments. 

Burniske offers his outlook on Bitcoin, stating that a local bottom could be reached in the $30,000 to $36,000 range. However, he wouldn’t be surprised if the cryptocurrency tests the mid-to-high $20,000 before recovery occurs, leading to a renewed push toward previous all-time highs. 

Burniske cautions that the path to such a recovery will likely be volatile, marked by potential fakeouts, and may span several months.

The market expert advises investors to exercise patience during this period of uncertainty. Burniske suggests that other cryptocurrencies may experience more significant percentage declines if his predictions hold Bitcoin. Burniske further stated:

Before you get mad with, “We’re just getting this cycle started, Chris!!!” Mostly agree, ~called the cycle bottom in Nov 2022 and continue to believe the long-term trend remains robust. Have also seen a lot of crypto volatility over the last decade+…. recently, I’ve specifically been discussing a local top and local low, not a cycle-wide top and low. 

Buy Signal For Bitcoin

Crypto analyst Ali Martinez has provided insights into potential price movements for Bitcoin in its latest analysis conducted on the social media platform X (formerly Twitter). 

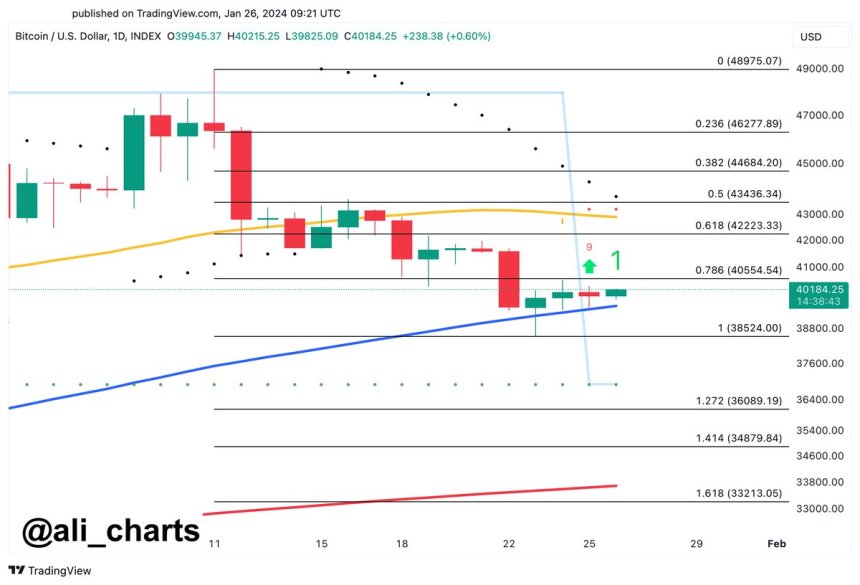
Martinez’s assessment indicates that the TD Sequential indicator recently flashed a buy signal on the daily chart, coinciding with Bitcoin’s current position above the 100-day Simple Moving Average (SMA) at approximately the $40,000 level. 

Bitcoin

According to Martinez, if Bitcoin surpasses the $40,550 resistance level, it may trigger an upswing with a target price of $43,000. This bullish scenario implies a potential price rally for Bitcoin soon. 

However, the analyst also highlights the importance of closely monitoring the 100SMA support level, as a breach of this level could have significant implications for the cryptocurrency’s price trajectory.

Martinez cautions that if the 100SMA support level is breached, it might result in Bitcoin experiencing a downward move toward the $33,300 level. This potential downside scenario indicates a critical support level that, if broken, could lead to increased selling pressure and a bearish sentiment in the market.

Bitcoin

At the time of writing, BTC’s price has recovered 3.8% over the past 24 hours, resulting in a current trading price of $41,400.

Featured image from Shutterstock, chart from TradingView.com
Bitcoin Price At Risk? Grayscale’s $335M Coinbase Transfer Stirs $30,000 Plunge Potential

The Bitcoin price has experienced a notable shift as selling pressure mounts, with BTC bears gaining the upper hand. Asset manager Grayscale, the owner and manager of the Grayscale Bitcoin Trust (GBTC), is a significant contributor to this trend. 

Since the trading of spot Bitcoin exchange-traded funds (ETFs) began on January 12, Grayscale has been on a selling spree, as evidenced by substantial transfers of BTC to the United States-based crypto exchange Coinbase.

Bitcoin Price Under Pressure As Grayscale Selling Spree Continues

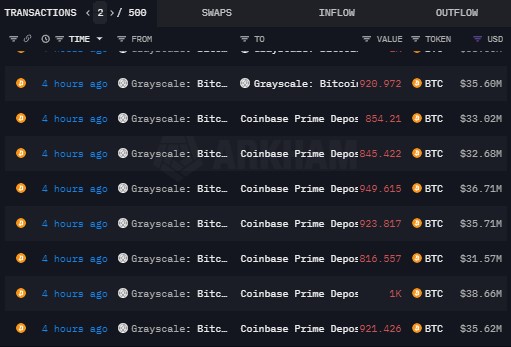
According to Akrham Intelligence data, in addition to the previously reported 69,994 BTC ($2.9 billion) transfers, Grayscale sent an additional 8,593,075 BTC (approximately $335.19 million) to the exchange on Tuesday, suggesting the possibility of further selling activities.

Bitcoin price

These developments have affected the Bitcoin price, which has experienced a significant downtrend, declining by 20% over the past week and a half. 

On Tuesday, the largest cryptocurrency dropped as low as $38,500, placing considerable pressure on a crucial support level. Despite the bearish pressure, the $38,500 support level has demonstrated resilience so far, with the cryptocurrency rebounding to $39,300 at the time of writing. 

Nevertheless, the duration of Grayscale’s selling spree remains uncertain, and if market sentiment continues to turn negative, Bitcoin could potentially revisit the $30,000 mark. This figure is just above the key $29,000 level that marked the beginning of the bull run that took Bitcoin to its 22-month high of $49,000 on January 11th.

Bears On The Rise

If the $38,500 threshold succumbs to Grayscale’s selling pressure and profit-taking, market observers should closely monitor the $37,750 level as the next resistance. 

Failure to hold above this level would open the door to a potential decline toward the major resistance at $35,600, which could further prevent a dip to the next support level at $33,000.

However, if these support levels are breached and the Bitcoin price continues its downtrend, the next significant key levels to watch for bullish momentum would be $29,000 to $30,000. A breakdown below these levels could signal an end to the current bull market structure and grant the bears the upper hand in the mid-term, at least until the anticipated halving event in April. 

Historically, halving events have acted as major catalysts for the Bitcoin price, and their influence has been demonstrated.

As the Bitcoin market faces intensified selling pressure and Grayscale’s ongoing selling spree, market participants remain cautious about the potential for a significant price plunge. The coming days and weeks will be critical in determining whether Bitcoin can regain its bullish momentum or if it will succumb to further downward pressure.

Bitcoin price

Featured image from Shutterstock, chart from TradingView.com
Expert Analysis: Six Factors Suggest Bitcoin Price Won’t Drop Below $37,800

In the past month, the Bitcoin price has experienced a significant decline after reaching a 22-month high of $49,000. Currently, the largest cryptocurrency has fallen below the crucial $40,000 mark, raising concerns about the prospects of the ongoing bull run and the overall bullish market structure. 

However, there are indications that the bottom of the current downtrend may be near, potentially setting the stage for a potential price reversal.

Bitcoin Price To Avoid Plummeting To Low $30,000s

Market analyst Marco Johanning sheds light on the situation, offering insights into the Bitcoin price movement. Johanning suggests that it won’t be long until Bitcoin reclaims the $41,500 level or potentially rises from a lower level if a specific scenario unfolds. 

According to Johanning, Bitcoin will finally encounter significant liquidity on the downside. Notably, the price has touched around below $39,000 multiple times, indicating the presence of substantial liquidity at these lows. 

Moreover, Johanning addresses the skepticism surrounding the price of around $37,800, arguing against widespread expectations of a drop into the low $30,000 range. 

Johanning emphasizes that the primary liquidity lies below $40,000 and is not in the low $30,000 range. Traders profited from the low $30,000 range have likely adjusted their stop orders to protect their gains, creating a layer of support below the recent equal lows. 

As the price starts hitting these stop orders, automatic selling occurs, further down the price until it encounters significant buy pressure. The analyst points out a daily order block at $37,700 and high timeframe (HTF) support at $38,5000, indicating the potential for notable buy pressure in these price regions. 

Johanning also highlights the likelihood of filling Chicago Mercantile Exchange (CME) gaps and Imbalances, with the next imbalance anticipated below $33,000.

Short Squeeze Rally Imminent? 

According to Johanning, the prevailing sentiment reveals many bears waiting to short a market dump. Johanning predicts that a short squeeze could occur once the price reverses, leading to a rapid price increase.

In terms of Fibonacci retracement levels, Johanning suggests that since the Bitcoin price has already lost the $40,200 level, it could potentially fall to the 0.5% Fibonacci level, which coincides with those above the $37,800 level. 

Johanning speculates that the price may briefly touch $37,800 before closing above the HTF support level of $38,500, setting the stage for a potential upward movement.

The recent downtrend in Bitcoin’s price has raised concerns about continuing the bull run. However, market analyst Marco Johanning presents several key arguments supporting the possibility of a price reversal. 

Bitcoin price

With Bitcoin’s current price at $38,900, there is a possibility of increased buying pressure in this region. The support wall at $38,5000 has demonstrated resilience thus far, and its performance will be closely observed. 

If the support wall fails to hold, the market will observe how the $37,800 price level performs and whether it aligns with the analyst’s thesis.

Featured image from Shutterstock, chart from TradingView.com
Bitcoin Long Positions Surge On Bitfinex: Whales Add 4,230 BTC, Signaling Potential Price Reversal

In a surprising turn of events, the approval of spot Bitcoin (BTC) exchange-traded funds (ETFs) has not yielded the anticipated immediate upside impact on the Bitcoin price. 

Contrary to expectations within the crypto community, BTC has experienced a sharp drop of over 16% since the ETF approval on Wednesday, January 11, dipping below the key $40,000 level. The failure of BTC bulls to hold the support level has led to a testing phase at the $38,000 level, accompanied by a 4.5% price drop within the past 24 hours.

Bitfinex Whales Buck The Trend

Amidst the market volatility, according to Datamish, Bitfinex whales have accumulated Bitcoin long positions since November 2023. This accumulation of approximately 4,230 BTC since January 17 marks the first sustained increase in Bitfinex BTC long positions following a sharp decline in November last year. 

Bitcoin

However, the recent downturn in the BTC price can be partly attributed to increased selling pressure from miners and asset manager Grayscale. Grayscale has notably increased its BTC sell-off since the ETF trading commenced. 

Transferring a significant amount of BTC from the Grayscale Trust address to Coinbase, totaling 69,994 BTC ($2.9 billion), has influenced the market dynamics. 

Additionally, reports indicate substantial sell-offs of Grayscale’s Bitcoin Trust GBTC shares, including a notable sale of 22 million GBTC shares by the FTX estate, worth nearly $1 billion. 

Bitcoin Liquidation Zones Wiped Off

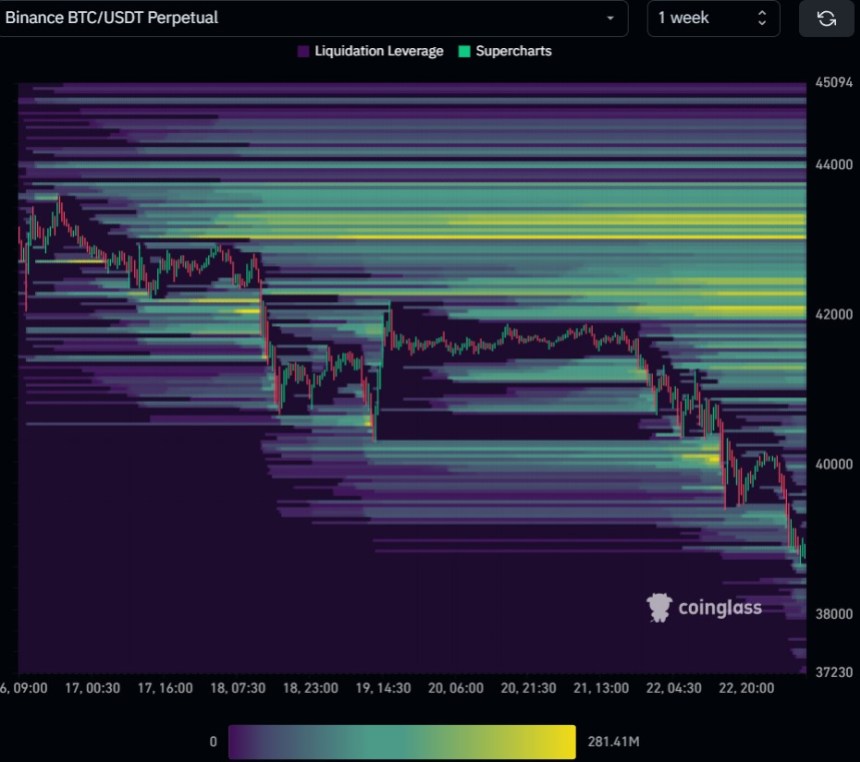
The impact of Grayscale’s sell-off is evident in CoinGlass’ liquidation heatmap, which shows notable liquidation zones being wiped off in the 1-week chart. 

While Grayscale’s BTC dump has contributed to the price drop, the increased accumulation of BTC long positions on Bitfinex indicates a potential change in sentiment. A price reversal could occur if the $38,000 support line holds, pushing BTC back above $40,000.

Bitcoin

Furthermore, excluding Grayscale, institutional investors and asset managers involved in the ETF market have collectively acquired over 86,320 BTC at an average price of $42,000, representing a substantial $3.63 billion investment. 

Market experts such as Ali Martinez suggest that these institutions are likely to adopt a strategic, long-term view rather than engage in peak purchases. This level of institutional investment underscores the growing recognition of Bitcoin as a legitimate asset class and signifies confidence in its long-term growth potential.

Bitcoin

Currently, the Bitcoin price is at $38,800, reflecting a substantial year-to-date decline of over 12% and a 9.7% drop in the past seven days. The duration and extent of the selling pressure caused by Grayscale’s BTC dump remain uncertain, leaving the question of how much further the BTC price may decline.

Featured image from Shutterstock, chart from TradingView.com 

Bitcoin Expected To Mirror Historical Trends: Glassnode Sets $120K Price Prediction For 2024

Bitcoin (BTC), the largest cryptocurrency in the market, has encountered a significant downturn following the waning hype around exchange-traded funds (ETFs), resulting in a 9% decline over the past fourteen days. 

However, Glassnode co-founders remain optimistic, asserting that the recent price corrections align with historical patterns and could propel Bitcoin to new heights, nearly doubling its current all-time high (ATH) of $69,000.

Healthy Market Correction?

In their latest analysis, the co-founders of the blockchain analytics firm posted on X (formerly Twitter), highlighting Bitcoin’s movement to the 6.618 Fibonacci Extension after a Bull Flag Correction. 

They draw parallels between the current correction and similar market conditions observed in late 2017 and 2020. The question arises: Will history repeat itself in 2024, and will Bitcoin reach its 6.618 Fibonacci Extension during this bullish market, setting a target of approximately $120K?

Bitcoin

Examining the chart above, the analysis by the Glassnode co-founders reveals a comparable price correction following Bitcoin’s breakout above the $10,000 price level, which initiated the bull trend that propelled the cryptocurrency to a $15,000 increase before reaching its current ATH of $69,000.

Likewise, Bitcoin exhibited a similar bull flag pattern after surpassing the $29,000 price level, leading to a 22-month high of $48,900 on January 11. Notably, this surge occurred shortly after the approval of Bitcoin spot ETFs by the U.S. Securities and Exchange Commission (SEC).

Considering these developments, the key to Bitcoin’s future trajectory lies in maintaining support around the $40,000 level and further consolidation above it. If these conditions are met in the coming months, Bitcoin has the potential to reach the 6.618 Fibonacci extension, pushing its price as high as $120,000.

New All-Time Highs Expected For Bitcoin

Like Glassnode co-founder’s recent price analysis, crypto analyst Crypto Con also relies on historical patterns to gauge the future price action of BTC. According to Crypto Con, the mid-top of this Bitcoin price cycle occurred slightly faster than previous cycles but slower than the third cycle. 

Notably, this mid-top represents the only instance where it occurred outside of an early top, as indicated by the purple and yellow dots on the chart provided by the analyst.

Bitcoin

Despite the 2019 mid-top occurring a year earlier than expected, the cycle top still manifested within the usual timeframe, plus or minus 21 days from November 28th, 2021. 

Crypto Con stresses that there is currently no evidence apart from complex theories to support the notion of an accelerated cycle. The analyst cautions against assuming that ETFs prevent potential Bitcoin price corrections. 

After November 28th, 2024, Crypto Con predicts the emergence of new all-time highs for the Bitcoin price of $90,000 or $130,000 and significant growth for the cryptocurrency market. 

Bitcoin

At the time of writing, BTC is trading at $40,590, down 2.5% in the past 24 hours. If this level is breached, Bitcoin could drop towards the $37,650 level as it is the next major support for the cryptocurrency.

Featured image from Shutterstock, chart from TradingView.com

Bloodbath For Bitcoin: Grayscale’s $529 Million BTC Move To Coinbase Pushes Price Below $41,000

Bitcoin (BTC), the largest cryptocurrency in the market, has experienced a sharp drop below the $41,000 mark as exchange-traded funds (ETFs) for Bitcoin went live on January 12. 

The subsequent profit-taking, selling pressure, and outflows from Grayscale’s Bitcoin Trust ETF (GBTC) played a significant role in the downward trend.

Grayscale’s Bitcoin Transfers To Coinbase Intensify

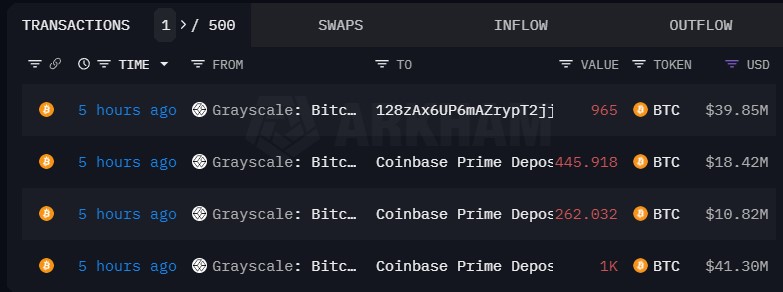
On Tuesday, NewsBTC reported that six days ago, Grayscale initiated the first batch of BTC outflows from their holdings to a Coinbase, totaling 4,000 BTC (approximately $183 million) over six days. 

However, the asset manager resumed outflows from the Trust to the exchange on Tuesday, sending an additional 11,700 BTC (equivalent to $491.4 million) to Coinbase. 

Furthermore, on Friday, data from Arkham Intelligence revealed that 12,865 BTC ($529 million) were transferred from the Grayscale Trust address to Coinbase Prime. 

Bitcoin

In total, the Grayscale Trust address has transferred 54,343 BTC ($2.313 billion) to Coinbase Prime during the opening hours of the US stock market over five consecutive trading days since January 12, which has undoubtedly contributed to the downtrend in Bitcoin’s price.

Selling Frenzy Among BTC Miners

In addition to Grayscale’s selling spree, there has been increased selling activity by Bitcoin miners ahead of the upcoming Bitcoin halving. 

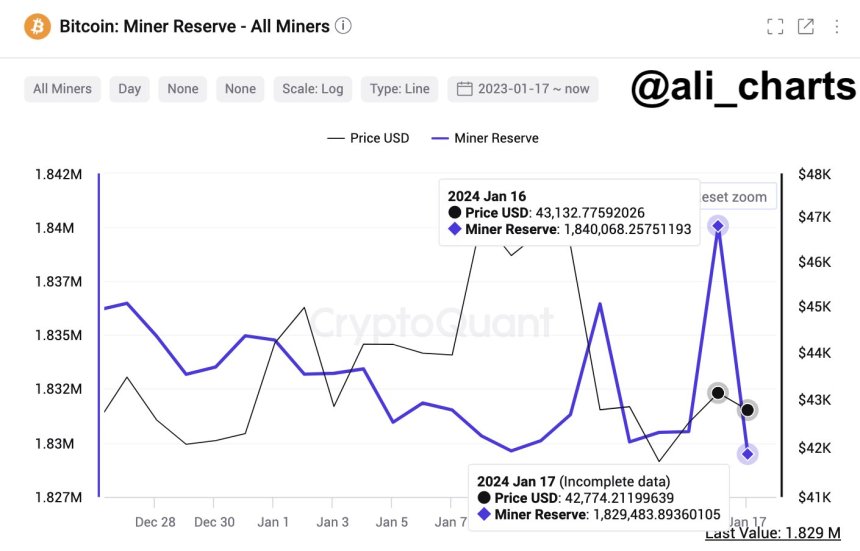
Crypto analyst Ali Martinez highlights that on-chain data from CryptoQuant indicates a substantial increase in selling activity by BTC miners. In the past 24 hours, miners offloaded nearly 10,600 BTC, with a value of approximately $455.8 million.

The persistent selling pressure has caused BTC to trade at $40,900, reflecting a slight 0.2% decrease over the past 24 hours. 

Bitcoin

The downtrend has been evident across various time frames, with declines of 5%, 6%, and 7% over the seven, fourteen, and thirty-day periods, respectively. However, despite these recent setbacks, Bitcoin remains remarkably positive year-to-date, with an impressive 98% gain.

Overall, the combined impact of Grayscale’s Bitcoin Trust ETF outflows and increased selling activity by miners has intensified the downward pressure on Bitcoin’s price, breaching the critical support level of $41,000. 

The focus now turns to how Bitcoin bulls will defend the crucial $40,000 support level, which stands as the last line of defense before a potential dip toward the $37,700 mark.

Bitcoin

Should this support level fail to hold, the Bitcoin market could witness further price declines, potentially pushing the price down to the $35,800 mark. However, with the Bitcoin halving scheduled for April, bullish investors are hopeful that this event will catalyze a significant bull run.

Featured image from Shutterstock, chart from TradingView.com
Bitcoin Misery Worsens: King Crypto’s Worst Week Has Investors Shivering Near $35,000

The Bitcoin market is experiencing a period of adjustment following the much-anticipated launch of US spot ETFs last week. After a surge to a two-year high near $49,000, the leading cryptocurrency has pulled back over the past four days, currently trading at $42,588 with a market capitalization of $834 billion.

This correction presents an opportunity to assess the underlying dynamics and potential future trajectories of the digital asset.

ETF Approval Hype Fades: Markets React

The initial excitement surrounding the ETF approval was palpable, fueling a rapid price increase as investors anticipated increased accessibility and institutional adoption. However, profit-taking and market uncertainty quickly set in, pushing the price back down closer to pre-ETF levels.

This pattern aligns with the “buy the rumor, sell the fact” phenomenon often observed in financial markets, highlighting the distinction between anticipation and actualization.

Adding to the selling pressure are recent outflows from the Grayscale Bitcoin Trust. The massive fund, previously trading at a discount due to its closed-ended structure, converted into an ETF last week.

However, some investors opted to redeem their shares instead of transitioning to the new structure, resulting in a net outflow of $579 million. This suggests that liquidity considerations and potential portfolio adjustments played a role in the post-ETF price movement.

Furthermore, the activity of Bitcoin miners, the decentralized network responsible for validating transactions and generating new coins, presents another factor to consider. The Bitcoin Miners’ Position Index (MPI) spiked to 9.43 on January 12, indicating a significant increase in Bitcoin movement by miners.

While the exact reasons for this activity remain unclear, it could potentially signal profit-taking by miners who wish to capitalize on the recent price appreciation.

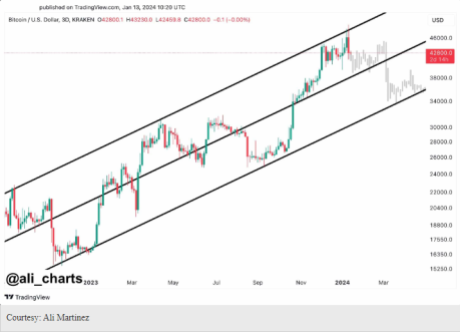
Despite the recent correction, analysts remain divided on the short-term and long-term prospects for Bitcoin. Ali Martinez, a prominent crypto analyst, identifies a “parallel channel” pattern in the price chart, suggesting a potential retracement to $35,000 before a potential rebound towards $50,000.

However, Martinez also acknowledges the risk of further downside pressure if miners continue to sell their holdings.

Bitcoin Outlook: Analysts Cautious Amid Complexity

Tony Sycamore, another market analyst, takes a more conservative approach, anticipating range-bound trading between $38,000 and $40,000 in the near future. Both analysts emphasize the importance of monitoring miner activity and investor sentiment in the coming weeks, as these factors will play a crucial role in determining the next directional move for Bitcoin.

Ultimately, the recent market dynamics highlight the complexity of the Bitcoin ecosystem. While the ETF launch represents a significant milestone for institutional adoption, it is not a guaranteed catalyst for immediate price appreciation.

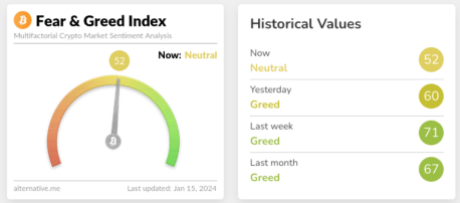
Meanwhile, just a few days after the historic approval of spot Bitcoin ETFs in the US, the Crypto Fear and Greed Index has dropped back to “neutral” levels, last seen in October 2023.

The indicator shows that the current market sentiment score for Bitcoin is 52 out of 100, which is the lowest since October 19 of last year, when the price of Bitcoin was trading for about $31,000 on a daily average.

Featured image from Shutterstock

ETF Frenzy: Bitcoin Takes A Dip, Ethereum Goes Hot And The Next Crypto Chapter

In a week etched in crypto history, the long-awaited arrival of Bitcoin ETFs in the US sent shockwaves through the market. Yet, despite the monumental achievement, the king of crypto, Bitcoin, took a step back on Saturday, dipping 6% to end the week barely above $43,000.

Many analysts predicted a “sell-the-news” scenario, where investors cashed in on profits built upon anticipation of the ETF approval. Others suggest a rotation into Ethereum, which surged 15% on the week and touched highs not seen since May 2022.

Ethereum ETF Speculation: Shaping Crypto Narratives

This speculation is fueled by expectations of imminent Ethereum ETF decisions from the SEC, potentially mirroring the winds that propelled Bitcoin towards a 60% rally in recent months.

According to Alex Saunders, a Citi analyst, the cryptocurrency market has transitioned to a new narrative, as Ethereum has outperformed Bitcoin. This surge is believed to be driven by anticipation that the second-largest cryptocurrency could receive approval for an ETF.

“In our view, the crypto market has already moved to the next narrative, with ETH rallying more than bitcoin, likely on the expectation that crypto’s second largest token could also see an ETF approval,” Saunders said.

While the immediate price action might paint a contrasting picture, the significance of the ETF launch for Bitcoin’s long-term trajectory remains undeniable. Market participants across the board agree that ETFs will pave the way for increased institutional adoption, a crucial step towards legitimizing Bitcoin as a serious asset class.

Analysts at Citi anticipate “extra prominence” for Bitcoin in diversified portfolios, although widespread inclusion is still some distance away.

The road to crypto acceptance, however, isn’t paved solely with Bitcoin. Litecoin, often dubbed “silver to Bitcoin’s gold,” emerged as another bright spot this week, on track for an impressive 11% gain. This signifies diversification within the crypto landscape, a trend likely to continue with the potential influx of other crypto ETFs.

Crypto Equities Shake Amidst Bitcoin’s Slide

Beyond the digital coins themselves, the news wasn’t as rosy for crypto-related equities and miners. Coinbase and MicroStrategy, heavily invested in Bitcoin, took tumbles of 6% and 8%, respectively. Miners, already on the back foot after suffering substantial losses on Thursday, extended their descent, with CleanSpark and Iris Energy experiencing double-digit drops.

This market snapshot illustrates the dynamic nature of the crypto ecosystem. While Bitcoin might have taken a breather after its historic week, the overall sentiment remains positive. Ethereum’s ascent and the anticipation of broader ETF access signal a shift in investor focus, suggesting a future where the crypto playing field isn’t solely Bitcoin’s domain.

The dust settles on Bitcoin’s ETF debut, leaving a wobbly king and a market yearning for the next narrative. Ethereum, bathed in its own ETF hopes, gleams like a challenger. In this dance of highs and lows, understanding the evolving stories matters more than chasing fleeting profits. Bitcoin’s wobble may yet be a prelude to a high-flying future. The crypto saga, after all, has only just begun.

Featured image from Shutterstock

Bitcoin Price Suffers Post-Spot ETF Blues, Drops 7% To $43,200

The introduction of Bitcoin (BTC) exchange-traded funds (ETFs) has triggered a significant sell-off, leading to a sharp decline in the Bitcoin price.

After gaining approval and commencing trading on Thursday, the ETFs have prompted a “sell the news” event, causing Bitcoin’s value to plummet from its initial trading price of $46,500 at the time of approval to a low of $43,200 within a matter of hours on Friday.

Over the past 24 hours, Bitcoin, the largest cryptocurrency by market capitalization, has experienced a 7% drop. Its gains over the past 30 days have been limited to a mere 4%, erasing much of the progress made during that period. 

Additionally, as selling pressure continues to mount following the approval, there are indications that the Bitcoin price may face further downward pressure.

Bitcoin Price Under Pressure

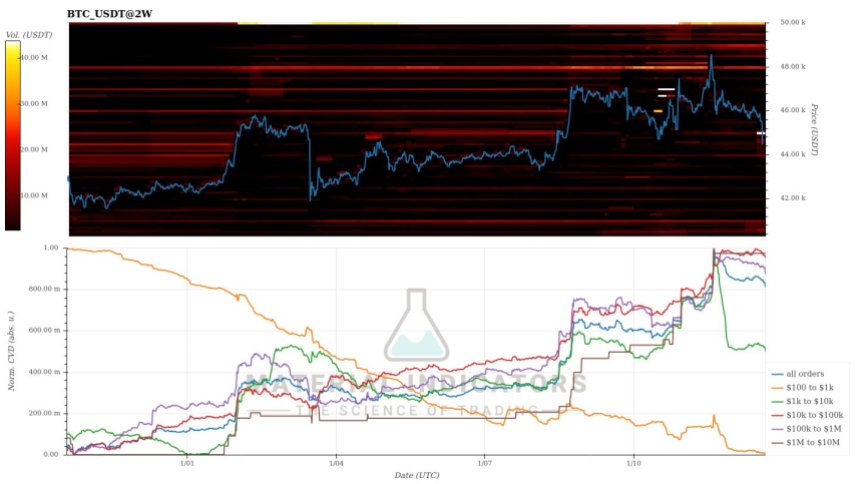
CryptoQuant analyst J.A. Maartunn observed significant sell orders in Bitcoin’s two-week chart on Wednesday. Notably, three clusters of sell orders were positioned between $46,100 and $48,000, comprising stacks of 755, 1,031, and 794 BTC, respectively.

According to the CryptoQuant analyst, such patterns are typically associated with market tops, unless these orders are later withdrawn or executed.

This influx of sell orders may help explain the lackluster response to the ETF approvals until now, as it appears that selling pressure has been building up. However, the situation has intensified even further. 

According to Maartunn, additional sell orders were detected on Friday, indicating that the seller is not yet finished. Two substantial sell orders have been placed just above the current Bitcoin price: one for 894 BTC at $44,000 and another for 1,071 BTC at $45,100.

Bitcoin price

These developments suggest that market participants are taking advantage of the ETF news to offload their Bitcoin holdings, leading to increased selling pressure and a subsequent price decline. 

The market’s stabilization following this period of heightened selling pressure remains uncertain. The introduction of ETFs was believed to bring about heightened institutional interest and potentially drive up the Bitcoin price. 

However, it is important to note that the impact of these ETFs is expected to unfold over the long term, rather than being evident within days, weeks, or even months. It will likely take years to fully gauge the effects and consequences of ETF integration on the Bitcoin market.

Bitcoin’s Bullish Structure Remains Intact

Amidst the ongoing selling pressure, several support lines may potentially halt the downtrend and bring positive news for the Bitcoin price and BTC bulls.

Although Bitcoin has already lost its $44,000 support level, there is another crucial threshold at $42,700 that could prevent further decline. If this level holds, there is a chance for Bitcoin to regain the $43,000 mark and reverse the downward momentum.

Bitcoin price

If the $42,700 support is breached, additional support lines come into play. These include $42,300, $41,700, and $41,200, which act as the last barriers before a potential test of the $40,000 support level. The $40,000 mark holds significance as it represents the final support before a potential dip towards $38,000.

However, there is a positive aspect for Bitcoin bulls to consider. The current bullish structure of the cryptocurrency remains intact as long as the dip does not breach the $29,900 mark.

This level marked the beginning of the current bullish uptrend, and its preservation would ensure the maintenance of the overall positive market structure.

Featured image from Shutterstock, chart from TradingView.com 
Bitcoin ETF Approval Triggers $1.2 Billion Trading Volume And New Highs For BTC Price

In a highly anticipated move, the United States Securities and Exchange Commission (SEC) approved all 11 Bitcoin ETF applications, and the market response has been nothing short of remarkable. The approval has led to significant trading volume and propelled Bitcoin to a new 22-month high.

Within minutes of the Bitcoin ETFs going live, Bitcoin surged over 8% to reach $48,400, representing a new record since the end of the crypto bear market. The early price movement aligns with the predictions made by the majority of experts in the crypto industry.

Bitcoin ETF Trading Makes Spectacular Debut

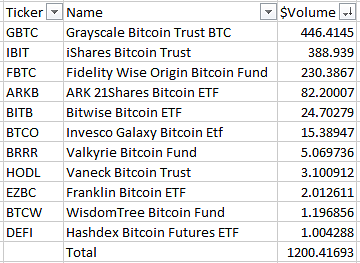
Bloomberg ETF expert James Seyffart reported an astonishing $1.2 billion in trading volume for spot Bitcoin ETFs within 30 minutes of trading. Seyffart captured the excitement with his “Cointucky Derby” analogy, highlighting the performance of different ETFs.

Grayscale’s GBTC Bitcoin Trust took the lead in the “Cointucky Derby,” recording an impressive trading volume of $446 million in the initial minutes. It was closely followed by BlackRock’s Bitcoin Trust, which achieved a trading volume of $388 million within the first half-hour.

Bitcoin ETF

Fidelity secured the third spot with a trading volume of $230 million, outperforming Hashdex and Wisdom Tree, which recorded $1 million and $1.1 million in trading volume, respectively.

While the exact breakdown of the trading volume remains uncertain, Seyffart noted that the evening’s data might provide more insights. 

However, the Bloomberg ETF expert speculated that a significant portion of the trading volume could be attributed to new flows into the ETFs. Additionally, he suggested that a notable portion of GBTC’s trading volume might be due to outflows.

Is Bitcoin On A Clear Path To $50,000?

With the Bitcoin ETF race in full throttle, Bitcoin appears to be on a promising trajectory toward the $50,000 milestone, which could serve as a significant catalyst for Bitcoin bulls and the broader crypto industry.

Currently, having surpassed the $48,000 mark, Bitcoin’s price has reached a level where minimal resistance levels are hindering its ascent to $50,000. 

The next notable hurdle lies well above $50,700, followed by potential attempts to reach $53,000. Given the expected spot buys in the Bitcoin market following the approval of Bitcoin ETFs, combined with a considerable separation between major resistance lines, these price levels may be easily breached.

Once beyond the $50,000 threshold, Bitcoin could potentially progress to $51,000, then $53,000, and subsequently $56,000, before ultimately setting its sights on the highly anticipated $60,000 milestone. 

This series of price targets may be readily attainable for the largest cryptocurrency in the market, as it navigates through the anticipated market dynamics.

Ultimately, the SEC’s approval of the Bitcoin ETFs has brought renewed optimism to the market, with investors and industry experts closely monitoring the impact of these ETFs on the broader cryptocurrency landscape. 

The surge in trading volume and Bitcoin’s impressive price movement signify growing interest from investors seeking regulated and traditional investment avenues in the cryptocurrency market.

Bitcoin ETF

Featured image from Shutterstock, chart from TradingView.com
Bitcoin Price Forecast: Analysts Caution Against Missing Out As BTC May Surge To $500k With ETF Launch

As the Bitcoin price has regained previously lost territory, following reports suggesting that the US Securities and Exchange Commission (SEC) would reject the long-awaited Bitcoin spot exchange-traded funds (ETFs), new developments have reignited hopes among investors. 

Although the approval of these index funds is not expected to occur on Friday, sources indicate that the upcoming week may bring positive news. 

ETF Approval To Drive Gradual Bitcoin Price Surge To $500,000

FOX journalist Eleanor Terret reports that amended 19b-4 filings and last-minute phone calls regarding comments on S-1s and possible launch dates are expected in the coming days. 

While approvals seem likely in the next week, according to Terret, the timeline ultimately depends on the SEC’s ability to review the comments and amendments submitted efficiently. 

Terret describes the current situation as a meticulous process of “dotting the i’s and crossing the t’s,” emphasizing the attention to detail required for regulatory clearance. 

On the other hand, crypto analyst Adam Cochran offers valuable insights into the potential impact of Bitcoin ETFs, as all signs point to the imminent approval of these investment products.

Cochran suggests that many may “overestimate” the short-term effects of ETF approval while underestimating its long-term implications. In the immediate aftermath, market flows may not witness a significant surge. However, Cochran believes that investment advisors will review their clients’ portfolios over the next year and recommend diversifying even a small percentage, such as 1%, into the ETF. 

Cochran emphasizes that the Bitcoin price performance, with a remarkable 157% return in the latter half of 2023, will be a key factor driving investor interest. 

Cochran envisions a gradual upward trajectory for the Bitcoin price, characterized by persistent growth and occasional market volatility. 

Ultimately, Cochran’s long-term forecast indicates a potential Bitcoin price surge to $500,000 per coin, leaving sidelined investors regretfully waiting for a substantial market correction. Cochran further noted:

Also, ETFs result in spot buys, not leverage, which improves system health. And are long-term holders, less likely to sell volatility. So it creates a slow grind up of underlying market health. Like the best DCA you could ask for. 

Bitcoin ETF Pricing Potential Not Fully Realized

Crypto analyst Ali Martinez suggests that the pricing potential of a Bitcoin ETF may not have been fully realized, providing insight into the current state of the Bitcoin market.

Martinez points to a decline in the estimated leverage ratio across all exchanges, reaching a two-year low. This indicates that Bitcoin traders are adopting a more cautious approach, reducing their use of borrowed funds as they await regulatory clarity on the ETF. 

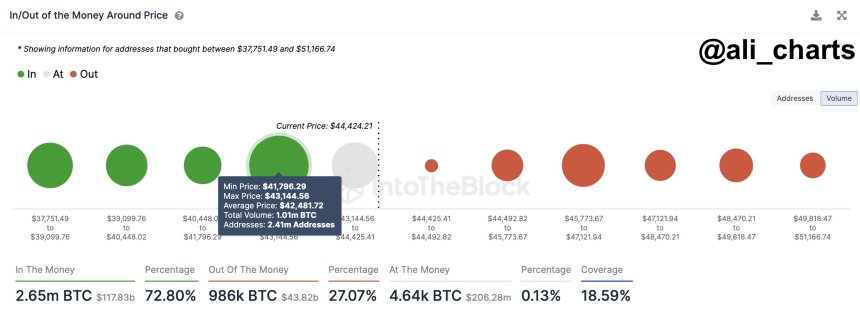
Furthermore, Martinez emphasizes the significance of Bitcoin’s price above $41,800. According to Martinez, Bitcoin’s ability to maintain its position above $41,800 is crucial for establishing a bullish outlook. 

This level is reinforced by approximately 2.41 million addresses holding over 1 million BTC, creating a substantial support zone. 

Bitcoin price

The significant number of addresses with substantial Bitcoin holdings suggests a strong interest in maintaining the cryptocurrency’s value and provides a foundation for market stability. Martinez notes that the resistance levels ahead for Bitcoin appear relatively minor. This implies that fewer significant barriers are impeding potential price increases. 

With reduced resistance, the market conditions become more favorable for stable or rising prices, further supporting the bullish sentiment.

Bitcoin price

Featured image from Shutterstock, chart from TradingView.com 
Bitcoin Price Analysis: Ascending Parallel Channel Pattern Points To $57,000 Target

As anticipation builds around the potential approval or rejection of spot Bitcoin (BTC) exchange-traded funds (ETFs) by the US Securities and Exchange Commission (SEC) on January 5, the Bitcoin price has witnessed a notable 2.7% recovery in the past 24 hours. 

This development comes amidst growing speculation about the patterns that could drive the Bitcoin price to reclaim the highs lost during the bear market in 2022. 

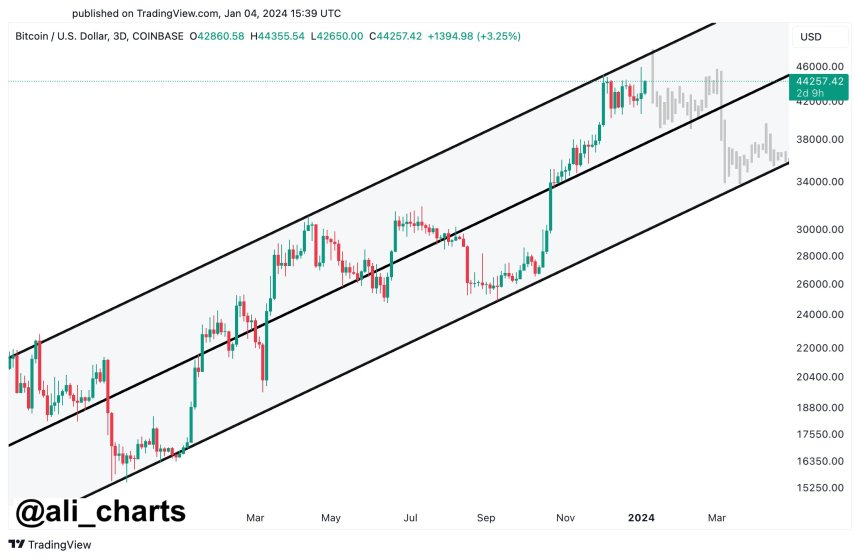
Notably, crypto analyst Ali Martinez has identified an ascending parallel channel as the governing pattern behind the Bitcoin price action since September 2023.

Bitcoin Price Faces Crucial Test At $48,000

According to Ali Martinez’s analysis, Bitcoin prices have exhibited a consistent pattern known as an ascending parallel channel. 

This technical formation suggests that the BTC’s price has been trading within the confines of a channel characterized by an upper and lower boundary, as seen in the chart below.

Bitcoin price

BTC could experience further price movement within the defined boundaries if the ascending parallel channel pattern holds. 

The price is expected to advance toward the upper boundary, which currently resides around $48,000. However, the Bitcoin price is anticipated to face resistance at this level and retrace towards the lower boundary at approximately $34,000. 

Following the retracement, a rebound toward the upper boundary, potentially reaching around $57,000, could be expected.

The upcoming decision by the SEC regarding spot Bitcoin ETF applications adds a layer of significance to Bitcoin’s price movement. The approval of Bitcoin ETFs has been a subject of great interest within the cryptocurrency community, as it can enhance liquidity and provide greater legitimacy to the cryptocurrency market. 

While the outcome of the SEC decision remains uncertain, the ascending parallel channel pattern reveals a compelling technical perspective that could impact Bitcoin’s price trajectory.

Critical Moment For BTC? 

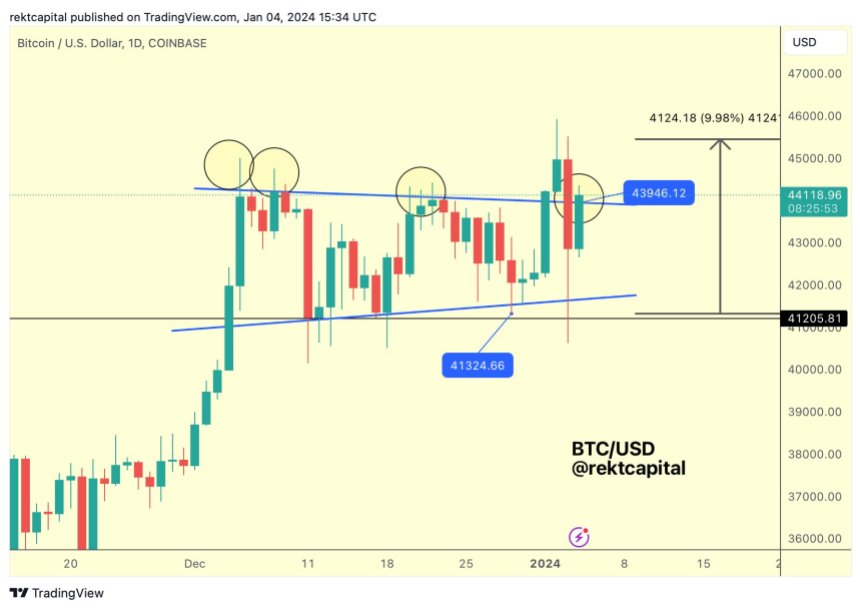
Supporting the upside potential of the Bitcoin price in Martinez’s analysis, crypto analyst Rekt Capital highlights the importance of BTC’s ability to establish a strong support level at $43,900.

According to Rekt Capital’s analysis, Bitcoin is exhibiting promising signs as it strives to reclaim the top of the pattern at $43,900 as a support level. 

Bitcoin

This level holds importance in determining the cryptocurrency’s ability to sustain upward momentum. Rekt Capital suggests that a daily candle close above this resistance is essential for Bitcoin to make another attempt at moving higher.

The successful establishment of $43,900 as a support level and a daily candle close above this resistance would signify a positive development for Bitcoin’s upside potential. 

It would indicate a renewed bullish sentiment and potentially pave the way for further price appreciation. However, failure to overcome this resistance level and ending up as an upside wick could hinder Bitcoin’s ability to sustain upward momentum in the short term.

Bitcoin price

On Wednesday, Bitcoin trades at $44,000, followed by a news-driven dip toward the $40,800 level.

Featured image from Shutterstock, chart from TradingView.com 
Bitcoin Price Targets: MVRV Points To $52,000 And $70,000 Levels For BTC, Expert Suggests

In a recent development, the Bitcoin price witnessed a remarkable surge of 7% within 24 hours, reaching a high point of $45,300. This significant price increase coincides with the anticipation surrounding the potential approval of a Bitcoin spot exchange-traded fund (ETF) by the US Securities and Exchange Commission (SEC). 

In addition, market experts, backed by multiple models aligning to indicate increased price action and bullish momentum, suggest that Bitcoin could soon reach the $50,000 level and potentially establish a new all-time high (ATH).

Bitcoin Price Poised To Reach New All-Time High? 

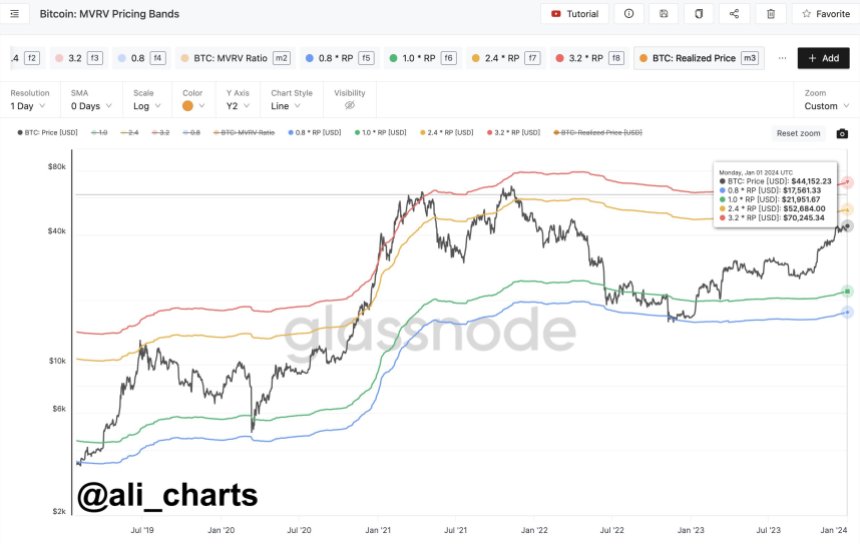
At the forefront of this analysis is Ali Martinez, a renowned crypto analyst, who emphasizes the valuable insights provided by the Bitcoin Market Value to Realized Value (MVRV) pricing bands. 

These bands serve as a metric to analyze the price movement and potential levels of Bitcoin, or any other cryptocurrency, by comparing the market value to the average value at which coins were last moved on-chain. The MVRV ratio assesses whether Bitcoin is overvalued or undervalued relative to its historical on-chain activity. 

A high MVRV ratio suggests that the market value of Bitcoin has surpassed the average value at which coins were last moved, indicating a potential overvaluation. Conversely, a low MVRV ratio may indicate that Bitcoin is undervalued.

Bitcoin price

Considering these factors, Martinez highlights the significance of the MVRV pricing bands, which reveal key price targets for Bitcoin at $52,680 and $70,250, surpassing its previous ATH of $69,000. 

This analysis presents an optimistic outlook for Bitcoin’s future performance and reinforces the belief among investors that the cryptocurrency’s upward momentum is likely to continue.

However, despite these Bitcoin price projections that could propel the largest cryptocurrency on the market into uncharted waters, another analyst points to a more prudent prediction.

Cooling Period For BTC? 

According to renowned crypto analyst Crypto Con, despite a year-long bullish stance, he believes it is time for a cooldown as the new year, 2024, begins.

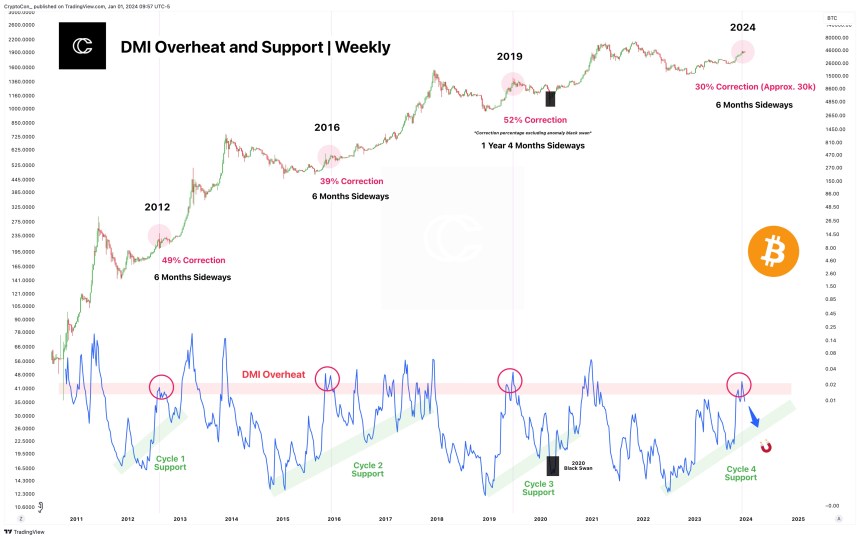
Crypto Con predicts a 30% correction from the directional movement index (DMI) overheat zone, projecting prices around $30,000. The overheat zone mentioned by Crypto Con suggests that the price of Bitcoin has experienced a significant upward movement and may be due to a correction or cooling period. 

Bitcoin price

As seen in the chart above, when the price enters this zone, it is seen as a signal that the trend may have become overextended and could potentially reverse or experience a pullback.

Drawing parallels to the example in 2019, characterized by a double peak in red, Crypto Con anticipates a drawdown that is both smaller in magnitude and shorter in duration. 

Furthermore, the analyst points to the consistent support offered by diagonal green zones throughout each cycle, suggesting a pattern that has been held thus far.

While some analysts project a new all-time high for the Bitcoin price, reaching uncharted waters above $70,000, others, such as Crypto Con, advocate for a cooling period and anticipate a correction in the near term.

Bitcoin price

Featured image from Shutterstock, chart from TradingView.com
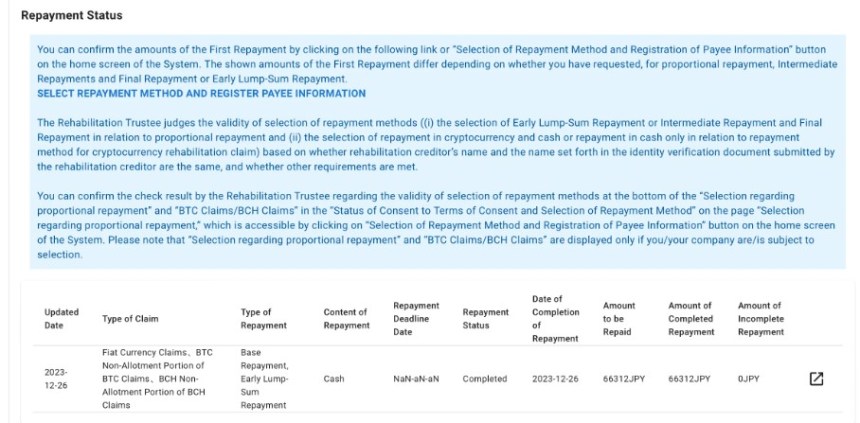
Mt. Gox Repayment Rumors Cause Bitcoin Price To Drop To $42,000, Market In Turmoil

Mt. Gox, the infamous Bitcoin exchange that suffered a major hack over a decade ago, has allegedly finally begun the process of repaying its customers for the 850,000 lost Bitcoin. This news has sent shockwaves through the market, causing a momentary disruption in the Bitcoin price uptrend.

As a result of these developments, the current price of Bitcoin stands at $42,625, with a 24-hour trading volume of $22,655,498,534.64. 

However, the market has witnessed a -2.40% decline in the past 24 hours, reflecting the uncertainty caused by the Mt. Gox repayment proceedings.

Bitcoin Price Plunges Amidst Mounting Speculation

Reports from participants in the mtgoxinsolvency subreddit group indicate that some individuals have already received payouts in yen via PayPal. 

However, those who opted for cash deposits into their bank accounts have not reported any inflows as of yet. Several users have shared notifications they received, alerting them to a system error that resulted in double payments. 

These users are now allegedly being requested to return the excess funds to the Rehabilitation Trustee promptly.

Moreover, the Rehabilitation Trustee has reached out to affected individuals to refund the mistakenly transferred amount, which was the second transfer, as the first transfer was the official repayment. 

Bitcoin price

Users have been instructed to use PayPal’s “Refund” feature to return the funds to the Rehabilitation Trustee’s account. Alternatively, they can transfer an equivalent amount of money to the Rehabilitation Trustee’s PayPal account if the “Refund” feature is unavailable.

While some users have confirmed receiving their repayments, there is uncertainty surrounding the timing of Bitcoin reimbursements or if they are taking effect.

No Bitcoin Outflows Detected From Mt. Gox?

In a recent statement by CryptoQuant co-founder and CEO, Ki Young Ju, it has been confirmed that “no Bitcoin outflows have been recorded from the Mt. Gox Trustee wallet at this time.” 

Furthermore, the trustee responsible for managing the rehabilitation proceedings of Mt. Gox, the now-defunct Bitcoin exchange, has yet to provide any official statements explaining the absence of outflows from the wallet. 

Consequently, the cryptocurrency community finds itself on edge, eagerly awaiting updates regarding the timing and method of Bitcoin reimbursements.

Once again, the cryptocurrency community has been hit by another bout of misinformation surrounding the long-awaited Mt. Gox exchange repayment to its customers. 

The spread of this news has had a notable impact on market sentiment and has stirred volatility in the Bitcoin price. The future timeline and potential effects of the exchange’s repayment, slated for 2024, remain uncertain.

Bitcoin price

Featured image from Shutterstock, chart from TradingView.com