Bearish Divergence? Bitcoin Price Rises, But Network Growth Sends Warning Signals

The recent Bitcoin (BTC) price surge has ignited renewed interest and confidence among investors, leading many to believe that the BTC bull run is accelerating. 

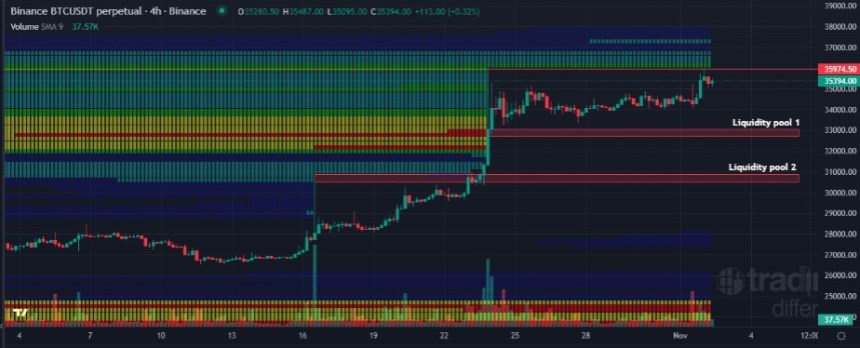
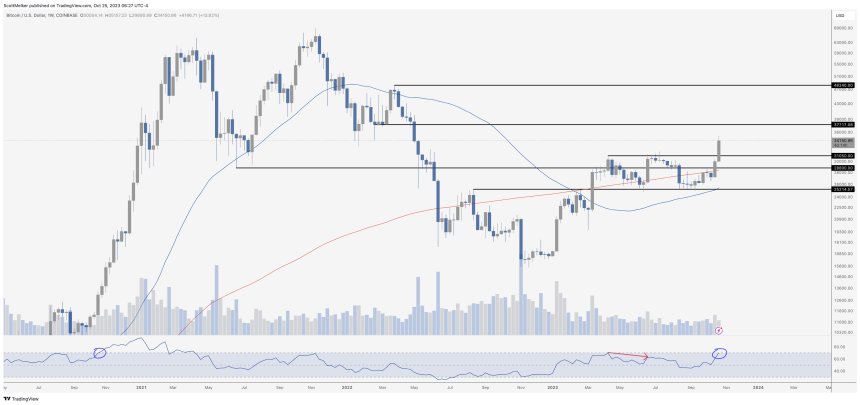
According to trader and crypto analyst Adrian Zduńczyk, Bitcoin has reached a new 52-week closing high and has maintained a close above the previous high of $32,000 for three consecutive weeks. 

This sustained upward momentum indicates a strong bullish trend sentiment and signals the beginning of the third wave of the Bitcoin bull run.

Analyst Highlights Key Trends

Zduńczyk points out several dominant trends that contribute to the positive outlook for Bitcoin. The rising 200-week and 50-week moving averages (MAs) highlight the long-term uptrend strength, with key support levels at $28,800 and $26,600. 

Additionally, there is a growing correlation with the S&P 500, as evidenced by the 7-week correlation coefficient of 0.34. This alignment with traditional markets suggests that Bitcoin increasingly trades similarly to the Nasdaq.

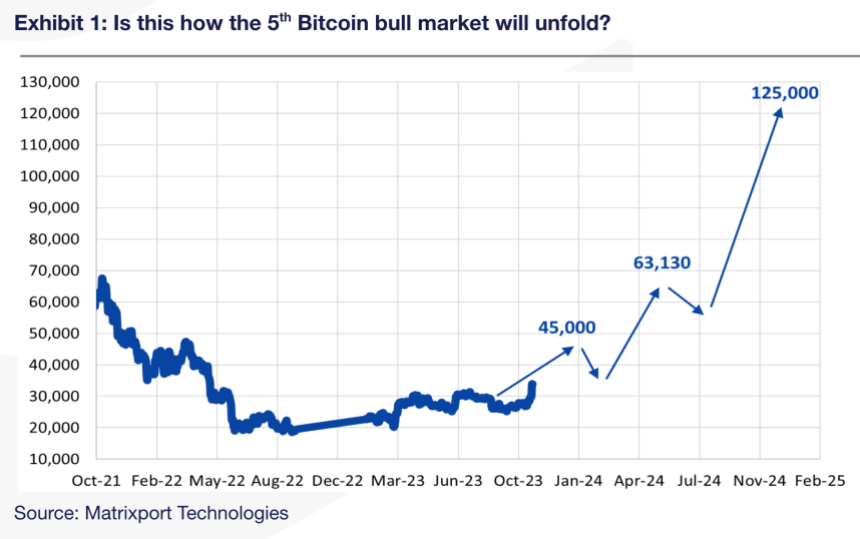
Fundamental drivers also play a significant role in Bitcoin’s upward trajectory. Traders eagerly anticipate the approval of spot Bitcoin exchange-traded funds (ETFs) and the upcoming fourth halving event. 

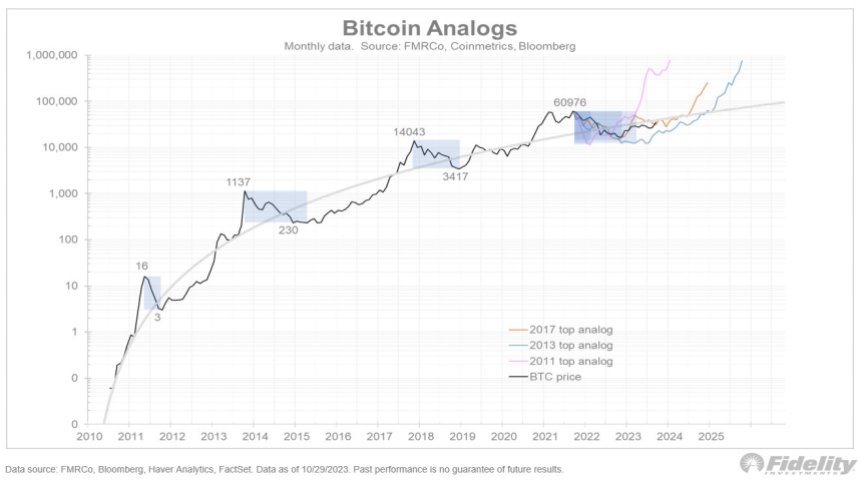
Furthermore, according to Zduńczyk, the historical pattern of previous halvings indicates that Bitcoin has rallied significantly after each halving and has never retraced to pre-halving prices. 

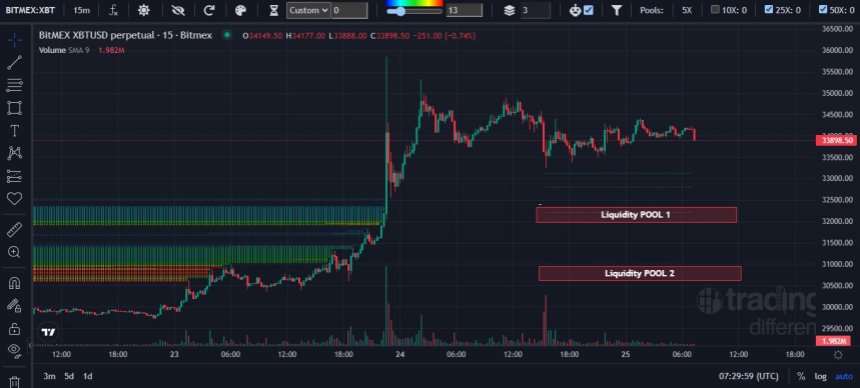
Examining the daily trend, Zduńczyk highlights the technical strength demonstrated by Bitcoin’s reliable breakout above $32,000. Breakouts often lead to new trend formations that persist over time. 

Despite occasional volatility, the 50-day average true range (ATR) trend and the 50-day relative strength index (RSI) momentum trend are rising, indicating ongoing positive momentum.

Bitcoin’s future appears promising, supported by positive market trends, fundamental drivers, and technical indicators. However, warning signs cast doubt on Bitcoin’s favorable outlook, as renowned crypto analyst Ali Martinez pointed out

Bitcoin Bullish Momentum At Risk?

Martinez draws attention to the bearish divergence between Bitcoin’s price and network growth, indicating a potential lack of sustained momentum in the ongoing uptrend.

Bitcoin

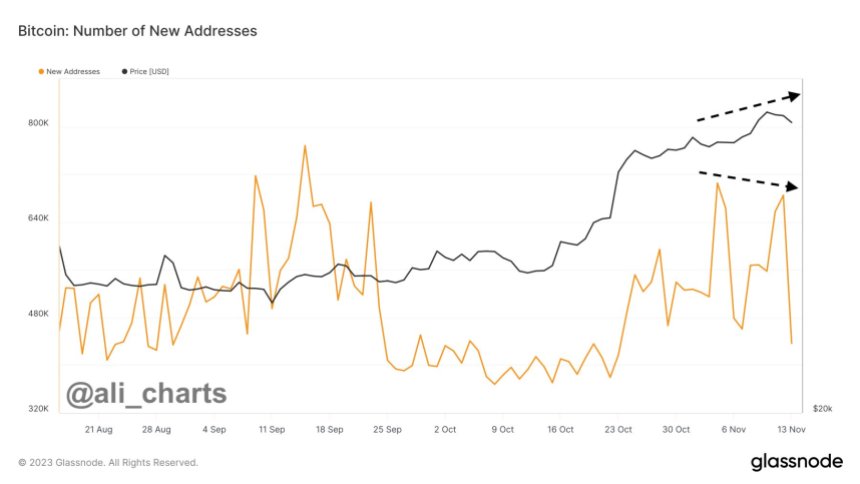
The chart above shows a notable disparity between the exponential rise in Bitcoin’s price and the dramatic decline in new addresses over recent days. 

This bearish divergence raises concerns about the overall strength of the current uptrend. While Bitcoin’s value has experienced significant gains, the number of new addresses created has decreased significantly.

According to Martinez, this bearish divergence between Bitcoin’s price and network growth serves as an on-chain sell signal that traders should be aware of. The slowdown in network growth despite the price surge suggests that the current upward momentum may not have enough strength to sustain.

Bitcoin

At the time of writing, BTC is trading at $36,200, down 1.6% over the past 24 hours. However, it is still up a substantial 4.6% over the past 7 days. 

It remains to be seen if a surge in new addresses will be able to support BTC’s bullish momentum and break the current consolidation phase. Alternatively, the cryptocurrency could retest support levels in the coming days.

Featured image from Shutterstock, chart from TradingView.com

Analyst Raises Red Flag On Bitcoin Rally, Predicts Imminent Retreat After 35% Spike

As Bitcoin (BTC) continues to consolidate above the $34,000 mark, aiming to surpass and reclaim its yearly high, theories suggest that a retracement may follow the current upward spike in the coming weeks. 

On this matter, the renowned crypto analyst known by the pseudonym “Crypto Soulz” recently shared insights on the potential short-term retracement for Bitcoin in a recent post on X (formerly Twitter).

BTC’s Local Top At $36,000 Signals Potential Reversal

According to Crypto Soulz, a key resistance level for Bitcoin is identified at $37,370. The analyst suggests that this resistance level will not likely be retested from the current position. 

Additionally, Soulz highlights that liquidity has been absorbed around $36,000, which he considers a “trigger” for taking short positions.

The analyst points out that the local top for BTC was observed at $36,000, where a long wick was formed, followed by a retracement. This price action is seen as a potential indication of a reversal.

Moreover, Crypto Soulz emphasizes using on-chain data as a confluence for BTC positions. Soulz highlights that the spot market showed an uptrend before the perpetual futures contracts followed suit. 

The spot order book (OB) is stated to be increasing but expected to decrease, along with the perpetual market. If $36,000 indeed serves as a local top, the analyst suggests that both spot and perpetual should subsequently decrease.

Furthermore, Soulz highlighted that BTC successfully broke through key technical indicators, such as the 200-day simple moving average (SMA), the 200-week SMA, and the 365-day SMA, which is currently acting as support. 

Bitcoin

Ultimately, Soulz further states that there is no substantial liquidity available above $38,000. The analyst identifies two liquidity pools, as seen in the chart above: the first at $33,000, which he considers its initial target, and the second at $31,000, where a slight bounce may occur.

Bitcoin Potential As Store Of Value

In another development, Jurrien Timmer, Fidelity’s Director of Global Macro, delved into the characteristics of Bitcoin and its potential to serve as a store of value and hedge against monetary debasement.

Drawing parallels to gold, Timmer highlighted Bitcoin’s “unique attributes” and its ability to potentially gain market share in times of inflation and excessive money supply growth.

Timmer acknowledged that Bitcoin had followed a pattern of “boom-bust cycles,” much like its previous market behavior. However, he also emphasized Bitcoin’s evolving role as a commodity currency that aspires to be a store of value. 

Bitcoin

Furthermore, Timmer described Bitcoin as “exponential gold,” suggesting that it shares similarities with gold but with additional growth potential.

While gold has traditionally been recognized as a store of value, Timmer noted its limitations as a medium of exchange due to its deflationary nature and lack of efficiency. 

Timmer drew attention to historical periods, such as the 1970s and 2000s, when gold exhibited strength and gained market share. These periods coincided with structural regimes marked by high inflation, negative real rates, and excessive money supply growth. 

Timmer hinted that Bitcoin, with its potential to serve as a hedge against inflation and debasement, could play a similar role in such environments.

Considering Bitcoin’s attributes and the changing macroeconomic landscape, Timmer expressed optimism about its potential to join the ranks of gold as a valuable asset. 

While acknowledging the volatility and speculative nature of cryptocurrencies, Timmer believes that Bitcoin’s unique characteristics position it as a viable contender in the store of value space.

Bitcoin

Currently, BTC is trading at $34,700, reflecting a 1.5% increase over the past 24 hours as it persists in reaching the $35,000 mark.

Featured image from Shutterstock, chart from TradingView.com 

Bitcoin Price Surge: Matrixport Forecasts $125,000 Price Target By December 2024

Bitcoin price (BTC) is currently displaying a significant uptrend, showing no signs of slowing down. The cryptocurrency has already begun its fifth bull run, with impressive price targets anticipated in the coming year. 

A recent report from Matrixport highlights BTC’s history of four distinct bull market cycles, each driven by a unique narrative. However, the latest bull market, which started on June 22, 2023, stands out due to its primary driving force: institutional adoption

Per the report, this surge in institutional interest can be attributed to Bitcoin’s characteristics, traditionally associated with safe-haven investments like Gold, as well as mounting concerns over the United States debt-to-GDP ratio. Matrixport’s report predicts that Bitcoin’s price could reach an impressive $125,000 by December 2024.

Bitcoin Price Rise Aligns With Mounting US Debt

Matrixport suggests its emergence as a new payment mechanism propelled the first Bitcoin bull market in 2011. The second cycle was driven by China, where Bitcoin gained recognition as an alternative form of money. 

The rise of initial coin offerings (ICOs) marked the third cycle, providing a novel means of establishing and funding companies. The fourth cycle saw the decentralized finance (DeFi) summer and the NFT craze dominating the market.

However, per the report, Bitcoin’s current bull market is driven by institutional adoption. Institutions are considering Bitcoin for diversifying their asset allocation due to its characteristics akin to safe-haven investments

Notably, the surge in Bitcoin’s value coincides with the United States’ escalating debt-to-GDP ratio, making it an attractive choice for institutions seeking to hedge against potential economic instability.

Based on historical price signals, Matrixport estimated that Bitcoin price could reach $125,000 by December 2024. 

Bitcoin Price

Interestingly, the report suggests that the onset of this bull market was officially recognized when BTC reached a new one-year high on June 22, 2023. 

Furthermore, Matrixport advises that the optimal entry point to buy Bitcoin is ideally 14-16 months before the next halving event. The report suggested that the end of October 2022 was an opportune time to enter the market when Bitcoin traded at $17,000.

Potential BTC Correction On The Horizon?

Despite the hype surrounding the current uptrend experienced by most cryptocurrencies on the market, crypto analyst “Crypto Soulz” presents a contrasting view on the future of Bitcoin price.

In a recent analysis of X (formerly Twitter), the analyst provides several reasons for considering a short position on BTC. According to Crypto Soulz, the next significant resistance level is at $37,330, but Soulz doubts the possibility of retesting it in the current market conditions. 

Bitcoin recently reached a local top at $35,300, leading Crypto Soulz to believe a price decline may follow. The analyst emphasizes retesting the $31,500 level as crucial support, which Bitcoin did not revisit during the recent price surge. 

Crypto Soulz notes that spot and perpetual contracts rose during the pump, indicating potential market instability. Additionally, the futures market experienced significant liquidations during the rally, similar to previous wipe-outs in January and August.

Bitcoin Price

Upon examining the liquidation heatmap, Crypto Soulz identifies liquidity below the current price, implying a potential downward movement. Soulz targets specific liquidity pools at $32,300 and $30,800 as potential areas for the price decline. 

Based on its analysis, Crypto Soulz expects Bitcoin to “cool off” from its current levels and target lower prices. 

Bitcoin Price

At the time of writing, the price of Bitcoin is currently at $34,000, experiencing a 2.5% retracement in the past 24 hours.

Featured image from Shutterstock, chart from TradingView.com 

Bitcoin Bullish Momentum Reignites: RSI Signals Potential Surge To $65,000

After experiencing a brief correction from its new yearly high of $35,300, Bitcoin (BTC), the leading cryptocurrency in the market, is showing signs of renewed bullish momentum. 

As the digital asset approaches the $35,000 mark again, a key indicator is following patterns observed in 2020, suggesting a potential surge that could propel Bitcoin to reclaim its previous peak of $65,000. 

Scott Melker, a prominent crypto investor and host of the ‘Wolf of All Streets’ podcast, notes the significance of Bitcoin’s overbought Relative Strength Index (RSI) on both lower time frames and the weekly chart, hinting at a promising trajectory for the cryptocurrency’s price.

BTC’s 2020 RSI Flashback

Bitcoin’s RSI, a widely used technical indicator that measures the strength and speed of price movements, is currently flashing signs of extreme overbought conditions on various lower time frames. 

Notably, the daily RSI stands at 88, indicating a potential need for a healthy retracement. However, the weekly RSI garners attention as it has just entered the overbought zone, a range historically associated with substantial upward movements in a true bull market.

To gain insights into Bitcoin’s potential future trajectory, it is worth revisiting the patterns observed in 2020. 

Bitcoin

According to Melker, during that year, Bitcoin’s RSI went overbought on the weekly chart when the cryptocurrency was trading around $12,000, as indicated by a small blue circle on the bottom left of the chart above. 

Subsequently, Bitcoin embarked on an unprecedented rally, surging to $65,000. This historical precedent highlights the possibility of a similar price action if true bullish catalysts emerge.

With Bitcoin’s weekly RSI entering the overbought territory once again, there is a growing sentiment among market observers that the cryptocurrency has ample room to run. 

Scott Melker emphasizes that if significant bullish catalysts materialize, Bitcoin’s potential for further upside becomes virtually limitless. The current RSI readings hint at the potential for an extended price rally, potentially enabling Bitcoin to surpass its current highs and reach the coveted $65,000 level.

Bitcoin Market Dynamics Shift As Key Indicators Surge

Adding to Melker’s bullish outlook for BTC, crypto analyst Miles Deutscher has stated on X (formerly Twitter) that the Bitcoin market landscape has witnessed a notable shift in recent days, leading to a significant uptick in bullish sentiment. 

In particular, volume and open interest in Bitcoin-related futures and options on the Chicago Mercantile Exchange (CME) have risen to multi-month and multi-year highs, indicating growing interest and participation from institutional investors.

Moreover, call options open interest has surpassed the peak levels seen during the 2021 bull run. In tandem with these developments, average crypto-related stocks have experienced a substantial uptick, and public funds have seen a massive influx of $43 million into Bitcoin, equivalent to 10% of the year-to-date inflows, all within a single day.

These metrics reflect increased trading activity and liquidity in the Bitcoin derivatives market, indicating heightened institutional interest. Such a surge in trading volume often precedes significant price movements, leading some analysts to anticipate a potential bullish breakout shortly.

Another encouraging sign for Bitcoin’s prospects lies in the call options open interest, which has recently surpassed $10 billion. To put this into context, during the peak of the 2021 bull run, call options open interest reached $9.9 billion. 

This milestone suggests that market participants are increasingly positioning themselves for a potential rise in Bitcoin’s price. The growing number of call options indicates a bullish sentiment among traders, further fueling expectations of a potential price surge.

Bitcoin

As of the time of writing, Bitcoin is trading at $34,500, successfully reclaiming the level it briefly lost during a recent correction on Tuesday. Over the past 24 hours, Bitcoin has maintained gains of 1.4%.

Featured image from Shutterstock, chart from TradingView.com 

MicroStrategy’s Bitcoin Portfolio Soars Past $5 Billion As BTC Holds Firm At $34,000

In a remarkable turn of events for the business intelligence (BI) company MicroStrategy, the recent bullish momentum of Bitcoin (BTC) has resulted in significant profits and a resurgence for the company. 

MicroStrategy has returned on a profitable trajectory after a prolonged period of market downturn and losses suffered by companies with cryptocurrency holdings.

MicroStrategy’s Bitcoin Holdings Surge 

Just a month ago, MicroStrategy and its subsidiaries made a strategic move by increasing their BTC holdings. According to a filing with the US Securities and Exchange Commission (SEC), the company, co-founded by renowned investor Michael Saylor, added 5,455 BTC to their portfolio, valued at $147 million.

As of the time of writing, MicroStrategy’s Bitcoin holdings stand at a staggering 158,245 BTC, with a total valuation of approximately $4.68 billion. 

Over the past 24 hours, Bitcoin has experienced a remarkable upswing, breaking through a long consolidation phase above $27,000 and reaching a new 2023 high. With a significant surge of 12.2%, BTC peaked at $35,300. This surge has unlocked substantial unrealized profits for MicroStrategy.

According to Lookonchain, MicroStrategy’s Bitcoin holdings have generated an estimated unrealized profit of around $746 million. 

With BTC’s skyrocketing price, MicroStrategy’s strategic accumulation of 28,560 BTC since May 2022, at an average price of $25,707, has proven profitable. 

Bitcoin

MicroStrategy’s success in capitalizing on the recent price surge of Bitcoin highlights the company’s strategic approach and belief in the long-term value of the cryptocurrency. 

By significantly increasing their Bitcoin holdings, MicroStrategy has positioned itself to benefit from BTC’s continued growth and adoption.

BTC Bears Crushed As $300 Million In Shorts Liquidated

The cryptocurrency market witnessed a stunning surge, resulting in a staggering $100 billion addition to its total market capitalization within a single day. This rapid ascent also triggered a wave of liquidations amounting to over $400 million, with shorts accounting for a significant portion of the losses. 

With BTC experiencing a 12% price increase, this led to the liquidation of more than $180 million in short positions out of a total of $222 million in BTC liquidations. 

Ethereum (ETH) traders also saw a significant loss of $60 million, with $44 million coming from those anticipating a price drop, according to data from CoinGlass.

Most of these liquidations, totaling $317 million, occurred within the last 12 hours, with short sellers accounting for a substantial 76% ($241 million) of the total losses. 

Concurrently, trading volumes for the top three cryptocurrencies on the derivatives market witnessed significant growth. 

Bitcoin’s volume experienced a remarkable 221% surge, while Ethereum and XRP saw a 108% increase in trading activity. As a result, approximately 95,000 traders faced liquidation during this period of intense market volatility.

Scott Melker, an investor and host of a cryptocurrency podcast, commented on the situation, stating:

Bitcoin bears have been left reeling as the market witnessed an extraordinary rally, resulting in massive liquidations of short positions. This surge has caught many traders off guard, leading to substantial losses in a short period.

Bitcoin

Featured image from Shutterstock, chart from TradingView.com 

Time To Cash Out? Bitcoin’s 4-Hour RSI Triggers Sell Indicator

Bitcoin (BTC) has retraced to the $28,400 level following a failed breakout above $30,000, resulting in a high rate of liquidations for both long and short positions. 

Additionally, the recent fake news surrounding the approval of Blackrock’s spot Bitcoin Exchange-Traded Fund (ETF) by the US Securities and Exchange Commission has disrupted the upward trend and introduced new bearish indicators in the Bitcoin market.

RSI Screams Sell

Renowned trader and crypto analyst Ali Martinez suggests selling BTC based on its 4-hour chart Relative Strength Index (RSI) indicator. His simple trading strategy advises selling BTC when the RSI exceeds 74.21 and buying when the RSI dips below 30.35.

Bitcoin

As seen in the chart above, BTC’s RSI stands at the 74 level, which is notably high considering that on October 16, after the spread of the fake news on various platforms, including X (Formerly Twitter), the RSI reached as high as 82.83.

While this indicator may seem straightforward, it has proven effective on BTC’s 4-hour chart. For instance, on October 1st, Bitcoin peaked at $28,500, but after the RSI climbed above 80, the leading cryptocurrency swiftly dropped to $27,150 within hours.

Although the effectiveness of these indicators is not always guaranteed, the combination of the recent false pump, the ongoing retrace evident in all BTC charts, the lack of bullish momentum, and the prevailing market sentiment of fear, doubt, and uncertainty could create the perfect storm for BTC to retest lower support levels before potentially embarking on another upward movement.

Bitcoin Pre-Halving Retracements Sound Alarm Bells

To further support Ali Martinez’s bearish thesis, renowned crypto analyst Rekt Capital recently shed light on Bitcoin’s historical retracements approximately 180 days before halving events

According to Rekt, in 2015/2016, approximately 180 days before the halving, Bitcoin experienced a retracement of -25%. Similarly, in 2019, around the same timeframe before the halving, Bitcoin retraced by -38%. 

While Rekt Capital identifies as a macro bull, he acknowledges that historical data favors bearish trends before halving events. 

This observation raises the question of whether history will repeat itself in 2023. Will Bitcoin witness a significant retracement similar to previous cycles, or will the market dynamics 2023 deviate from historical patterns?

What is certain is that as the crypto community eagerly anticipates the 2023 halving, uncertainty looms regarding Bitcoin’s price behavior leading up to the event.

Bitcoin

As of the current market conditions, BTC is trading at $28,400, indicating a profitable position across all time frames. In the past 24 hours, Bitcoin has experienced a modest increase of 1%.

Over the seven, fourteen, and thirty-day periods, BTC has recorded profits of 3.7%, 4%, and 7%, respectively, despite the earlier bearish factors. The sustainability of Bitcoin’s current price level remains uncertain, as it remains to be seen whether it will withstand potential retracements soon.

Featured image from Shutterstock, chart from TradingView.com 

Bitcoin Price Rally On The Horizon? BTC Spot ETFs May Get The Green Light Today

In what could be a pivotal day for the Bitcoin price, the last day for the US Securities and Exchange Commission (SEC) to appeal the Grayscale Bitcoin (BTC) spot Exchange-Traded Funds (ETF) decision is approaching, and the crypto community is eagerly awaiting the outcome.

The implications of this decision are significant, as it could pave the way for the approval of several other spot Bitcoin ETFs

Impending Approval Of All Proposed Bitcoin Spot ETFs? 

According to crypto YouTuber Crypto Rover, if the SEC does not appeal the court’s ruling by the end of the day, it would potentially lose its ability to deny future applications, resulting in the likely approval of all proposed spot ETFs.

The current list of applicants seeking approval includes prominent names such as Grayscale Bitcoin Trust, Ark/21 Shares Bitcoin Trust, Bitwise Bitcoin ETF Trust, BlackRock Bitcoin ETF Trust, VanEck Bitcoin Trust, WisdomTree Bitcoin Trust, Valkyrie Bitcoin Fund, Invesco Galaxy Bitcoin ETF, and Fidelity Wise Origin Bitcoin Trust.

If all Bitcoin spot ETFs are approved, the move would mark a significant milestone in the mainstream adoption of cryptocurrencies. 

Accepting these financial instruments would provide investors with a regulated and easily accessible avenue to gain exposure to Bitcoin’s price movements without directly owning the underlying asset. 

The approval would also vote for confidence in the cryptocurrency market, attracting institutional investors and potentially injecting fresh capital into the space.

The approval of Bitcoin spot ETFs also can ignite a renewed sense of optimism and investor sentiment. The anticipation of such a development has already fueled speculation of a Bitcoin rally, with market participants eyeing a new annual high. 

The thawing of the crypto winter and the approval of these ETFs could create a perfect storm for a Bitcoin price to surge, potentially breaching the $30,000 mark and beyond.

Bitcoin Price Awaiting ETF Relief

The largest cryptocurrency in the market is striving to reclaim the crucial $27,000 level, trading at $26,700. This level holds significant importance for bullish investors as it represents a key threshold to break the mid-term downtrend structure observed in BTC’s 1-day chart since its yearly high of $31,800 on July 13

Bitcoin price

Additionally, the failure of the Bitcoin price to hold its 200-day (yellow line) and 50-day (brown line) moving averages (MAs) as support lines is a cause for concern among bullish traders. These MAs, similar to the situation in March 2023, are currently converging.

However, the potential approval of a BTC spot ETF could provide much-needed relief to Bitcoin’s price. Forming a complete rally would require overcoming various resistance levels in such a scenario.

In the short term, Bitcoin’s price will likely face a significant obstacle at the $27,900 level, which was briefly surpassed on October 2nd. Furthermore, BTC encounters a 3-month resistance at $28,700, marking the final hurdle before reaching the $30,000 level, serving as another resistance line.

Nevertheless, the community anxiously awaits the approval of BTC spot ETFs, hoping that it will bring a sense of relief and bullish momentum for investors and Bitcoin’s price. 

Featured image from Shutterstock, chart from TradingView.com 

Bitcoin Rejects Downside At $29k, Here’s Why This Is Good

Today’s Bitcoin price analysis is positive, as a dip to $29,000 was met with solid support and rejection, indicating that additional downside is unlikely. As a result, BTC/USD is expected to rise further in the next days, most likely above the $31,000 resistance level.

Naturally, the psychological price of $30,000 for Bitcoin implies a solid purchase zone. We’ll look at why Bitcoin’s recent consolidation around $30,000 is a promising sign of future price increases.

Bitcoin Fall 57% From ATH

Bitcoin prices have fallen from a high of $69,600 to a current level of $29,350. The entire cryptocurrency market was destroyed by this 57 percent price decrease. As a result of the decreasing prices, a snowball effect began to occur, causing other crypto projects to be hit and sink even more.

The price range of $30,000 for Bitcoin is critical. Many large corporations bought Bitcoins at that price. Furthermore, as shown in Figure 2, Bitcoin prices historically consolidated around those precise positions before beginning an advance.

BTC/USD 1-day chart showing the consolidation area. Source: TradingView

For more than a week, bitcoin has been trading sideways, with the $31,000 mark acting as solid resistance. Meanwhile, significant support has been established at $29,000, signaling a clear consolidation region that must be overcome before the market can continue to develop.

The previous high was set at the same level as the previous low, signaling market hesitation. As a result, the recent $29,000 test could lead to another retest of the resistance.

Related Reading | Eight Consecutive Red Closes: Is Bitcoin Headed For A Recovery?

Will Consolidation occur?

If BTC prices happen to drop below $28,000 again, the next support area would be around $20,000. However, it is more likely that prices will increase from this Bitcoin price consolidation phase. The first target is around $35,000, or a 17% increase in prices. After that, prices should target the next psychological price of $40,000. From there, we might see a slight adjustment lower, but in the long term, prices should break higher. This would mark the official start of the uptrend.

In order for bitcoin’s price to establish a foothold at the bottom in the short term, according to Josh Olszewicz, head of research at investment management Valkyrie, volatility must reduce.

“We can look at things like the 200-week moving average, which is around $22,000. We can look at realized price, which is the average price of coins that have moved on-chain, which is around $23,800,” Olszewicz said on CoinDesk TV’s “First Mover” program. “This [movement to hit bottom] will probably take at least all of Q3, perhaps Q4 as well, if it were to happen this year.”

Other variables, like as the US Federal Reserve boosting interest rates, are also influencing bitcoin’s market performance, according to Olszewicz.

He speculated that institutional investors may be in the forefront of the downturn. The average size of on-chain transactions, according to Olszewicz, is in the tens of thousands of BTC.

Nonetheless, according to Olszewicz, ordinary traders continue to influence market movement more than institutional investors. Those learning about cryptocurrencies are now jumping in during this bear market to “test the waters” and “see if they can survive,” according to him.

Suggested Reading | Ripple (XRP) Plunges To $0.43 With Bears In Full Swing

Featured image from iStock photo, chart from TradingView.com