Bitcoin Hits $52,000 High: Are These Giant Sell-Offs About To Crash The Crypto Party?

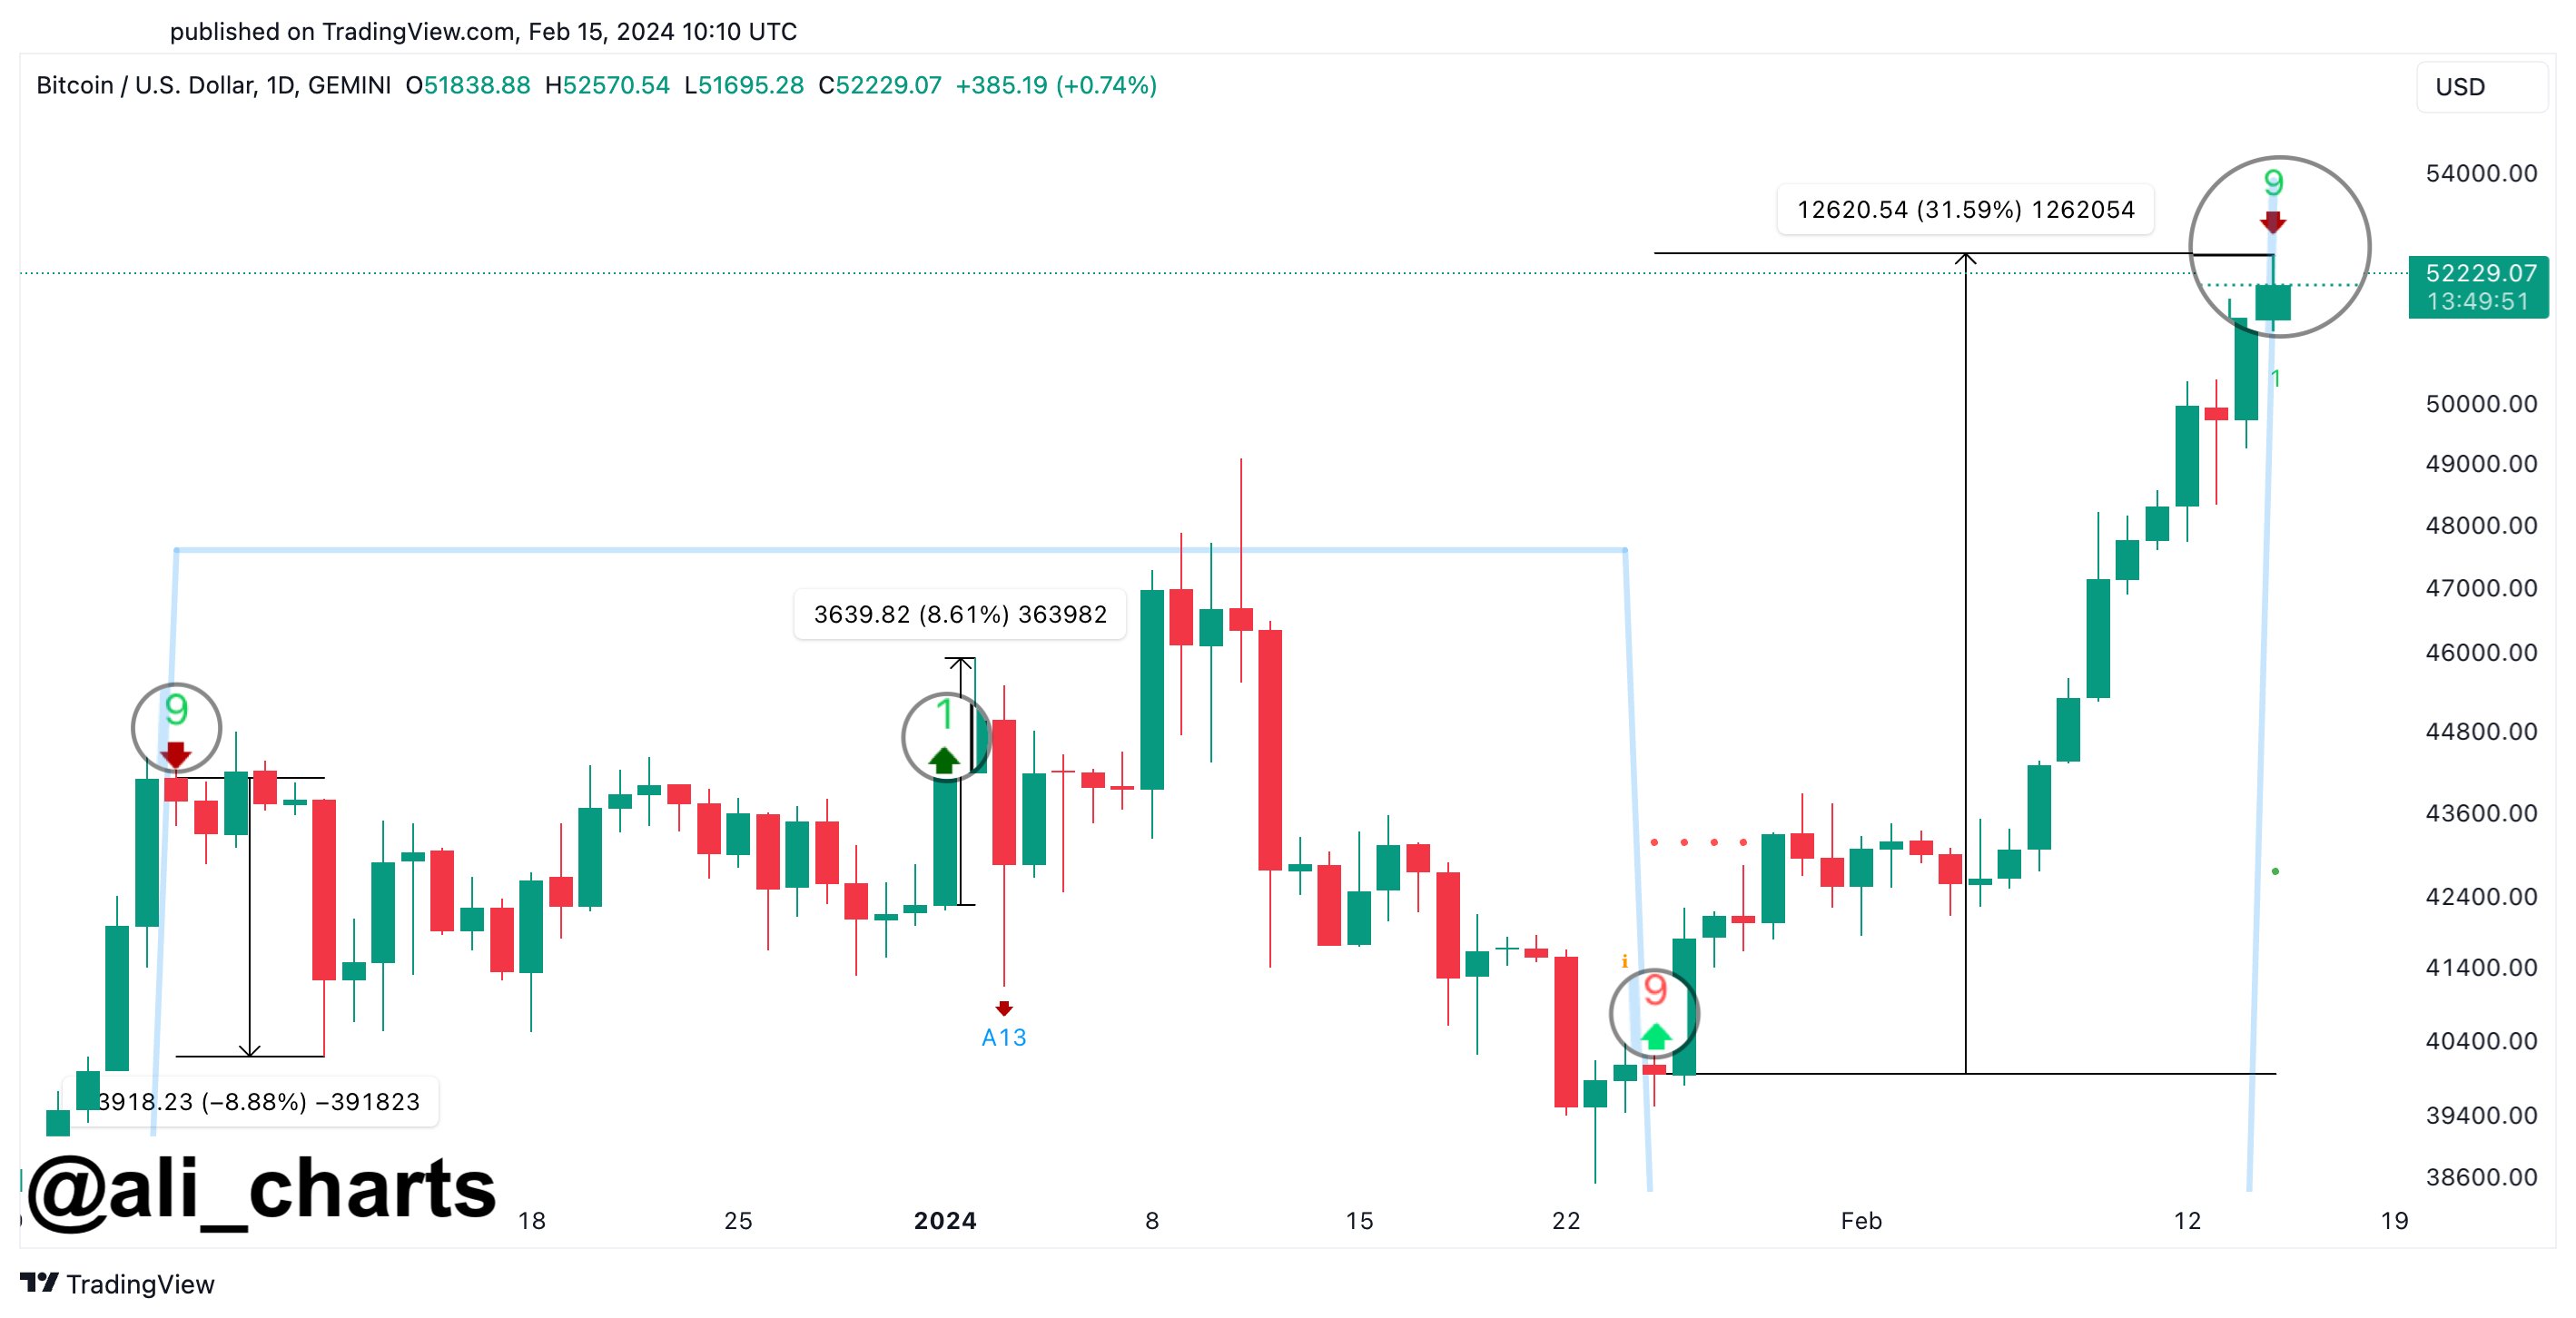
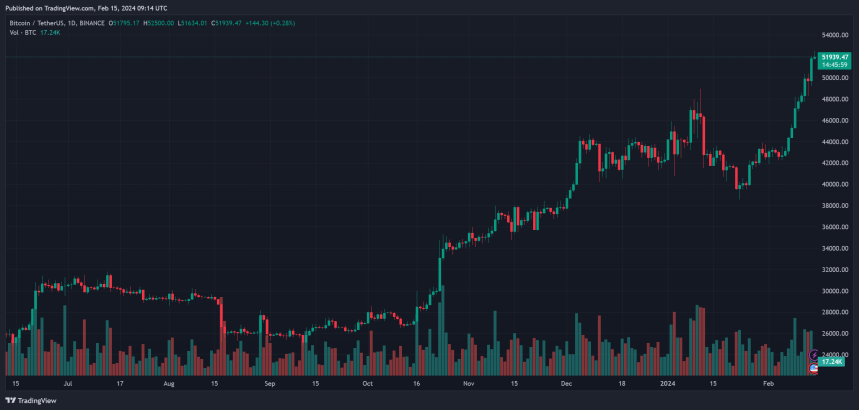
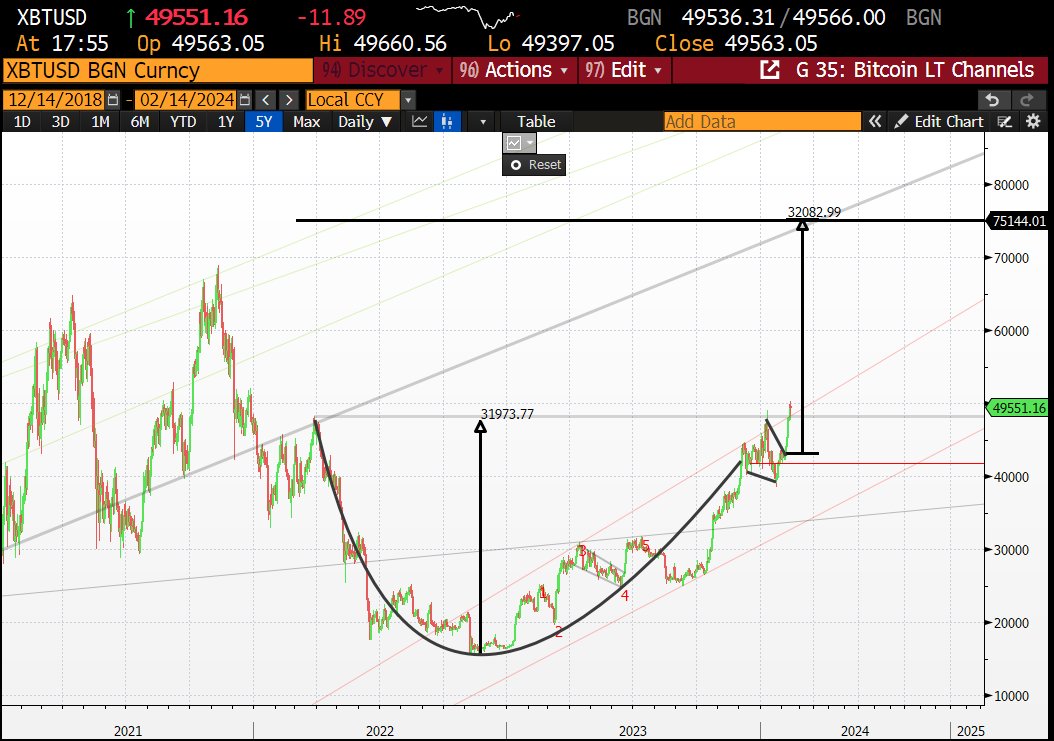
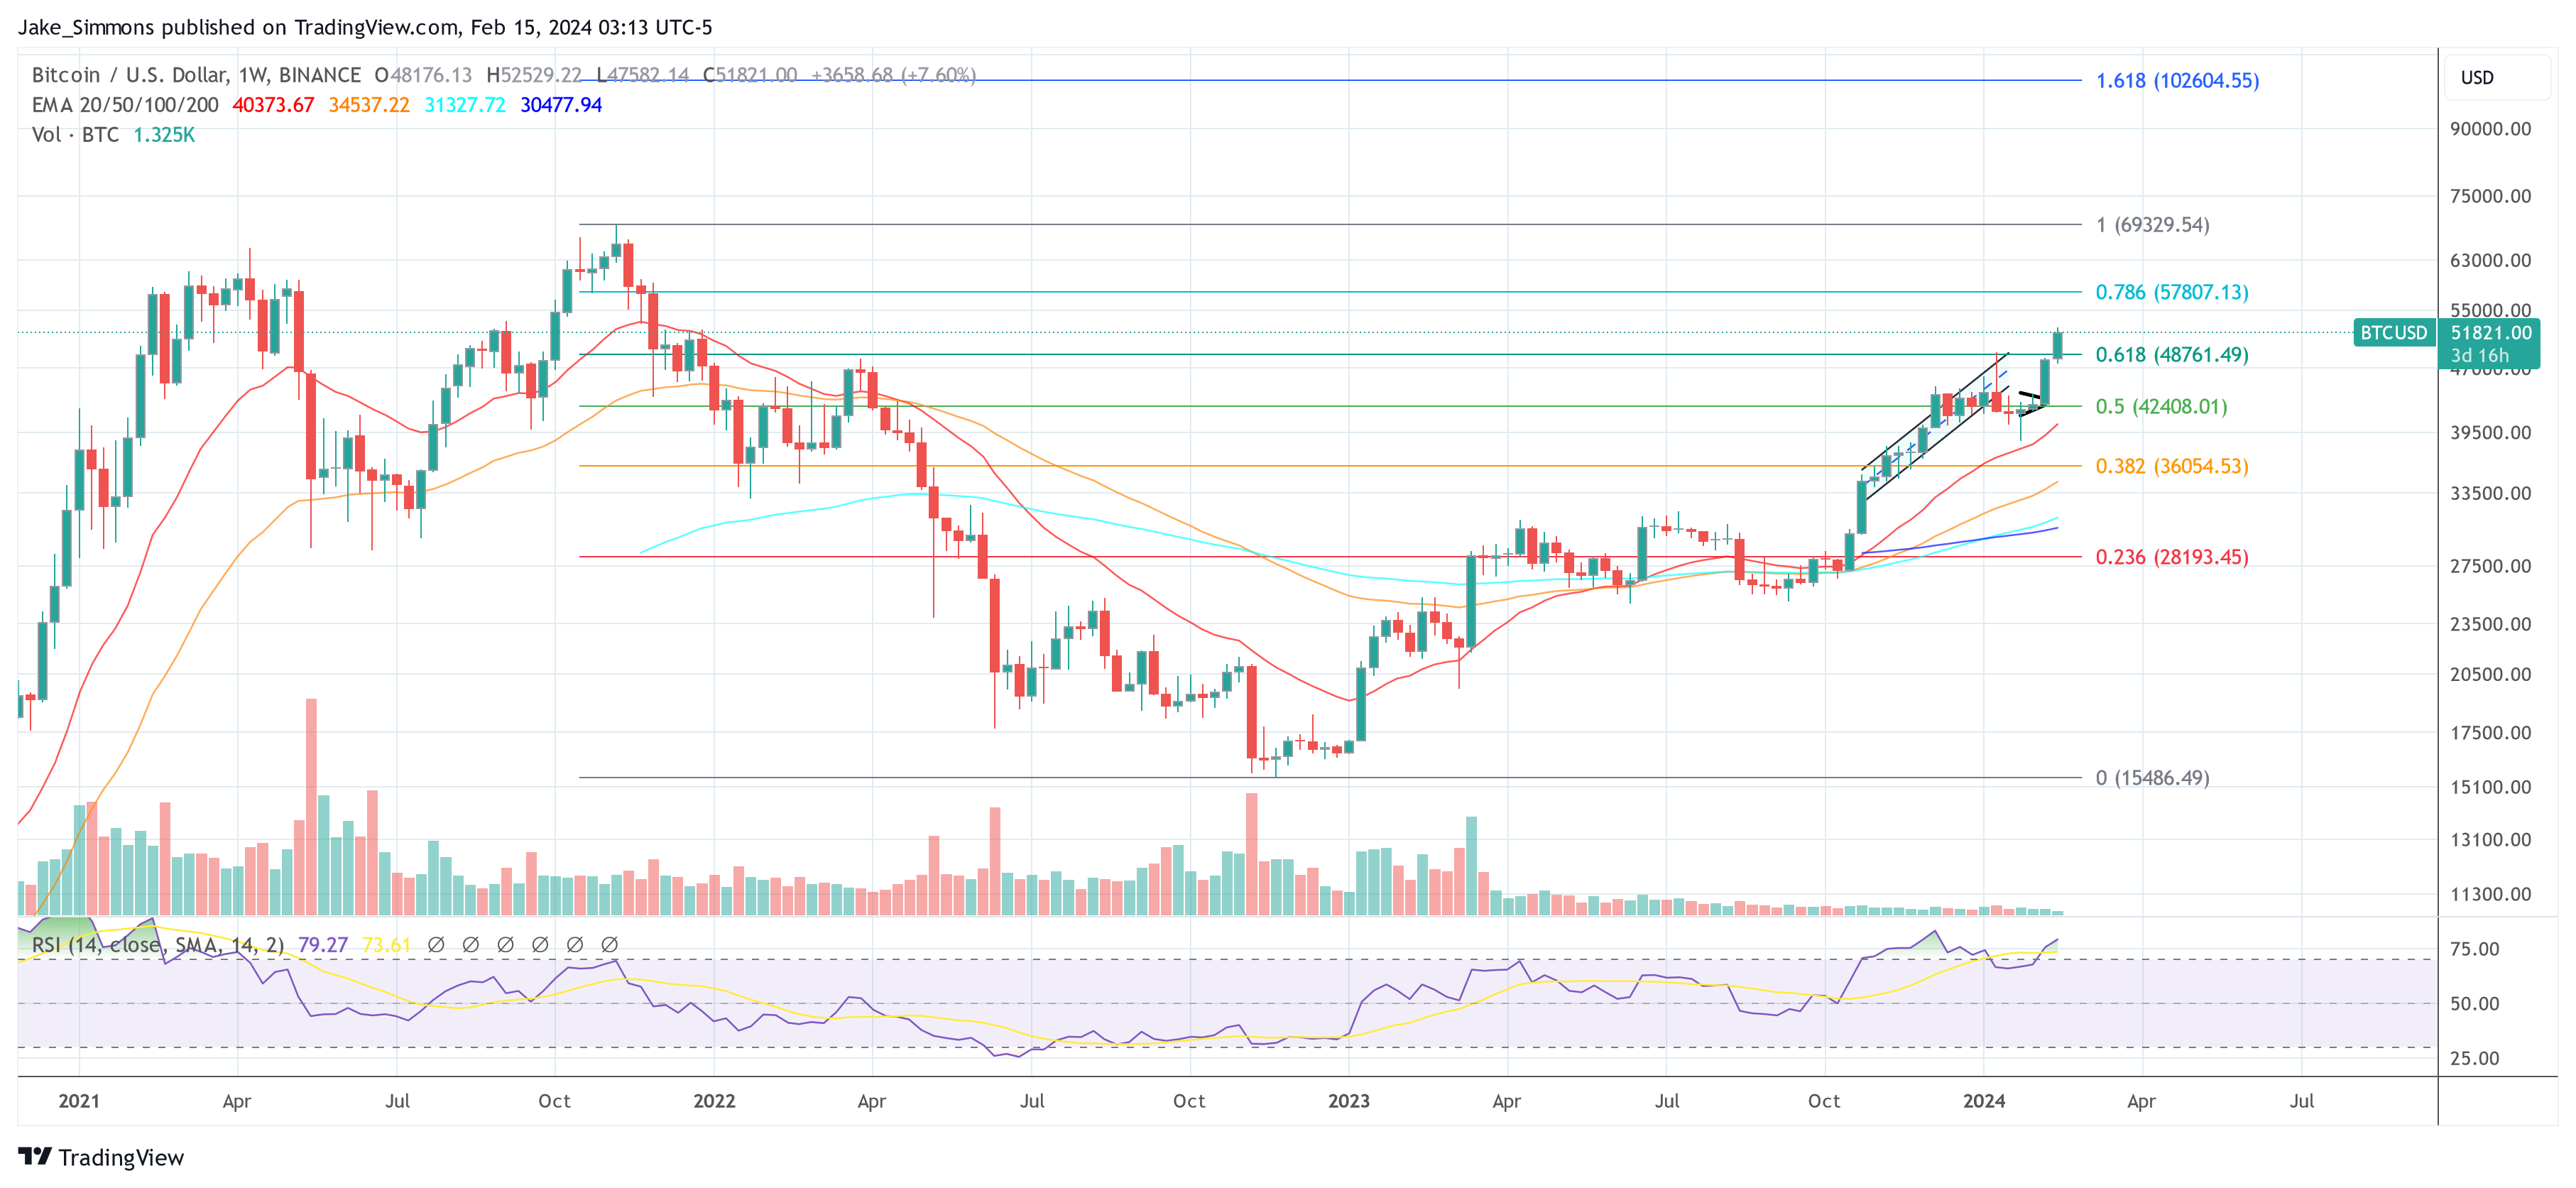
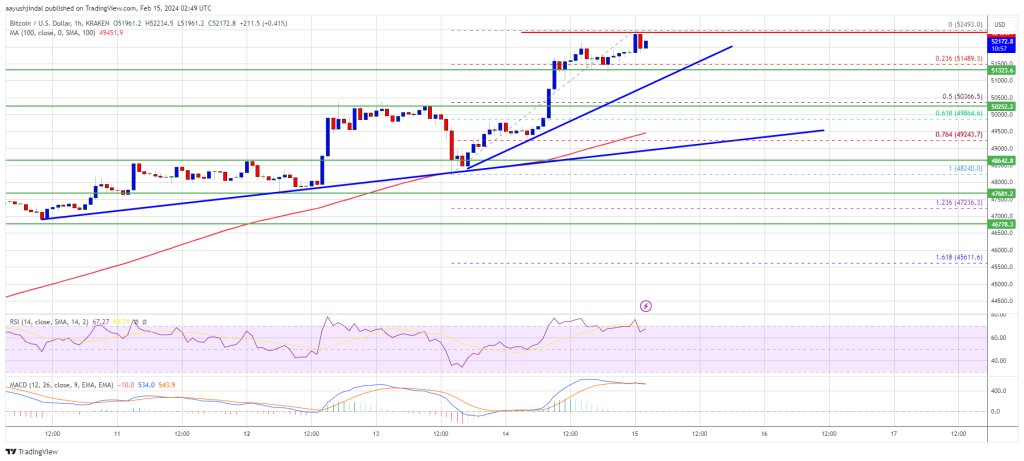
According to a recent report from Spot On Chain, Bitcoin might be on the edge of a notable plunge. So far, the flagship cryptocurrency has recently broken through the $52,000 mark and traded above it for the first time since December 2021.

However, Spot On Chain reveals that Bitcoin faces potential challenges that could affect its immediate market performance. Two significant sell-off events loom on the horizon, potentially influencing Bitcoin’s price dynamics in the short term.

These developments have sparked speculation, prompting a closer examination of their possible impacts on the cryptocurrency market.

Major Bitcoin Sell-Off Events On The Horizon

The first of these events involves Genesis, a prominent crypto asset manager authorized to offload a significant portion of its Grayscale Bitcoin Trust (GBTC) shares. The second event is marked by the US government’s announcement to sell some of its Bitcoin holdings acquired from the Silk Road platform.

Genesis has received approval to sell 35 million GBTC shares, estimated to be worth around $1.3 billion. This occurrence mirrors an earlier liquidation event involving FTX, which notably impacted Bitcoin’s market price, illustrating the potential volatility such moves can introduce.

It is worth noting that the upcoming Genesis sell-off represents a significant moment for Bitcoin, as it tests the resilience of its recent price gains against the backdrop of large-scale disposals.

The US government’s decision to auction off 2,875 BTC, valued at $150.6 million, adds to the market’s cautious outlook. With the government holding one of the largest Bitcoin reserves globally, its actions have a marked influence on market perceptions and the cryptocurrency’s price stability.

Spot On Chain highlighted historical instances, such as the sale of 8.2K BTC through Coinbase, which have shown that government sell-offs can temporarily lead to fluctuations in Bitcoin’s price.

Bitcoin (BTC) price chart on TradingView.

Optimism Amid Uncertainty

Despite these concerns, certain segments of the crypto community view these events as minor hurdles in the broader trajectory of Bitcoin’s growth.

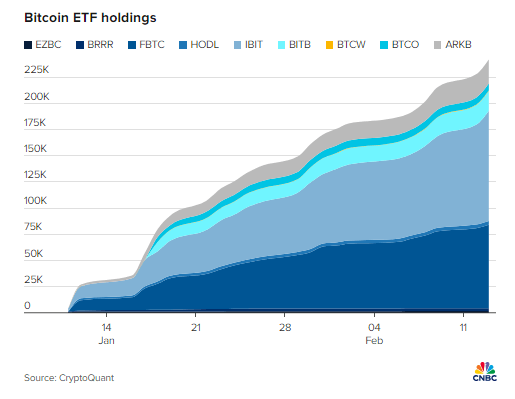
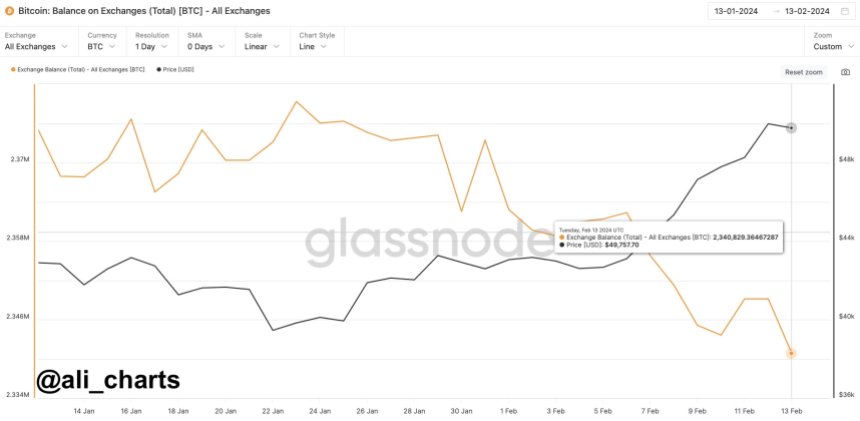
Notably, the increasing involvement of Bitcoin spot exchange-traded funds (ETFs) in the Bitcoin market suggests a growing institutional interest that could offset the effects of the sell-offs.

CryptoQuant has recently highlighted that roughly 75% of new investments into Bitcoin are coming from spot ETFs. This is quite evident as BitMex research reported that the Bitcoin spot ETF market saw an inflow of over $340 million yesterday.

Featured image from Unsplash, Chart from TradingView

Bitcoin Signal That Has Held Since December Says It’s Time To Sell

An analyst has explained that an indicator that has been holding for Bitcoin since December is now giving a sell signal for the cryptocurrency.

TD Sequential Is Providing A Sell Signal On Daily Bitcoin Chart Currently

In a new post on X, analyst Ali discussed a TD Sequential sell signal forming in the Bitcoin daily price chart. The “Tom Demark (TD) Sequential” is an indicator in technical analysis used for pinpointing locations of probable tops and bottoms in any asset’s price.

The TD Sequential has two phases. The first is called the “setup” and lasts nine candles. Once nine candles (of the same polarity) are in, the setup completes, and the indicator signals a likely reversal for the price.

The direction of such a reversal naturally depends on the type of candles that formed the setup. If these candles were green, the indicator would imply a top for the asset, while red candles would suggest a bottom.

When the setup finishes, the “countdown” phase begins. In this phase, candles of the same type are counted again, except for thirteen. Once the countdown also completes, another potential reversal could be assumed to have occurred for the price.

Recently, Bitcoin has finished a TD Sequential phase of the former type. Here is the chart shared by the analyst that shows this pattern forming in the daily price of the cryptocurrency:

Bitcoin Sell Signal

As is visible in the graph, the TD Sequential setup has recently finished with green candles for Bitcoin. These green candles have come for the coin as it has enjoyed some sharp bullish momentum, which has taken its price beyond the $52,000 mark.

The fact that the TD Sequential setup has formed with green candles suggests the indicator may now be providing a sell signal for the cryptocurrency’s price.

In the same chart, Ali highlighted the previous instances since December of last year where a setup was completed for the asset. It would appear that both TD Sequential buy and sell signals have held for the coin in this window.

Going by this pattern, the latest TD Sequential reversal signal might also hold for the asset. And as it’s a bearish one this time, the analyst expects a correction lasting for one to four daily candlesticks.

BTC Price

Bitcoin’s recent momentum has meant that the asset has been among the best performers in the sector, registering growth of around 16% during the past week.

Currently, the coin is hovering around the $52,500 level. The chart below shows the asset’s trajectory over the last month.

Bitcoin Price Chart

Bitcoin’s Rise To $52,000 Masks Potential Pitfalls Ahead, Analyst Warns

Crypto analyst Justin Bennett has laid out a bearish narrative for the flagship crypto token Bitcoin. Based on his analysis, Bitcoin will likely drop below the $50,000 level again before it moves further to the upside. 

Bitcoin Could Drop Back To As Low As $47,000

In an X (formerly Twitter) post, Bennett mentioned that the price range between $47,000 and $49,000 “is the land in the sand” for Bitcoin. This statement came from his belief that the crypto token will soon see a price retracement. He also reminded his followers of how “Bitcoin carves significant tops.”

The crypto analyst suggested that $52,000 was a ‘significant top’ and that a price correction could be imminent. Bennett added that his prediction could be invalidated if BTC saw a sustained break above $53,500. Meanwhile, he also compared Bitcoin and US stocks, stating that there was an ongoing correlation between them.  

Bennett also disagrees that Bitcoin’s rally could be longer this cycle, especially considering the demand that the Spot BTC ETFs are seeing. He stated his indifference about these funds and mocked how everyone predicted they would send Bitcoin to a potential all-time high (ATH). 

From a technical analysis perspective, the crypto analyst was more concerned about BTC’s price action and remarked that “the chart will tell the story.”

BTC Fundamentals Are Getting Stronger

While Bennett predicts that Bitcoin will drop soon enough, it is worth mentioning that the crypto token’s fundamentals are getting stronger, which could also dictate its price action. Citing data from Glassnode, crypto analyst Ali Martinez recently revealed that the amount of BTC held in known crypto exchange wallets has dropped to its lowest in six years.

As highlighted by Martinez, this suggests that the market sentiment around the flagship crypto is changing, with most investors looking to hold for the long term.

That is considered a positive development and bullish for Bitcoin’s price since the amount of BTC that can be acquired is further reduced, creating some form of scarcity. 

The crypto analyst had also recently mentioned how Bitcoin holders are currently in a phase of belief, which signals potential further gains ahead for BTC. 

According to CoinMarketCap data, Bitcoin is trading at around $51,900 at the time of writing, up over 2% in the last 24 hours.

bitcoin price btc btcusdt

Chart from Tradingview

Bitcoin ETF Surges: Last 4 Days Inflows Outpace Initial Weeks

Bitcoin (BTC) Spot Exchange-Traded Funds (ETFs) are currently in the limelight as the products have seen massive net inflows in the past few days than in the initial weeks of introduction, dominating the market of crypto investment products.

Bitcoin ETF Inflows Surges In The Last 4 Days

Thomas Fahrer, the co-founder of Bitcoin tracking platform Apollo, took to the social media platform X (formerly Twitter) to share the development with the community. Fahrer pointed out that BTC spot ETFs are presently experiencing a “total acceleration” of inflows.

Meanwhile, the products in the past 4 days have witnessed an inflow of 43,000 BTC tokens valued at $2.3 billion. This latest surge in inflows suggests renewed adoption of the products from crypto players and investors.

Data from Apollo reveals that Grayscale is the leading firm in Assets Under Management (AUM). Registered as Grayscale Bitcoin Trust (GBTC), the company boasts a whopping $23.7 billion AUM.

However, this is a notable drop from $28 billion in assets it had on January 11, after transitioning to an ETF. This is due to the daily net outflows the fund has seen since it was approved by the US Securities and Exchange Commission (SEC).

Blackrock comes in second after Grayscale, with an asset under management of over $5 billion since it started trading. It is followed by Wise Origin Bitcoin Trust (FBTC) and Ark/21Shares Bitcoin Trust (ARKB), which come in third and fourth place, respectively.

Investment firm Bitwise’s Bitcoin ETF (BITB) is the latest company to reach the billion-dollar milestone. As of the press, the company’s BTC ETF is the fifth largest behind the aforementioned asset management companies.

Blackrock Records Its Largest Inflow

On Tuesday, Blackrock recorded its largest inflow day ever since Bitcoin ET products were approved. A senior Bloomberg Intelligence analyst, Eric Balchunas, revealed information regarding the update on X.

He stated that Blackrock’s BTC ETF was booming on Tuesday, seeing almost “half a billion” inflow. According to the data shared by Balchunas, IBIT made $493 million in revenue during the trading day.

IBIT’s previous largest daily net inflow was $386 million, recorded on the second trading day of January 12. Consequently, Blackrock’s Bitcoin ETF overall inflow exceeded the $5 billion mark after the Tuesday event. So far, of all ETFs, Blackrock’s IBIT leads by “7% by size in just 23 days of trading.”

These developments came in light of the recent rally around Bitcoin in the past few days, which took BTC’s price above $ 50,000. Many market enthusiasts believe that a major factor in the rally is the reason surrounding the BTC ETF flows.

Bitcoin

$52,000 And Climbing: Bitcoin Eyes New Highs This March, Predicts Top Firm

Bitcoin has been on an absolute tear, surpassing $52,000 for the first time since December 2021. The leading digital asset has already climbed over 23% in 2024, and a major driver of this meteoric rise has been the influx of institutional money entering the space through spot Bitcoin ETFs. 

Bitcoin’s mainstream credibility among traditional investors has been growing since the beginning of February, with ETFs registering between $400 million and $650 million in daily inflows in the past week. At the same time, BTC call options have seen a massive rise. 

This bullish sentiment has prompted investors to begin anticipating the moment when BTC would achieve a new all-time high. According to analysts at QCP Capital, a crypto asset trading firm, Bitcoin is set to reach a new all-time high before the end of March 2024.

Top Firm Predicts Bitcoin Can Reach New All-Time High Before April

Bitcoin’s current all-time high of $69,044 has looked like an insurmountable mountain for the past two years, especially during the prolonged bear market in 2022, which saw BTC trading below $17,000. However, things have changed since that time, and current metrics point to the price of Bitcoin blasting past this price point in the coming months. 

This change in sentiment can mainly be attributed to the attention around spot Bitcoin ETFs. Although Bitcoin seemed to struggle behind a sell-the-news event for weeks after these ETFs hit the market, the situation has since turned positive.

According to data from BitMEX Research, Bitcoin ETFs have witnessed massive inflows led by BlackRock’s ETFs in the past week. At the same time, outflows from Grayscale’s GBTC have slowed down. Consequently, the ETFs have received a steady $400 million to $650 million in daily inflows, which works out to 8,000 to 12,000 BTC bought daily. 

Notably, trading hit historic highs on February 14th, with the top nine ETFs hitting $1.5 billion in trading volume.

What’s Driving The BTC Price Rally?

QCP Capital credits this increasing institutional investment in Bitcoin as a critical driver of future growth. Analysts expect this inflow to continue as BTC becomes increasingly popular among traditional investors and global liquidity rotates into the spot ETFs, allowing it to break past its all-time high before April. 

The analysts also looked at the massive purchases of BTC call options, noting how $10 million was spent in the past week on premiums for $60,000 to $80,000 strikes expiring from April to December. This price point is exciting, as it indicates many investors are already looking forward to Bitcoin breaking past $69,000 in the coming months. 

bitcoin price btc btcusdt

Predictions can be hit or miss, but Bitcoin seems poised to continue its meteoric rise in value. It’s also important to note that the next Bitcoin halving, slated for April 2024, is steadily approaching. 

Cover image from Dall-E, Chart from Tradingview

Stacks (STX) Stuns: Price Soars Over 60% In Epic Recovery As TVL Explodes

Stacks (STX), a cryptocurrency facilitating smart contracts on the Bitcoin blockchain, has defied broader market turbulence to emerge as a standout performer. Over the past week, STX price skyrocketed over 60%, reaching a nine-day high of $2.15 and flirting with its all-time peak of $2.45. This impressive rally has propelled Stacks into the top 25 cryptocurrencies by market cap, leaving many wondering: what’s driving the surge?

Stacks (STX) Climbs Over 60% On Back Of Bitcoin Ascent

Several factors appear to be fueling Stacks’ ascent. Firstly, its unique ability to bring smart contract functionality to Bitcoin resonates with investors seeking advanced applications on the world’s oldest blockchain. Unlike Ethereum, Bitcoin inherently lacks support for smart contracts, limiting its DeFi and NFT capabilities.

Stacks bridges this gap by anchoring itself to Bitcoin while offering smart contract features. This innovative approach has garnered significant attention, particularly as Bitcoin itself enjoys a recent price appreciation, reaching more than $52,000 at the time of writing.

The correlation between Stacks and Bitcoin is undeniable. Both assets saw pronounced recoveries in February’s second week, with STX mirroring Bitcoin’s climb from $38,500 to $50,000. This intertwined fate highlights the influence of Bitcoin’s broader sentiment on Stacks’ price action.

STX Gets Boost On Soaring TVL

Beyond price movements, another bullish indicator emerges from Stacks’ DeFi ecosystem. According to DefiLlama, the total value locked (TVL) within Stacks’ DeFi protocols has surged over 50% in the last three weeks, reaching $70.21 million. This growth signifies rising investor confidence and active capital commitment within the Stacks DeFi landscape.

Technical analysis further amplifies the optimistic outlook. Analysts predict a potential continuation of the rally, with price targets ranging from $2.475 to $2.82. This bullish forecast hinges on STX breaching the recent swing high resistance of $2.06, a decisive technical milestone achieved earlier this week.

However, it’s crucial to acknowledge the inherent volatility of the cryptocurrency market. Recent US inflation data triggered a sell-off across the entire market, reminding investors of the unpredictable nature of this asset class. While Stacks managed to recover rapidly, the episode underscores the importance of responsible investment practices and thorough risk assessment.

Despite the risks, Stacks’ unique value proposition and recent momentum cannot be ignored. Its ability to connect the smart contract functionality of Ethereum with the security and immutability of Bitcoin positions it as a potentially disruptive force in the blockchain space.

Featured image from Pexels, chart from TradingView

Bitcoin Price Rally To $75,000 Imminent Due To Massive Cup And Handle Pattern

Matt Dines, the Chief Investment Officer at Build Asset Management, has identified a classical ‘Cup and Handle’ pattern in the Bitcoin (BTC) price chart, which he believes could signal an impending rally to $75,000. This technical formation is often considered a strong bullish signal and is closely watched by market analysts and traders.

Bitcoin Price Validates Cup And Handle Pattern

The ‘Cup’ part of the pattern, resembling a bowl or rounding bottom, began forming in March 2022 when the price plunged below $48,000 and entered one of the longest Bitcoin bear markets. The pattern reached its lowest point at approximately $17,600, signifying a strong support level for Bitcoin.

Bitcoin price cup and handle

The left side of the pattern shows a rounded bottom resembling a “cup.” It forms when the price initially declines, then consolidates, and finally starts to rise again. Since hitting this bottom, Bitcoin’s price has made a steady recovery, mimicking the right side of the cup, indicating a bullish reversal of the previous downtrend.

“The saucer or the ‘cup’ signifies a consolidation period, a pause in the downward trend, before the price begins to rise back up to the test resistance levels,” Dines explained. The recovery to the initial resistance line completes the ‘cup’ portion of the pattern. The Bitcoin price completed this step in early January this year.

The subsequent ‘Handle’ is represented by a moderate retracement following the recovery, which forms a small dip or pullback from the peak. This handle is identified by a slight downward trajectory and is considered the final consolidation before a breakout.

BTC’s price drop to $38,600 at the end of January marked the bottom of the pullback. With the breakout above $48,000, the Bitcoin price validated the cup and handle pattern.

Setting A BTC Price Target

Dines also addressed the placement of the vertical projection from the bottom of the handle, clarifying its basis: “It’s totally arbitrary and in the eye of the beholder. But longer answer, traders are eyeing charts for formations.”

The vertical target line, or the ‘stick’ on the right, is projected from the bottom of the handle. The height of the cup — from the low at around $17,600 to the resistance line at $48,000— sets the stage for the price target.

Dines added, “A lot of traders will use the height of the bowl (from the low of the bowl to the top at the resistance line) to set their price target. Just add that height to the bottom of the handle … that’s a decent guesstimate for where we’d see the longs who entered on the breakthrough to set their price target.”

Based on the chart, the height from the cup’s low to the resistance level is roughly $31,973, marking the increase in Bitcoin’s price from its lowest point to the current level when the chart was produced. Projecting this height from the handle’s formation suggests a target in the vicinity of $75,000.

Dines further adds that the collective behavior of market participants will indeed guide the price movement: ” A lot of those longs would set a retrace at ~$75k as they close out their W. If enough participants put this trade on it will set the dominant price action … they win out and it will turn the chart into reality. I know it sounds ridiculous, but in the real world this is how markets actually discover price.”

At press time, BTC traded at $51,821.

Bitcoin price

Bitcoin Hits $52,000-Plus, Explodes Over 21% For 2024 – Details

Bitcoin bulls are back in charge, with the world’s leading cryptocurrency surging past $52,000 on Wednesday following a long hiatus.

This rally comes on the heels of a brief dip below $50,000 triggered by hotter-than-expected US inflation data, but investors shrugged it off, demonstrating resilient confidence in the digital asset’s future. Bitcoin is up more than 21% so far this year.

Bitcoin Shows Mettle With $52K Breach

This latest surge marks a significant milestone, not just for Bitcoin but for the entire cryptocurrency ecosystem. After 26 months, the top crypto asset has officially surpassed the coveted $1 trillion market cap, a testament to its growing adoption and mainstream appeal.

But what’s driving this renewed optimism? Several factors seem to be fueling the flames. Firstly, there’s the bullish sentiment surrounding Bitcoin, with many analysts and traders anticipating further price gains. Options traders are particularly optimistic, placing bets that one BTC could reach $75,000 in the coming months, adding fuel to the fire.

Secondly, the recent launch of spot exchange-traded funds (ETFs) in the US has played a significant role. These ETFs allow investors to gain exposure to Bitcoin without directly holding it, attracting institutional investors and driving significant inflows.

Nearly $10 Billion Flows Into The Crypto Market

Data from CryptoQuant reveals that a staggering $9.5 billion has poured into the Bitcoin market through these ETFs since their debut in January. In fact, over 70% of new money invested in Bitcoin in the past two weeks has originated from these spot ETFs, highlighting their growing impact.

Looking ahead, the upcoming halving event in April looms large. This programmed halving, occurring every four years, reduces the amount of new Bitcoin entering circulation, potentially impacting its price due to increased scarcity. Historically, Bitcoin has witnessed significant rallies following halving events, and many analysts believe this time will be no different.

“The upcoming halving will further tighten supply,” noted Duncan Ash, head of product go-to-market strategy at Coincover. “If history repeats itself, we can expect continued growth in BTC price in the months ahead.”

However, not everyone is singing an entirely bullish tune. While analysts at Swissblock agree that the uptrend is likely to continue, they caution against overexuberance, warning of potential slowing momentum and the inherent volatility of the market.

Ultimately, the future of Bitcoin remains uncertain, as with any cryptocurrency. However, this recent surge, driven by bullish sentiment, ETF inflows, and the upcoming halving, suggests that the bulls are firmly in control for now.

Featured image from Pexels, chart from TradingView

Bitcoin Price Alert: X Account’s Analysis Suggests Sub-$10K Drop – Here’s The Reasoning

Amid a significant Bitcoin price rally, reaching a new two-year high of $52,000, a renowned social media account known as WhaleWire has made a startling prediction.

The account, widely followed for its bold statements and news postings, has forecasted a staggering 99.99% chance of Bitcoin falling below $10,000, directly challenging the prevailing bullish sentiment.

 Clash Over Potential Bitcoin Price Crash

In a recent post on X (formerly Twitter), WhaleWire has voiced concerns about sustainability and alleged manipulation through fraud and price manipulation. The account accuses mainstream media and self-proclaimed Bitcoin enthusiasts, often referred to as “moon boy scammers,” of perpetuating an upward price narrative to allegedly serve their interests.

However, not everyone is convinced by WhaleWire’s claims. In response to the account’s recent prediction, a user on social media accused WhaleWire of being a liar, citing a previous forecast from August 2022 when the account asserted that Bitcoin would undoubtedly drop below $20,000. 

Ironically, Bitcoin did experience a decline below that threshold a few weeks later, lending some credibility to WhaleWire’s track record.

WhaleWire continues to express skepticism and calls out the so-called “Bitcoin maximalists” who exhibit excessive greed and euphoria. The account suggests that recent price movements, including Bitcoin briefly touching $50,000 amid concerns over Tether’s money printing, are deliberate maneuvers to trap bullish investors. 

WhaleWire claims that retail investors are now heavily invested in Bitcoin, anticipating further gains, only to be blindsided by a subsequent price rug-pull.

Doubling down on its conviction, WhaleWire has announced that it has increased its short positions, surpassing its $69,000 short. He believes that the ongoing rally will mark the top of what he refers to as the “echo bubble run”, which he originally predicted when Bitcoin was valued at $16,000.

Bullish Optimism Builds 

As the Bitcoin price continues its uptrend, a crypto analyst operating under the pseudonym “Mags” has taken to social media to share an optimistic outlook for Bitcoin. 

As per Mags’ analysis, Bitcoin is currently trading above the critical 0.618 Fibonacci retracement level on a weekly chart, a feat never achieved in previous cycles before the halving event.

Traditionally, the 0.618 level has proven to be a formidable resistance zone, acting as a significant hurdle on Bitcoin’s path to reaching its all-time high (ATH). Mags believes that if Bitcoin successfully closes above the 0.618 level, which is currently valued at $48,500, it could signify an unprecedented bullish breakthrough.

Adding further weight to the bullish sentiment is the analysis provided by Ali Martinez. Martinez highlights a noteworthy trend: the amount of Bitcoin held in known cryptocurrency exchange wallets has plummeted to its lowest level in six years, with a total of only 2.34 million BTC remaining.

Bitcoin price

This substantial decrease in Bitcoin holdings on exchanges suggests a growing inclination among investors to move their BTC into secure, long-term storage solutions. 

According to Martinez, this shift away from exchanges implies a potential shift towards a more “hodling-centric” approach, where investors aim to hold their Bitcoin for extended periods rather than actively trading it.

Amidst the divergence of opinions and conflicting perspectives from both bullish and bearish investors, the ultimate outcome remains uncertain. The Bitcoin price action, as the largest cryptocurrency in the market, continues its notable uptrend, challenging the bearish predictions put forth by WhaleWire and others.

As the debate rages on, time will reveal whether WhaleWire’s forecast proves accurate or if the current bullish momentum will persist, further solidifying Bitcoin’s position as a dominant force in the cryptocurrency market.

Bitcoin price

Currently, BTC is trading at $51,600, up 5.4% in the last 24 hours and over 18% in the last seven days.

Featured image from Shutterstock, chart from TradingView.com

Will Bitcoin Bulls Be Able to Hit $55K Barrier This Week?

Bitcoin price extended its increase above the $52,000 resistance. BTC is consolidating gains and might aim for more upsides toward the $55,000 resistance.

  • Bitcoin price remained in a bullish zone above the $51,000 and $51,200 levels.
  • The price is trading above $51,200 and the 100 hourly Simple moving average.
  • There are two bullish trend lines forming with support at $51,450 and $49,200 on the hourly chart of the BTC/USD pair (data feed from Kraken).
  • The pair could continue to move up if it clears the $52,500 resistance zone.

Bitcoin Price Extends Rally

Bitcoin price started a steady increase above the $50,000 resistance zone. BTC gained strength above the $50,500 and $51,200 levels. It even spiked above the $52,000 resistance zone.

A new multi-week high was formed near $52,493 and the price is now consolidating gains. It is holding gains above the 23.6% Fib retracement level of the recent wave from the $48,240 swing low to the $52,493 high. There are also two bullish trend lines forming with support at $51,450 and $49,200 on the hourly chart of the BTC/USD pair.

Bitcoin is now trading above $51,200 and the 100 hourly Simple moving average. Immediate resistance is near the $52,500 level. The next key resistance could be $53,200, above which the price could extend its rally.

Bitcoin Price

Source: BTCUSD on TradingView.com

The next stop for the bulls may perhaps be $54,400. A clear move above the $54,400 resistance could send the price toward the $55,000 resistance. The next resistance could be near the $56,500 level.

Downside Correction In BTC?

If Bitcoin fails to rise above the $52,500 resistance zone, it could start another downside correction in the near term. Immediate support on the downside is near the $51,500 level and the first trend line.

The first major support is $50,500 and the 50% Fib retracement level of the recent wave from the $48,240 swing low to the $52,493 high. If there is a close below $50,500, the price could gain bearish momentum. In the stated case, the price could dive toward the $49,200 support and the second trend line.

Technical indicators:

Hourly MACD – The MACD is now gaining pace in the bullish zone.

Hourly RSI (Relative Strength Index) – The RSI for BTC/USD is now above the 50 level.

Major Support Levels – $51,500, followed by $50,500.

Major Resistance Levels – $52,500, $53,200, and $54,400.

Bitcoin Open Interest Surges To A 2-Year High, BTC Breaks Above $51,000

Bitcoin’s open interest has surged past $11 billion for the first time in over two years. This uptick comes when the world’s most valuable coin surges, recently easing past $51,000, the highest level since December 2021. 

Bitcoin open interest | Source: Kaiko on X

Surging Open Interest And Order Book Imbalance

According to Kaiko, a leading crypto analytics provider, this upswing in open interest comes at a critical time for the coin. When prices zoomed past $48,000 on February 11, there was an order book imbalance. Then, Kaiko observed there were $100 million more bids than asks. 

BTC ask-bid imbalance | Source: Kaiko on X

Technically, whenever there is an order book imbalance with more bids than asks, it suggests that buyers are more willing and enthusiastic to purchase at spot rates than sellers are willing to liquidate. Following this imbalance, prices shot higher the following days, breaking above the $50,000 psychological number to over $51,500 when writing on February 14. 

Surging open interest, especially as the market trends higher, is bullish. It means that more people are willing to participate in the market, hopeful of riding the trend. Subsequently, their participation translates to a more liquid market, charging the upside momentum.

Bitcoin is racing higher at the back of strong inflows into spot Bitcoin exchange-traded funds (ETFs). Over the past few weeks, spot Bitcoin ETF issuers have been rapidly accumulating the coin. The largest so far is BlackRock’s IBIT, owning over 70,000 BTC.

As a result, prices are edging higher, reflecting the high demand pinned directly to institutional participation. This positive sentiment and expectations of even more price gains, translating to higher open interest, is despite the continued liquidation of the Grayscale Bitcoin Trust (GBTC). Following court approval, GBTC is converted into an ETF, joining others like Fidelity, who also offer a similar product.

Genesis Looking To Sell GBTC; Will Bitcoin Rally In March?

Even with the high optimism, a potential cloud hangs over the Bitcoin market. Genesis, a crypto lender under bankruptcy protection, wants the court to allow them to sell over $1.4 billion of GBTC.

If the court green-lights this move, BTC could have more liquidation pressure, possibly unwinding recent gains. So far, the FTX estate sold their GBTC, estimated to be worth over $1 billion, coinciding with Bitcoin dropping to as low as $39,500 in January.

Bitcoin price trending upward on the daily chart | Source: BTCUSDT on Binance, TradingView

Besides these Bitcoin-specific events, the market is closely watching how the monetary policy scene in the United States will evolve in the next few weeks. The United States Federal Reserve is expected to slash rates in March, a potentially beneficial move for BTC.

Robinhood Cash Surge: Sees $4 Billion Monthly Inflow From Users

Robinhood, a significant player in the United States financial technology sector, has recorded major growth. The platform has seen a notable rise in monthly user inflow.

Robinhood Monthly Deposits Surges To New Height

A correspondent at CNBC, Kate Rooney, recently shared the development with the crypto community on the X (formerly Twitter) platform. The CNBC reporter said Robinhood recorded increased profits in its most recent quarterly results.

Rooney pointed out that the platform is making some headway in its attempt to overtake established “brokerage companies” for market dominance. Additionally, Robinhood aims to expand beyond its “original base of inexperienced and younger traders” in the crypto market.

She further highlighted that over $100 billion of the firm’s assets are currently “under custody.” In addition, a “net positive transfer from every major brokerage competitor” drove the Q4 deposits to approximately $4.6 billion.

Consequently, this suggests its increasing popularity among investors looking to include digital assets in their portfolios for diversification. It also indicates the growing confidence and inclination toward the trading firm among crypto investors. 

Robinhood

The CNBC correspondent asserted that the numbers above consist of an “average customer transfer balance” of $100,000.

As per Rooney’s X post, Robinhood saw a substantial rise in monthly deposits valued at $4 billion in January. So far, the recent uptick signifies the online trading platform’s strongest month since early 2021.

During the same quarter last year, the trading platform lost $166 million, or $0.19 per share. However, this year, it made a profit of $30 million, or $0.3 per share.

As was revealed, Robinhood’s income rose due to increased net interest and transaction-based and other revenue streams. Over the three months, its net interest income grew by 4% to $236 million.

Taking Over The Active Trader Market

Vlad Tenev, Robinhood’s Chief Executive Officer (CEO), has revealed Robinhood’s intentions to take over the active trader market. Tenev recently disclosed this objective during a quarterly earnings call.

He stated that the firm’s user base and revenue have grown “nearly seven times” in the past four years. “looking at what is in front of us, we are excited by the opportunity to continue growing significantly from here,” he added.

Robinhood has gained market share and attracted net asset inflows from its major rivals. According to Tenev, the company will continuously invest in its “user experience on mobile” to achieve its goal.

Currently, the crypto enterprise stands out as the dominant player in market share. Tenev has confirmed the addition of futures and index options to the platform in the coming months of this year.

Bitcoin