Binance Sets New Record: Spot Trading Volume Reaches $427 Billion

According to a recent CoinGecko report, Binance, the world’s largest centralized exchange (CEX) by trading volume, has retained its market leadership position in 2023. 

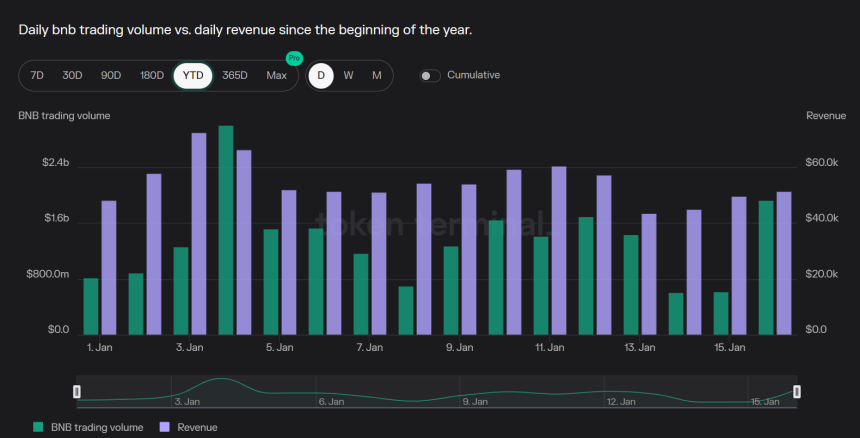
Despite facing increased regulatory scrutiny and undergoing significant leadership changes, Binance maintained a market share of 43.7% and saw its spot trading volume rise to $427.1 billion in December 2023, representing a 37.5% month-on-month (MoM) increase.

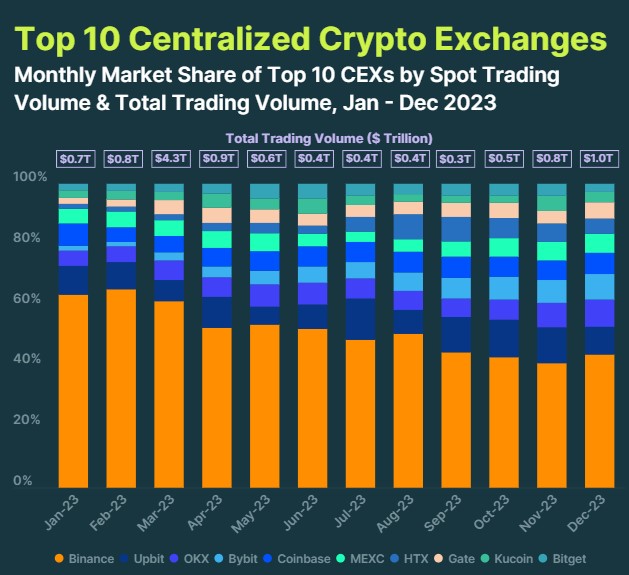
Binance Trading Volume Reached $3.8 Trillion In 2023

According to CoinGecko’s report, Binance started the year with a commanding 63.5% market share but experienced a gradual decline throughout 2023, ending with a 43.7% market share in December. 

While Binance still dominated the market with 52.6% of the total spot trading volume in 2023, the exchange’s relative market share decline was notable. In absolute terms, Binance generated $3.8 trillion in trading volume throughout the year.

Binance

As previously reported, Binance faced significant regulatory pressure throughout 2023, culminating in a settlement agreement in November that required the exchange to pay a $4.3 billion fine to the Department of Justice (DOJ) and the Commodity Futures Trading Commission (CTFC) for alleged financial breaches. 

As part of the settlement, Binance’s CEO, Changpeng Zhao (CZ), also agreed to step down. Richard Teng has assumed the role of the company’s head, while CZ remains restricted from traveling outside the jurisdiction of the United States as the legal battle unfolds. 

Upbit And OKX Follow Closely

Upbit, South Korea’s largest cryptocurrency exchange, managed to maintain its position as the second-largest centralized exchange in 2023, with a 9.5% market share and $687.0 billion in spot trading volume for the year.

According to the report, Upbit benefited from the Kimchi Premium, which resulted in strong local demand and premium prices for crypto assets. 

The exchange’s monthly spot trading volume hit a yearly high of $90.7 billion in December, with a 93.5% quarter-on-quarter (QoQ) increase.

Conversely, OKX secured the third position among centralized exchanges in 2023, with a 6.7% market share and $485.9 billion in trading volume. Throughout the year, OKX experienced a steady increase in market share, starting at 5.1% in January and ending at 8.9% in December. The exchange’s trading volume in Q4 reached $177.9 billion, reflecting a notable 151.6% QoQ gain.

Among the top 10 centralized exchanges, CoinGecko reports that MEXC recorded the highest growth in Q4 2023, with trading volume surging by 203.7% to $90.4 billion. 

Bybit followed closely with a growth rate of 162.1% ($107.5 billion), while KuCoin experienced a growth rate of 161.2% ($49.2 billion). KuCoin regained its spot in the Top 10 in Q4 after briefly losing it in Q3, with a market share of 3.3% at the end of December.

Binance

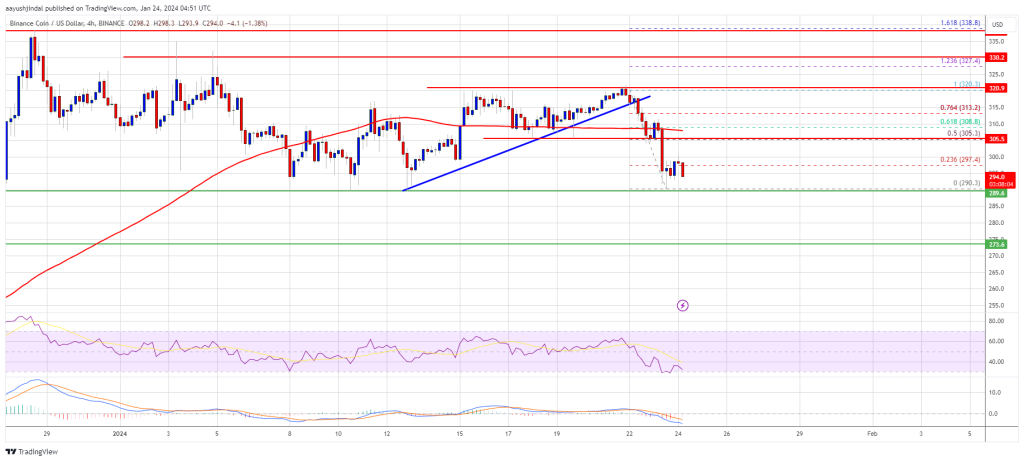
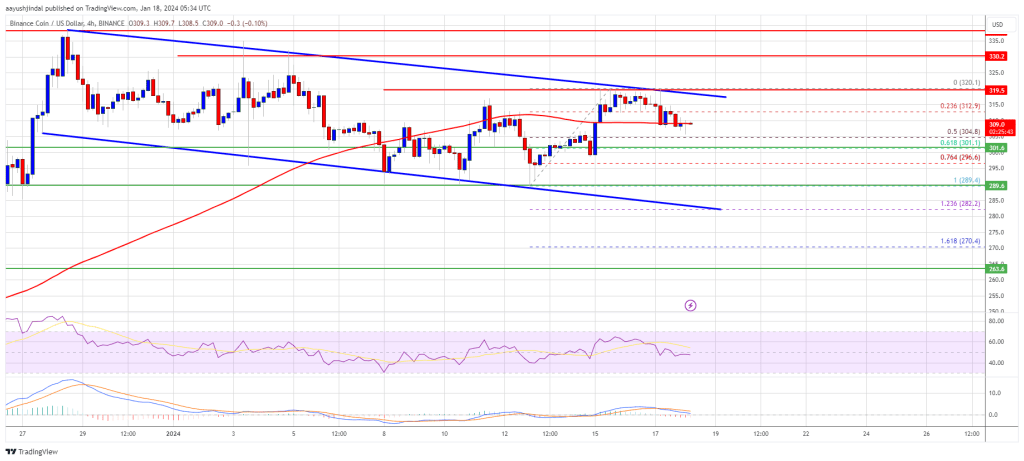
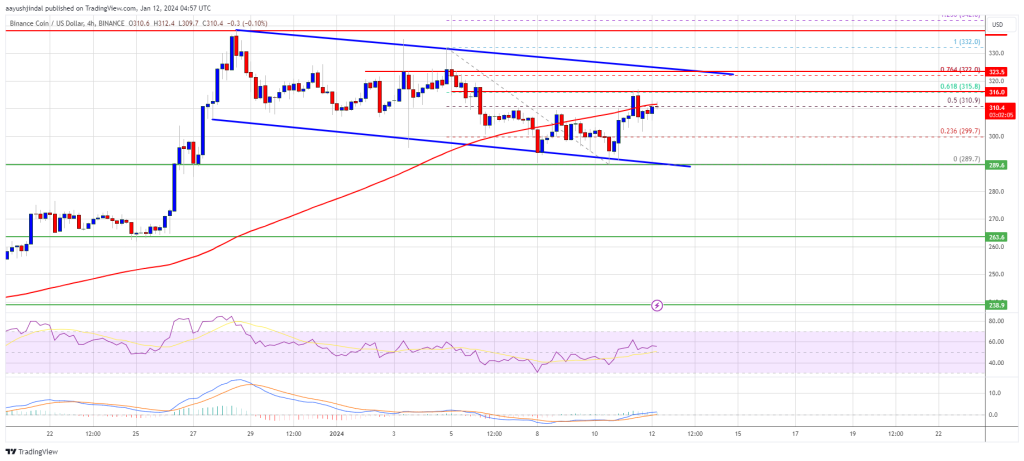
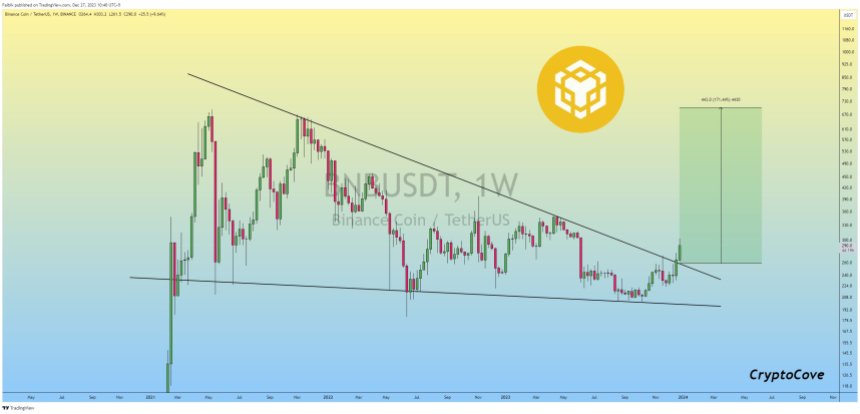
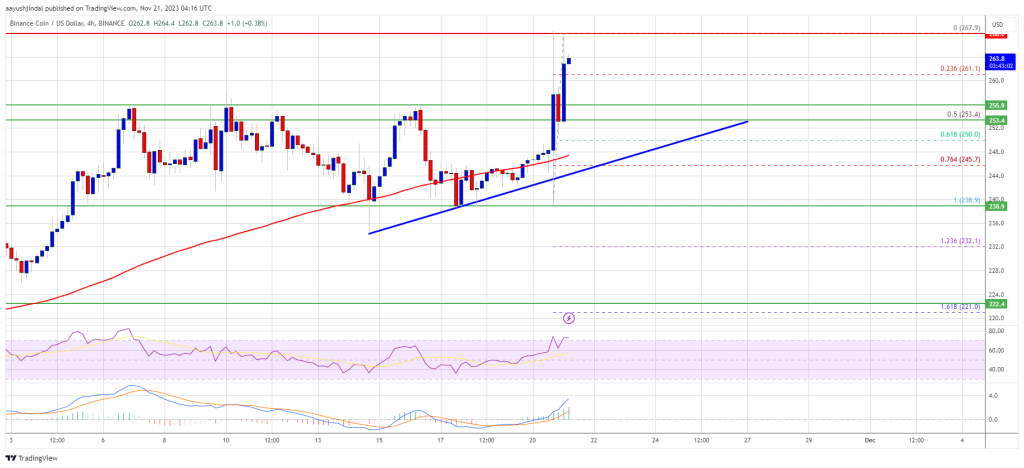
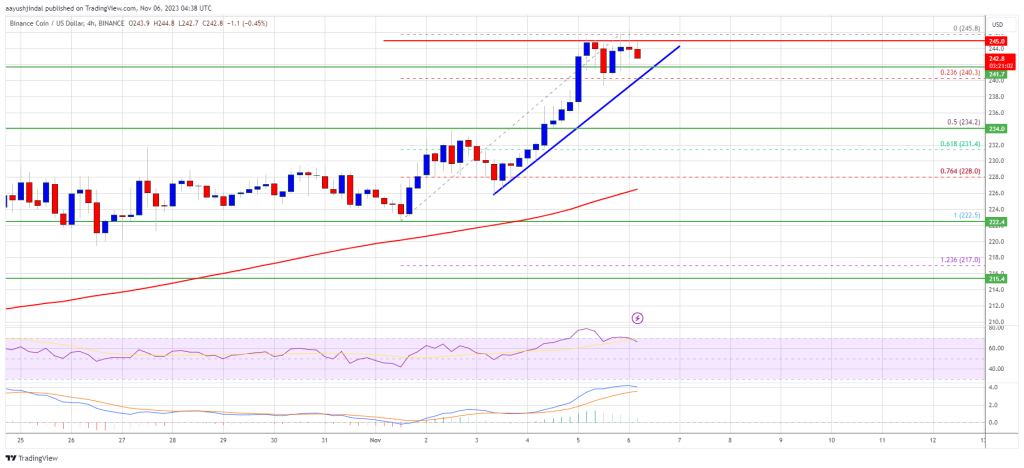
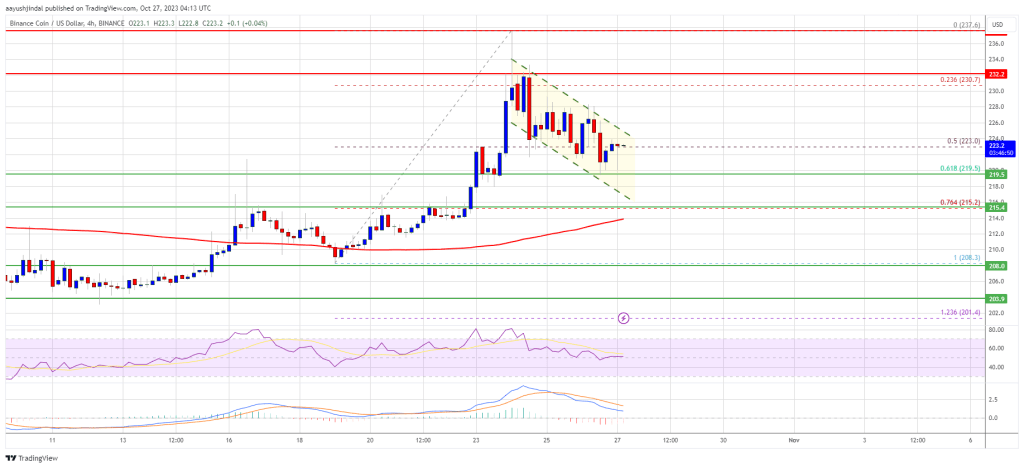
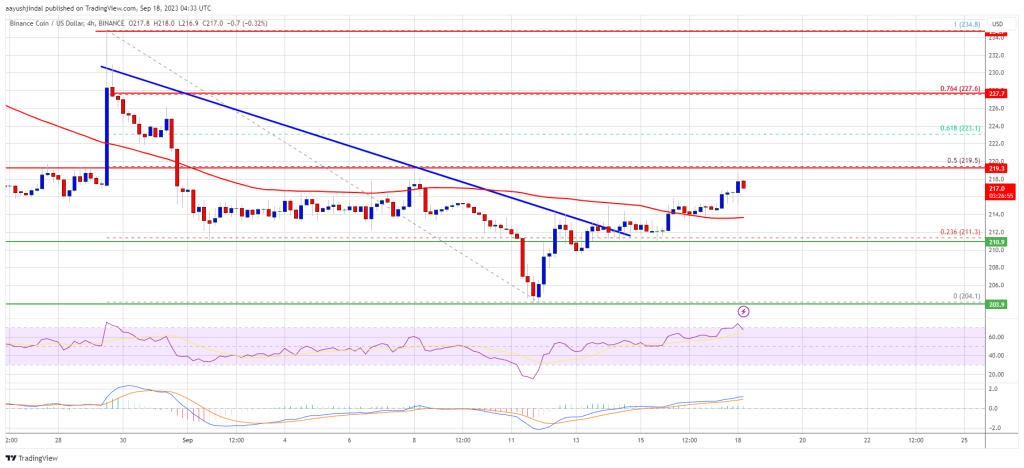
Binance Coin (BNB) has successfully maintained its position above the $300 threshold, with the current trading price standing at $304. This represents a 1.8% decrease in price over the past 24 hours.

Featured image from Shutterstock, chart from TradingView.com 

Binance Smart Chain (BSC) Market Cap Hits New Milestone, Registering 48% QoQ Surge

Binance Smart Chain (BSC) has demonstrated notable growth in key metrics during the fourth quarter (Q4) of 2023, as highlighted in a comprehensive report by Messari. 

As the third-largest Layer-1 protocol by market capitalization, BSC experienced positive progress across its financial indicators, signaling a productive quarter for the blockchain ecosystem.

Binance Smart Chain Record-Breaking Transactions

The report reveals that BSC’s market capitalization witnessed a 48% quarter-over-quarter (QoQ) surge. This surge reflects renewed interest in BNB (Binance Coin), the native asset of BSC, following two consecutive quarters of decline.

Moreover, BSC’s revenue measured in USD experienced a significant QoQ growth of 27%. This revenue surge, amounting to over $39 million in Q4, indicates increased activity on the protocol and the implementation of various initiatives throughout the year.

Binance Smart Chain

Gas fees burned in BNB, a metric reflecting network activity, also saw a notable QoQ increase of 21%. The rising number of transactions and smart contract interactions contributed to increased gas fees burned, further reinforcing the Binance Smart Chain ecosystem.

In addition to financial metrics, BSC showcased impressive improvements in other areas. The number of active validators increased by 25% QoQ, highlighting growing trust and participation in securing the network. BSC’s commitment to decentralization was evident as the protocol experienced a 54% YoY increase in active validators.

According to Messari, throughout 2023, BSC demonstrated its ability to handle heightened activity while simultaneously reducing costs for users. Daily transactions on the network witnessed a 35% year-over-year (YoY) increase and a 30% QoQ surge, averaging around 4.6 million transactions per day in Q4. 

These spikes in transaction volume were attributed to inscription-related activity, with BSC processing a record-breaking 32 million transactions on December 7, 2023.

BSC’s DeFi Ecosystem Reaches $4.6 Billion TVL

Despite a decline in daily average active addresses and new unique addresses, primarily due to users exploring alternative chains like opBNB, BSC’s on-chain activity remained robust. 

The protocol’s ecosystem of stablecoins, dominated by Tether’s USDT, reached a total value locked (TVL) of $4.6 billion in Q4, showcasing a 33% QoQ increase in Decentralized Finance (DeFi) TVL.

Binance Smart Chain

While Non-Fungible Token (NFT)- related metrics declined in Q4, Binance Smart Chain and Ethereum (ETH) witnessed a resurgence in activity toward the end of the quarter, indicating a potential upward trend in the next market cycle.

Binance Smart Chain

In addition to BSC’s growth, BNB also experienced notable price movements. After a sharp drop, BNB surged from $238 to reach the $338 level. However, it later retraced to $287 following a correction. 

In the past 24 hours, BNB has recorded a growth of 3.7%, pushing its current trading price above $302. 

Featured image from Shutterstock, chart from TradingView.com 

BNB Price Could See Major Drawdown If It Fails To Stay Above This Support

BNB price started a fresh decline from $320 resistance zone. The price is now retesting the $290 support and is at risk of more downsides.

  • BNB price is gaining bearish momentum from the $320 resistance.
  • The price is now trading below $310 and the 100 simple moving average (4 hours).
  • There was a break below a key bullish trend line with support at $315 on the 4-hour chart of the BNB/USD pair (data source from Binance).
  • The pair might continue to move down if it fails to stay above the $290 support.

BNB Price Takes Hit

In the past few days, BNB price made more than three attempts to clear the $320 resistance zone. However, the bears remained active and protected more gains.

As a result, there was a bearish reaction below the $315 level, like Bitcoin and Ethereum. There was a break below a key bullish trend line with support at $315 on the 4-hour chart of the BNB/USD pair. The pair even declined below the $300 level and tested the key support at $290.

A low is formed near $290.3, and the price is now struggling to correct higher. BNB price is now trading below $310 and the 100 simple moving average (4 hours). Immediate resistance is near the $298 level or the 23.6% Fib retracement level of the recent decline from the $320 swing high to the $290 low.

BNB Price

Source: BNBUSD on TradingView.com

The next resistance sits near the $305 level. It is close to the 50% Fib retracement level of the recent decline from the $320 swing high to the $290 low. A clear move above the $305 zone could send the price further higher. In the stated case, BNB price could test $320. A close above the $320 resistance might set the pace for a larger increase toward the $335 resistance. Any more gains might call for a test of the $350 level.

More Downsides?

If BNB fails to clear the $305 resistance, it could continue to move down. Initial support on the downside is near the $290 level.

The next major support is near the $285 level. The main support sits at $272. If there is a downside break below the $272 support, the price could drop toward the $250 support. Any more losses could initiate a larger decline toward the $220 level.

Technical Indicators

4-Hours MACD – The MACD for BNB/USD is gaining pace in the bearish zone.

4-Hours RSI (Relative Strength Index) – The RSI for BNB/USD is currently below the 50 level.

Major Support Levels – $290, $285, and $272.

Major Resistance Levels – $298, $305, and $320.

BNB Price Signals Bullish Exhaustion, Are Dips Attractive In Short-term?

BNB price is struggling to clear the $320 resistance zone. It might decline toward the $288 support zone before the bulls aim for another increase.

  • BNB price is struggling to gain traction above the $320 resistance.
  • The price is now trading near $310 and the 100 simple moving average (4 hours).
  • There is a major declining channel or a bullish flag pattern forming with resistance near $316 on the 4-hour chart of the BNB/USD pair (data source from Binance).
  • The pair might continue to move up if it stays above the $288 and $282 support levels.

BNB Price Holds Support

After forming a base above the $280 level, BNB price started a decent increase. There was a move above the $305 and $315 resistance levels. However, the bears seem to be active near the $320 zone.

A high was formed near $320 and the price is now correcting gains. However, the downsides are limited compared to Bitcoin and Ethereum. There was a move below the $312 level. The price is now approaching the 50% Fib retracement level of the upward move from the $289.4 swing low to the $320.1 high.

BNB price is now trading near $310 and the 100 simple moving average (4 hours). There is also a major declining channel or a bullish flag pattern forming with resistance near $316 on the 4-hour chart of the BNB/USD pair.

BNB Price

Source: BNBUSD on TradingView.com

Immediate resistance is near the $315 level or the channel region. The next resistance sits near the $320 level. A clear move above the $320 zone could send the price further higher. In the stated case, BNB price could test $340. A close above the $340 resistance might set the pace for a larger increase toward the $350 resistance. Any more gains might call for a test of the $375 level.

More Downsides?

If BNB fails to clear the $315 resistance, it could continue to move down. Initial support on the downside is near the $300 level or the 61.8% Fib retracement level of the upward move from the $289.4 swing low to the $320.1 high.

The next major support is near the $292 level. The main support sits at $288. If there is a downside break below the $288 support, the price could drop toward the $282 support. Any more losses could initiate a larger decline toward the $262 level.

Technical Indicators

4-Hours MACD – The MACD for BNB/USD is losing pace in the bullish zone.

4-Hours RSI (Relative Strength Index) – The RSI for BNB/USD is currently below the 50 level.

Major Support Levels – $300, $292, and $288.

Major Resistance Levels – $315, $320, and $325.

BNB Quarterly Burning: Over 2 Million Tokens Vanish, Valued At $636 Million

In a recent announcement by Binance, the BNB Foundation declared the successful completion of the 26th quarterly Binance Coin token burn through the BNB Chain. The burn, which included Auto-Burn and the Pioneer Burn Program, eliminated a significant amount of the exchange’s native token from circulation. 

BEP95 Initiative Results In 210K BNB Permanently Burned

During this latest burn event, the Auto-Burn process removed 2,141,487.27 BNB from circulation, equivalent to approximately $636 million in USD. 

It is worth noting that the Auto-Burn mechanism operates independently of Binance’s centralized exchange (CEX), providing an auditable and objective process, according to the exchange’s statement. 

Additionally, the Pioneer Burn Program contributed by removing 1542.15 tokens from circulation. This program permanently eliminates an amount of BNB equal to the provable lost funds of eligible users. 

Since the introduction of BEP95, an estimated 210,000 tokens have been permanently burned under this mechanism. As announced, the Pioneer Burn Program helps maintain the integrity of the ecosystem and ensures that lost funds do not influence the circulating supply.

Furthermore, BNB Chain’s Real-Time-Burn mechanism continuously reduces the token supply. This mechanism enables burning a portion of BNB Chain’s gas fees in real-time, further contributing to the ongoing supply reduction efforts.

Completing the 26th quarterly BNB token burn marks another significant milestone for the BNB ecosystem. The independent Auto-Burn mechanism, combined with the Pioneer Burn Program and Real-Time-Burn mechanism, showcases BNB Chain’s approach to reducing token supply and fostering long-term value. 

Robust User Adoption

In addition to its quarterly token burn, BNB has recently displayed notable strength and progress, as revealed by Token Terminal’s on-chain data

With a circulating market cap of $47.86 billion, BNB Chain has experienced a 30.45% increase in market capitalization. This surge in value reflects the growing confidence and demand for the token among investors. 

BNB Chain’s financial metrics are equally impressive. The platform has witnessed a revenue growth of 30.47% over the past 30 days, generating $1.72 million in revenue during this period, as seen in the chart below. 

Binance BNB BNBUSDT

Extrapolating this data to an annualized basis, the chain’s revenue is noteworthy at $20.96 million, reflecting solid financial stability and sustainable growth.

The data from Token Terminal also highlights BNB Chain’s increasing user adoption and developer activity. The platform has seen a surge in active daily users, with a 30-day average of 1.42 million, representing a robust 48.6% growth. 

The Binance Coin price performance has been steady, with a 2.14% decrease over the past 24 hours, while showing a positive trend over more extended periods. 

The token recorded a 4.38% increase in the past seven days, and over the past 30 days, it achieved an impressive growth of 30.51%. Furthermore, BNB’s performance over the past 180 days has been significant, with a growth rate of 29.92%.

BNB

Featured image from Shutterstock, chart from TradingView.com

BNB Price Prediction – Why Bulls Could Aim Fresh Rally To $350

BNB price is holding gains above the $300 pivot level. It is showing positive signs and might rally toward the $350 resistance zone.

  • BNB price is moving higher above the $300 resistance.
  • The price is now trading near $310 and the 100 simple moving average (4 hours).
  • There is a key declining channel or a bullish flag pattern forming with resistance near $325 on the 4-hour chart of the BNB/USD pair (data source from Binance).
  • The pair might continue to move up if there is a clear move above $315 and $325

BNB Price Aims Higher

After a major increase, BNB price faced resistance near the $340 zone. The price started a downside correction and recently tested the $290 zone. A low was formed near $289, and the price is now attempting a fresh increase, like Bitcoin and Ethereum.

There was a move above the $295 and $300 levels. The bulls pushed the price above the 50% Fib retracement level of the downward move from the $332 swing high to the $289 low. BNB is now trading near $310 and the 100 simple moving average (4 hours).

The current price action is positive and signals more upsides. Immediate resistance is near the $315 level. It is close to the 61.8% Fib retracement level of the downward move from the $332 swing high to the $289 low.

The next resistance sits near the $322 level. There is also a key declining channel or a bullish flag pattern forming with resistance near $325 on the 4-hour chart of the BNB/USD pair. A clear move above the $225 zone could send the price further higher.

BNB Price

Source: BNBUSD on TradingView.com

In the stated case, BNB price could test $340. A close above the $340 resistance might set the pace for a larger increase toward the $350 resistance. Any more gains might call for a test of the $375 level.

Downside Correction?

If BNB fails to clear the $322 resistance, it could start a downside correction. Initial support on the downside is near the $300 level.

The next major support is near the $292 level. The main support sits at $288. If there is a downside break below the $288 support, the price could drop toward the $262 support. Any more losses could initiate a larger decline toward the $250 level.

Technical Indicators

4-Hours MACD – The MACD for BNB/USD is gaining pace in the bullish zone.

4-Hours RSI (Relative Strength Index) – The RSI for BNB/USD is currently above the 50 level.

Major Support Levels – $300, $292, and $288.

Major Resistance Levels – $315, $322, and $325.

Binance 2023 Report Reveals: 40 Million New Users Added, Total Registered Users Reach 170 Million

In its recently released 2023 review report, Binance, the world’s leading cryptocurrency exchange, showcased significant growth despite facing legal disputes and regulatory scrutiny. 

The report highlighted the evolving crypto market, increasing institutional interest, and the company’s commitment to compliance and user experience.

Binance’s 2023 Review

Despite a volatile year for the market, Binance emphasized that digital asset regulation had taken a direction toward greater clarity and harmonization in some regions. 

The exchange acknowledged the challenges but noted that Web3 adoption and institutional interest continued to grow steadily, demonstrating the industry’s resilience and long-term potential.

Regarding growth within the company, Binance Square, formerly known as Binance Feed, was introduced as a social platform designed to be the central hub for Web3 content. 

According to the report, the platform experienced substantial growth, expanding from 1,200 to 11,000 creators and attracting over 1.6 million active daily users. Binance Square aimed to facilitate conversations and enable users to generate “compelling content,” fostering engagement within the Web3 community.

In October, Binance Futures launched its Copy Trading feature, allowing users to replicate the trading strategies of expert lead traders. This feature provided a monetization avenue for trading experts and added a social aspect to the trading experience of the platform users.

Binance

Furthermore, Binance continued its support of fiat currencies, reaching 69 supported fiat currencies with 30 fiat channels available globally. 

Binance P2P, the peer-to-peer trading platform, expanded the number of supported payment methods to 970 and fiat currencies to 112. The report highlights that the platform facilitated 18% more trades with 39% more users than the previous year.

The report further noted Binance’s commitment to compliance, with a significant investment of $213 million in its compliance program, a 35% increase from the previous year. 

Binance allocated substantial resources to develop in-house compliance tools, including a case management system and an internal transaction monitoring engine. 

Is Binance Leading The Way In Crypto Venture Funding?

Per the report, in 2023, Binance focused on enhancing user experience by partnering with localized KYC (know-your-customer) vendors and implementing various electronic ID (eID) solutions globally. 

The exchange added support for 298 new ID and proof-of-address documents across 64 countries, streamlining the onboarding process for users.

To make Web3 “more accessible,” the report notes that Binance launched its Web3 Wallet, which aims to provide a “secure” gateway into the world of decentralized finance (DeFi). The platform aimed to address usability barriers and attract new users by offering improved product and user experience across DeFi, blockchain gaming, and SocialFi.

Ultimately, while the crypto venture funding market faced challenges in 2023, Binance Labs emerged as one of the most active participants in the crypto venture capital (VC) space, particularly in the DeFi and Web3 gaming sectors, according to the exchange.

Overall, Binance’s 2023 Review Report highlights the company’s focus on compliance, user experience, and expanding Web3 offerings as key to continued growth despite ongoing legal issues and regulatory enforcement actions.

Binance

As of the current update, Binance Coin (BNB) demonstrates a significant upward trend in price action, surging to $330. This surge represents a 21% increase over the past seven days.

Featured image from Shutterstock, chart from TradingView.com 

Binance Coin (BNB) Blazes Ahead: Predictions Point To New All-Time Highs In First Half Of 2024

Binance Coin (BNB), despite experiencing a significant decline earlier this year due to market volatility and the SEC lawsuit against Binance and its founder Changpeng Zhao (CZ), has shown remarkable recovery and promising prospects. 

Recent data indicates a resurgence in the BNB price, driven by the growing usage of decentralized applications (DApps) on the Binance Smart Chain (BSC). 

Additionally, BNB’s fundamentals, including impressive market cap figures and increased revenue, further contribute to the positive momentum. 

BNB Price Rally Fueled By DApp Adoption? 

After witnessing a sharp decline from its yearly high of $350, BNB experienced a drop to the $203 level following the SEC lawsuit against Binance and CZ. However, recent price movements show signs of recovery and bullish sentiment

Over the past 24 hours, BNB has gained 4.5%, and its performance in the seven, fourteen, and thirty-day time frames demonstrates an upward trend, with gains of 20%, 24%, and 38%, respectively.

One of the driving factors behind BNB’s price rally is the increasing use of DApps on the Binance Smart Chain. Data from DappRadar reveals a surge in DApp volume, currently at $4.83 billion, representing a 12% increase. 

The BNB chain boasts an ecosystem of 5,120 DApps and has recorded 4.89 million transactions, reflecting a 12.73% surge in the past seven days. These figures indicate a growing demand for BNB as it serves as the primary token within the BSC ecosystem.

BNB

Comparing BNB to Ethereum (ETH), DappRadar data highlights BNB’s superior performance in various indicators such as contracts, total unique active wallets (UAW), decentralized finance (DeFi) total value locked (TVL), and non-fungible token (NFT) volume. 

The BNB chain has held the top position over the past 24 hours, showcasing its usage and adoption. This outperformance contributes to the positive market sentiment surrounding BNB and bolsters its price.

Binance Coin Market Cap Surges To $48 Billion

Further boosting the Binance Coin prospects, Token Terminal data reveals impressive market cap figures for BNB, with a circulating market cap of $48.02 billion, marking a 14.18% increase. 

Additionally, BNB’s fully diluted market cap stands at the same value, reflecting a 28.32% growth. The revenue generated by BNB in the past 30 days has increased by 28.51%, reaching $1.47 million. 

Furthermore, BNB has recorded significant fee growth, with a 27.98% fee increase over the past 30 days and an annualized revenue of $187.56 million. These fundamentals contribute to the positive sentiment surrounding BNB.

Overall, Binance Coin has staged a strong recovery, demonstrating a notable price rally driven by the increasing usage of DApps on the Binance Smart Chain. However, there is a bold prediction by a crypto analyst that could further boost the sentiment and excitement surrounding the token.

Binance Coin To Reach New Yearly High? 

According to Captain Faibik, a prominent crypto analyst on X (formerly Twitter), Binance Coin is poised to achieve a new yearly high in the first half of 2024. 

This prediction is based on an analysis of BNB’s 1-week chart, revealing a breakout from a descending triangle pattern, signaling the end of the macro downtrend and initiating a new uptrend phase for BNB.

Looking at the chart below, Faibik suggests that BNB’s price could potentially experience an impressive uptrend of 171% in the initial weeks of 2024. This surge would propel the token’s price above the current all-time high (ATH) of $686. 

BNB

However, several resistance levels must be overcome for this projection to materialize. Notably, at the current trading price of $307, BNB faces a significant seven-month resistance barrier, which currently hinders its ascent to the $314 level, the next resistance level in the near term. 

Analyzing the 1-day chart, it becomes evident that reaching the all-time high level would require surpassing additional macro resistance levels, including $329, $402, $450, $563, $607, $639, and $653.

While the theory proposed by Faibik holds promise, the actual realization of Binance Coin’s new yearly high in the early months of 2024, along with a sustained uptrend, remains to be observed. 

BNB

Featured image from Shutterstock, chart from TradingView.com 

BNB Price Faces Critical Juncture: Head-And-Shoulders Breakout Or Bearish Dip Below $200?

The Binance Coin (BNB) price is crucial as market analysts offer differing viewpoints on the cryptocurrency’s potential direction. While one analyst presents a bullish case, anticipating a breakout and surge beyond $300, another raises concerns about a dip below $200.

BNB Price Analysis

Crypto analyst Ali Martinez suggests that BNB price could be on the verge of breaking out of a head-and-shoulders pattern

Martinez emphasizes the significance of a sustained close above $261, which could catalyze BNB’s upward trajectory toward $310. With a 2.9% gain over the past 24 hours and a 12% uptrend in the last fourteen days, the recent price action aligns with Martinez’s breakout thesis.

BNB Price

Martinez analyzes the 1-day chart and identifies the $257 level as a crucial breakout point, signaling a potential shift in trend. 

If the sustained uptrend continues, BNB’s price could see a substantial 19.8% gain shortly, pushing the price toward $310. This projection remains just below BNB’s yearly high of $350 in April.

However, contrasting this bullish outlook, Daan de Rover, a crypto analyst, and YouTuber, highlights BNB’s downtrend structure in the 1-week chart. 

Bearish Outlook For Binance Coin

According to de Rover, the current BNB price action “looks weak,” raising concerns about the currency’s possible continuation of its downward trajectory, which began earlier this year. 

The analyst points to the “green box” on the 1-week chart, as seen in the graphic below, as a critical support level. If breached, it could lead to a deeper decline for BNB, falling below the $200 mark.

BNB Price

De Rover’s cautious view is further emphasized by the fact that dropping below $200 would mark a level not breached since the bear market and crypto winter. 

BNB Chain Records Positive Growth 

According to Token Terminal data, the circulating market cap of BNB stands at $39.83 billion, with a slight decrease of 1.56% observed. However, it is important to note that the fully diluted market cap remains the same at $39.83 billion, indicating a stable valuation for the cryptocurrency. 

BNB has witnessed a positive revenue trend, with a 30.37% increase in annualized revenue, reaching $16.46 million. The 30-day revenue figure also shows growth at $1.35 million, representing a 21.33% increase.

When assessing profitability ratios, the price-to-fully-diluted ratio (P/F) currently stands at 281.75x, indicating the market’s confidence in BNB’s potential. While there has been a slight decline of 18.2% in this ratio, it remains relatively high. 

The price-to-sales ratio (P/S) is also noteworthy, reaching 2,962.98x, although it has experienced a decline of 18.5%.

BNB Chain has seen a positive trend regarding fees generated, with a 30-day increase of 20.92% to $14.22 million. The annualized fees have grown substantially, reaching $173.07 million, a significant 30.15% increase. 

The future trajectory of the BNB price and its underlying blockchain remains uncertain. Whether the cryptocurrency will experience continued growth or succumb to a bearish sentiment is yet to be determined.

BNB Price

Featured image from Shutterstock, chart from TradingView.com

BNB Price Clears $250 and Could Rally 10% To Retest This Key Resistance

BNB price gained momentum and climbed above the $250 resistance. It is showing positive signs and might rally toward the $272 resistance zone.

  • BNB price is moving higher above the $250 resistance.
  • The price is now trading above $250 and the 100 simple moving average (4 hours).
  • There was a break above a key bearish trend line with resistance near $252 on the 4-hour chart of the BNB/USD pair (data source from Binance).
  • The pair might continue to move up if there is a clear move above $258.

BNB Price Regains Traction

These past few days, BNB price formed a base above the $230 level. The price started a decent increase above the $240 and $242 resistance levels. In the past two sessions, it even outperformed Ethereum and Bitcoin.

BNB broke the 76.4% Fib retracement level of the downward move from the $257.1 swing high to the $231.9 low. There was also a break above a key bearish trend line with resistance near $252 on the 4-hour chart of the BNB/USD pair.

It is now trading above $250 and the 100 simple moving average (4 hours). The current price action is positive and signaling more upsides above the $258 resistance zone.

The next resistance sits near the $262 level. A clear move above the $262 zone could send the price further higher. In the stated case, BNB price could test $272. It is close to the 1.618 Fib extension level of the downward move from the $257.1 swing high to the $231.9 low.

BNB Price

Source: BNBUSD on TradingView.com

A close above the $272 resistance might set the pace for a larger increase toward the $285 resistance. Any more gains might call for a test of the $300 level.

Downside Correction?

If BNB fails to clear the $258 resistance, it could start a downside correction. Initial support on the downside is near the $248 level.

The next major support is near the $242 level. The main support sits at $232. If there is a downside break below the $232 support, the price could drop toward the $222 support. Any more losses could initiate a larger decline toward the $205 level.

Technical Indicators

4-Hours MACD – The MACD for BNB/USD is gaining pace in the bullish zone.

4-Hours RSI (Relative Strength Index) – The RSI for BNB/USD is currently above the 50 level.

Major Support Levels – $248, $242, and $232.

Major Resistance Levels – $258, $272, and $285.

BNB Plummets 10% Amid Binance’s $4.3 Billion Settlement And CEO’s Impending Resignation

Binance Coin (BNB), the native token of the Binance cryptocurrency exchange, has experienced a sharp decline of 10% following reports that Binance is preparing to settle criminal charges with the US Department of Justice (DOJ) through a $4.3 billion fine. 

Binance CEO To Plead Guilty

The Wall Street Journal has disclosed that Binance CEO Changpeng Zhao (CZ), commonly known as CZ, will plead guilty to violating criminal anti-money laundering requirements. 

Concurrently, Binance will also plead guilty to a criminal charge related to anti-money laundering violations, resulting in a significant fine. Furthermore, CZ is expected to step down as CEO, with Richard Teng being considered as a potential successor.

Changpeng Zhao is scheduled to appear before a federal court in Seattle to enter his guilty plea. This crucial legal step can further impact BNB’s price action as investors assess the implications of CZ’s admission of guilt regarding violating anti-money laundering requirements. 

The reported settlement involves Binance pleading guilty to a criminal charge related to anti-money laundering violations, leading to a hefty $4.3 billion fine. This substantial sum encompasses payments to settle civil allegations made by regulators. 

These developments occur in an increasingly stringent regulatory environment in the cryptocurrency industry. The recent charges brought by the SEC against Kraken further highlight the regulatory scrutiny faced by industry players. 

Additionally, market participants anticipate significant enforcement actions by the DOJ, which adds to the atmosphere of uncertainty and apprehension.

Will CZ’s Statement Halt BNB Downtrend? 

Despite the shocking revelation surrounding Binance’s leadership and its impact on the crypto community, there may still be hopes for a potential recovery of Binance Coin and the overall crypto market as the case reaches its conclusion.

With CZ reaching a settlement with the US Department of Justice (DOJ) and pleading guilty to criminal charges, the exchange can breathe a sigh of relief, knowing that regulatory agencies have addressed their concerns and potential legal action.

Furthermore, this settlement could be seen as a victory for regulators, particularly in light of the ongoing legal battles between the US Securities and Exchange Commission (SEC) and Ripple Labs, which involve the cryptocurrency XRP. 

A favorable outcome in these cases could potentially boost confidence in the broader crypto industry and drive prices higher.

BNB

Currently, BNB is trading at $240, showing signs of recovery from its recent drop, which briefly touched $235 but managed to stay above the critical support level of $232. 

In further declines, BNB bulls will need to hold the support levels at $228, $217, and $214 to prevent the token from dropping below the critical level of $200.

However, suppose Changpeng Zhao and the new Binance CEO can provide a statement that reassures the community and instills a sense of calm. In that case, it may bring a renewed positive sentiment and potentially halt the current downtrend for BNB.

The unfolding of the situation, the next steps for the exchange, and CZ’s fate remain to be seen. The community and market participants eagerly await further developments and announcements shaping the future of Binance and its native token, BNB.

Featured image from Shutterstock, chart from TradingView.com 

Crypto Market Reacts: Binance CEO Changpeng Zhao Steps Down

In a shocking turn of events, Binance CEO Changpeng Zhao has agreed to step down from the crypto exchange and has plead guilty to “violating US anti-money laundering requirements.”

The news is currently being priced into the crypto market, leading to extreme volatility in Bitcoin and altcoins, plus a lot of chatter on social media. Let’s take a closer look at how the market and speculators are reacting so far.

CZ To Step Down, Pleads Guilty, Company Charged $4B In Fines

Earlier today, the US Department of Justice revealed it would be announcing action against a cryptocurrency company. The most dominant cryptocurrency exchange, Binance, was the target of the enforcement action, and was ordered to pay $4.3 billion in fines.

Binance CEO Changpeng “CZ” Zhao stepped down as a result, and plead guilt to US anti-money laundering charges. The crypto market sank in the earlier hours today in anticipation of the news.

However, as soon as the Wall Street Journal revealed the information publicly, Bitcoin price bounced back and so did the altcoin market. Moments later, most of the upside price action was wiped out. Price as traded within roughly a 4% range today, but has traded across that several times since the news broke, highlighting powerful intraday volatility.

Binance BTCUSDT

The Crypto Market Reacts To The Binance News

While the market tries to price in what just occurred, volatility will continue to ensue in the near term. On X (formerly Twitter), notable figures are speaking out in regards to CZ’s departure from Binance.

On-chain analyst and market commentator Will Clemente points out it is “just a matter of weeks until Bitcoin ETF approval now” with Binance out of the way. The company has long been cited as a key reason for the SEC remaining hesitant to pull the trigger on a spot BTC ETF application approval.

Messari Crypto CEO Ryan Selkis calls it one of the “biggest catalysts we could have in crypto” between ETFs, crypto-friendly legislation, and this $4 billion settlement helping crypto be viewed as a “real industry.”

Economist Alex Kruger reveals that the settlement is ranked the 7th in financial compliance history, next to names like JP Morgan, Bank of America, Goldman Sachs, Wells Fargo, and several others.

BNB Price Momentum Reignites – Why Bulls Could Aim For 15% Rally

BNB price gained momentum and climbed above the $250 resistance. It is up over 5% and the bulls could soon aim for a move toward the $300 level.

  • BNB price is moving higher above the $250 resistance.
  • The price is now trading above $255 and the 100 simple moving average (4 hours).
  • There is a major bullish trend line forming with support at $253.5 on the 4-hour chart of the BNB/USD pair (data source from Binance).
  • The pair might continue to move up if there is a clear move above $268.

BNB Price Jumps 8%

These past few days, BNB price remained stable above the $240 resistance. The bulls stepped in and were able to clear a major hurdle at $250. It opened the doors for more upsides above $255.

BNB gained traction and climbed above $260. It is up over 5% and outperforming both Bitcoin and Ethereum. A new multi-week high is formed near $267.9 and the price is now consolidating gains. It is above the 23.6% Fib retracement level of the upward move from the $238.9 swing low to the $267.9 high.

BNB is also trading above $255 and the 100 simple moving average (4 hours). Besides, there is a major bullish trend line forming with support at $253.5 on the 4-hour chart of the BNB/USD pair.

BNB Price Jumps 8%

Source: BNBUSD on TradingView.com

If there is a fresh increase, the price could face resistance near the $265 level. The next resistance sits near the $268 level. A clear move above the $268 zone could send the price further higher. In the stated case, BNB price could test $280. A close above the $280 resistance might set the pace for a larger increase toward the $300 resistance.

Downside Correction?

If BNB fails to clear the $265 resistance, it could start a downside correction. Initial support on the downside is near the $260 level. The next major support is near the $255 level.

The main support sits at $253 or the trend line. It is close to the 50% Fib retracement level of the upward move from the $238.9 swing low to the $267.9 high. If there is a downside break below the $253 support, the price could drop toward the $245 support. Any more losses could initiate a larger decline toward the $238 level.

Technical Indicators

4-Hours MACD – The MACD for BNB/USD is gaining pace in the bullish zone.

4-Hours RSI (Relative Strength Index) – The RSI for BNB/USD is currently above the 50 level.

Major Support Levels – $260, $255, and $253.

Major Resistance Levels – $265, $268, and $280.

BNB Price Shows Signs of Life But $250 Is The Key To More Upsides

BNB price avoided a major decline below $200 and recovered against the US Dollar. It climbed above $235 and now faces many hurdles near $245 and $250.

  • BNB price is slowly moving higher toward the $250 resistance.
  • The price is now trading above $235 and the 100 simple moving average (4 hours).
  • There is a key bullish trend line forming with support at $241.5 on the 4-hour chart of the BNB/USD pair (data source from Binance).
  • The pair might gain bullish momentum if there is a clear move above $250.

BNB Price Recovers 10%

These past few days, BNB price managed to start a recovery wave above the $220 resistance. The recent positive moves in Bitcoin, Ethereum, and other altcoins sparked a decent increase in BNB.

There was a steady move above the $232 and $235 resistance levels. The price even climbed toward the $245 resistance. A high is formed near $245.8 and the price is now consolidating gains. It is trading above the 23.6% Fib retracement level of the upward move from the $222.5 swing low to the $245.8 high.

BNB is also trading above $235 and the 100 simple moving average (4 hours). Besides, there is a key bullish trend line forming with support at $241.5 on the 4-hour chart of the BNB/USD pair.

BNB Price

Source: BNBUSD on TradingView.com

If there is a fresh increase, the price could face resistance near the $245 level. The next resistance sits near the $250 level. A clear move above the $250 zone could send the price further higher. In the stated case, BNB price could test $265. A close above the $265 resistance might set the pace for a larger increase toward the $280 resistance.

Downside Correction?

If BNB fails to clear the $245 resistance, it could start a downside correction. Initial support on the downside is near the $240 level and the trend line.

The next major support is near the $235 level or 50% Fib retracement level of the upward move from the $222.5 swing low to the $245.8 high. If there is a downside break below the $235 support, the price could drop toward the $226 support. Any more losses could initiate a larger decline toward the $220 level.

Technical Indicators

4-Hours MACD – The MACD for BNB/USD is losing pace in the bullish zone.

4-Hours RSI (Relative Strength Index) – The RSI for BNB/USD is currently above the 50 level.

Major Support Levels – $240, $235, and $226.

Major Resistance Levels – $245, $250, and $265.

BNB Chain Q3 Revenue Takes A Hit: Fees Plummet By 40%

In a recent report by Messari, the analysis sheds light on the developments and challenges faced by Binance Chain (BNB), the blockchain created by Binance, the world’s largest cryptocurrency exchange regarding trading volume

The report highlights the separation of BNB Chain from Binance and various events and allegations that have impacted Binance and its associated entities throughout the third quarter of 2023.

Binance Chain Separation And Challenges

The Messari report emphasizes that BNB Chain has distinguished itself as an independent entity separate from Binance despite its origins as a product of the largest centralized cryptocurrency exchange. However, the market has not fully recognized this separation, leading to a lack of distinction between BNB Chain and Binance.

During the third quarter, Binance encountered numerous challenges, including losing partnerships, shutting down lines of business, conducting layoffs, and facing accusations of violating sanctions. 

BNB Chain

These events coincided with a downward pressure on the value of BNB, which experienced a 25% decline compared to the previous quarter. In contrast, the cryptocurrency market dropped by 9% during the same period.

The Messari report mentions that Binance, including its subsidiary Binance.US, was accused by the Securities and Exchange Commission (SEC) of engaging in unregistered offers and sales of “crypto securities”, including BNB. 

These allegations further added to the challenges faced by Binance and its associated entities during the third quarter.

BNB Chain Performance And On-chain Activity

Despite the challenges, BNB maintained its position as the fourth-largest cryptocurrency by market capitalization, with a market cap of $35.3 billion. The circulating supply of BNB decreased by 1.3% in the third quarter due to the token-burning mechanism employed by BNB Chain.

The report also highlights the impact of adverse events on BNB Chain’s on-chain activity. BNB Smart Chain’s revenue, measured in BNB, fell in line with the decline in BNB’s market cap, indicating a decrease in activity on the Binance Smart Chain (BSC). Daily transactions (-14%) and average fees (-12) in BNB also experienced declines during this period.

BNB Chain offers staking opportunities for cryptocurrencies such as Ethereum (ETH), BNB, Cardano (ADA), and others. The report notes that the total stake and eligible supply declined by 3% and 2%, respectively, while the average annualized staking yield decreased from 2.6% to 2.1% during the third quarter.

BNB Chain

The DeFi sector on the BNB Chain demonstrated strength compared to other sectors. The NFT space experienced increased secondary sales volume, unique buyers, and sellers. 

However, stablecoin transfers and GameFi experienced declines in volume. The report suggests that newer applications on BSC may have influenced the growth of unique buyers and sellers in the NFT sector.

Ultimately, the Messari report provides insights into the separation of BNB Chain from Binance and the challenges faced by Binance and its associated entities during the third quarter of 2023. 

Despite these challenges, BNB Chain maintained its market capitalization and continued to launch new products and implement technical upgrades. The report highlights the need for market recognition of the separation between BNB Chain and Binance and the impact of adverse events on BNB Chain’s on-chain activity.

BNB Chain

On the other hand, BNB has experienced a prolonged downtrend since reaching its annual peak of $350 in April. Subsequently, the token plummeted to $202 on October 9. 

However, recent developments have resulted in a positive trend, with BNB recording a profit of 5.2% in the past 14 days and 1.8% in the last 30 days. As a result, the current trading price of BNB stands at $223.

Featured image from Shutterstock, chart from TradingView.com 

Binance Founder CZ’s Fortunes Plummet By $12 Billion Amidst Downturn in Crypto Trading

Changpeng Zhao, widely known as CZ and the founder of Binance, one of the largest cryptocurrency exchanges, has suffered a significant blow to his fortune. According to a recent Bloomberg report, CZ’s wealth plummeted by $12 billion due to the ongoing slump in crypto-trading activities. 

Per the report, this decline was primarily attributed to a sharp drop in trading volumes at Binance throughout the year.

CZ’s Financial Losses

The Bloomberg Billionaires Index revised its revenue estimates for Binance, slashing it by 38% after data revealed a decline in trading volumes at the exchange. As a result, CZ’s net worth now stands at $17.2 billion, marking a significant reduction from his previous valuation.

According to Bloomberg, CZ’s involvement in recent events that led to the bankruptcy filing of FTX further impacted his financial situation. In November, CZ announced the liquidation of a token linked to FTX (FTT) after reports emerged that Alameda Research, the hedge fund owned by Sam Bankman-Fried, the founder of FTX, held a large position in it. 

The announcement triggered a rush among FTX customers to withdraw funds, overwhelming the exchange’s infrastructure. As a consequence, FTX declared bankruptcy within a week, erasing Bankman-Fried’s fortune, which had peaked at $26 billion in March the previous year.

To estimate Binance’s revenue, the Bloomberg Billionaires Index relies on spot and derivatives trading data from crypto-tracking services Coingecko and Coinpaprika. 

Binance had witnessed a significant gain in market share earlier this year, reaching 62% of total on-exchange crypto trades during the first quarter. However, after a promotional zero-fee period for popular trading pairs ended, Binance’s market share slid to 51% by the end of the third quarter, as reported by research firm CCData.

Binance Value Plunges As Lawsuits And Allegations Take A Toll

Binance has also faced increasing regulatory scrutiny, isolating itself from the traditional financial system. The Securities and Exchange Commission (SEC) filed a lawsuit against Binance in June, accusing the exchange of violating regulations. 

Earlier this year, the Commodity Futures Trading Commission (CFTC) also took legal action against Binance for non-compliance with rules that allowed US users to access the platform. 

Allegations against Binance include inadequate money-laundering controls, inflated trading volumes, and mishandling of client assets. Binance has strongly disputed these claims and is currently contesting them in court. 

In June, Bloomberg’s wealth index reduced the value of Binance’s US exchange to zero after it announced the discontinuation of dollar transactions, resulting in a significant decline in trading volumes. 

Binance.US had previously been valued at $4.7 billion during a funding round in March 2022, while CZ’s net worth peaked at $96 billion in January.

The challenges faced by Binance are not unique, as regulatory uncertainties and rising interest rates have made alternative investments more appealing. Coinbase Global, another leading cryptocurrency exchange, experienced a 52% decline in spot trading volume in the third quarter compared to the previous year, according to Bloomberg. 

Binance

Despite the personal wealth challenges CZ faces, Binance Coin (BNB) has capitalized on the overall market recovery, showcasing substantial gains across various time frames. Currently, the token is trading at $225.2, maintaining its upward trend with a 2.2% increase over the past 24 hours.

Furthermore, BNB has demonstrated significant gains of 5.8%, 9.6%, and 6.1% over the seven, fourteen, and thirty-day time frames, respectively. These positive trends highlight the token’s strong performance in recent weeks.

Featured image from Binance, chart from TradingView.com 

BNB Price At Make-Or-Break Moment, Key Levels To Watch

BNB price struggled to climb above $240 and corrected gains against the US Dollar. It is now approaching a major support zone at $220 and $215.

  • BNB price is slowly moving lower toward the $220 support against the US Dollar.
  • The price is now trading above $215 and the 100 simple moving average (4 hours).
  • There is a key bullish flag pattern forming with resistance near $225 on the 4-hour chart of the BNB/USD pair (data source from Binance).
  • The pair might gain bullish momentum if there is a clear move above $228.

BNB Price Eyes Fresh Increase

These past few days, BNB price saw a decent recovery wave above the key $220 resistance zone. Bitcoin rallied over 20% to $35,000 and helped BNB avoid a major downside break.

The price climbed above the $225 and $230 resistance levels. However, it struggled near the $238-$240 zone. A high was formed near $237.6 and the price recently started a downside correction. There was a move below the $235 level.

BNB dipped below the 50% Fib retracement level of the upward move from the $208.3 swing low to the $237.6 high. It is now trading above $215 and the 100 simple moving average (4 hours). There is also a key bullish flag pattern forming with resistance near $225 on the 4-hour chart of the BNB/USD pair.

BNB Price

If there is a fresh increase, the price could face resistance near the $225 level. The next resistance sits near the $228 level. A clear move above the $228 zone could send the price further higher. In the stated case, BNB price could test $238. A close above the $238 resistance might set the pace for a larger increase toward the $250 resistance.

More Losses?

If BNB fails to clear the $228 resistance, it could start another decline. Initial support on the downside is near the $220 level and the 61.8% Fib retracement level of the upward move from the $208.3 swing low to the $237.6 high.

The next major support is near the $215 level or the 100 simple moving average (4 hours). If there is a downside break below the $215 support, the price could drop toward the $207 support. Any more losses could initiate a larger decline toward the $202 level.

Technical Indicators

4-Hours MACD – The MACD for BNB/USD is losing pace in the bullish zone.

4-Hours RSI (Relative Strength Index) – The RSI for BNB/USD is currently above the 50 level.

Major Support Levels – $220, $215, and $207.

Major Resistance Levels – $225, $228, and $238.

BNB Price Prediction – Bears Struggle, Will Price Finally Cross $220?

BNB price is still consolidating above the $200 support zone against the US Dollar. It could start a decent increase if there is a close above the $220 resistance.

  • BNB price is slowly moving higher toward the $220 resistance against the US Dollar.
  • The price is now trading above $210 and the 100 simple moving average (4 hours).
  • There is a key bullish trend line forming with support near $211.5 on the 4-hour chart of the BNB/USD pair (data source from Binance).
  • The pair might gain bullish momentum if there is a daily close above $220.

BNB Price Remains In A Range

This past week, BNB price again retested the $200-$202 support zone. The bears made another attempt to clear the key $200 support, but they failed. A low was formed near $203 before the price started a decent increase, like Bitcoin and Ethereum.

There was a move above the $210 and $212 levels. The price tested the main $220 resistance. A high is formed near $219.2 and the price is now consolidating above the 50% Fib retracement level of the upward move from the $203 swing low to the $220 high.

BNB is now trading above $210 and the 100 simple moving average (4 hours). There is also a key bullish trend line forming with support near $211.5 on the 4-hour chart of the BNB/USD pair.

BNB Price Prediction

Source: BNBUSD on TradingView.com

If there is a fresh increase, the price could face resistance near the $215.5 level. The next resistance sits near the $220 level. A clear move above the $220 zone could send the price further higher. In the stated case, BNB price could test $235. A close above the $235 resistance might set the pace for a larger increase toward the $250 resistance.

More Losses?

If BNB fails to clear the $220 resistance, it could start another decline. Initial support on the downside is near the $211 level and the trend line. The next major support is near the $207 level or the 76.4% Fib retracement level of the upward move from the $203 swing low to the $220 high.

If there is a downside break below the $207 support, the price could drop toward the $202 support. Any more losses could initiate a larger decline toward the $185 level.

Technical Indicators

4-Hours MACD – The MACD for BNB/USD is losing pace in the bearish zone.

4-Hours RSI (Relative Strength Index) – The RSI for BNB/USD is currently above the 50 level.

Major Support Levels – $211, $207, and $202.

Major Resistance Levels – $215, $220, and $222.

BNB Price Prediction – Bears Aim Nasty Drop Below $200, Here’s Why

BNB price (Binance coin) is still struggling to clear the $220 resistance against the US Dollar. The price could decline heavily below the $210 and $202 support levels.

  • Binance coin price is slowly moving lower from the $220 resistance against the US Dollar.
  • The price is now trading below $215 and the 100 simple moving average (4 hours).
  • There was a break below a key bullish trend line with support near $214.5 on the 4-hour chart of the BNB/USD pair (data source from Binance).
  • The pair might accelerate lower if it breaks the $210 support level.

Binance Coin Price Remains At Risk

This past week, BNB price attempted a recovery wave above the $210 level. The price was able to clear the $215 resistance zone. However, it failed to clear the $220 resistance.

There was a fresh decline in BNB, like Bitcoin and Ethereum. The price declined below the $215 support level. The bears pushed the price below the 50% Fib retracement level of the upward move from the $207 swing low to the $221 high.

Besides, there was a break below a key bullish trend line with support near $214.5 on the 4-hour chart of the BNB/USD pair. The price is now trading below $215 and the 100 simple moving average (4 hours).

It is consolidating near the 76.4% Fib retracement level of the upward move from the $207 swing low to the $221 high. If there is a recovery wave, the price could face resistance near the $213 level and the 100 simple moving average (4 hours).

BNB Price Prediction

Source: BNBUSD on TradingView.com

The next resistance sits near the $215 level. A clear move above the $215 zone could send the price further higher. In the stated case, BNB price could test the main resistance at $220-$222. A close above the $222 resistance might set the pace for a larger increase toward the $250 resistance.

More Losses in BNB?

If BNB fails to clear the $215 resistance, it could start another decline. Initial support on the downside is near the $210 level. The next major support is near the $207 level.

If there is a downside break below the $207 support, the price could drop toward the $202 support. Any more losses could initiate a larger decline toward the $165 level.

Technical Indicators

4-Hours MACD – The MACD for BNB/USD is gaining pace in the bearish zone.

4-Hours RSI (Relative Strength Index) – The RSI for BNB/USD is currently below the 50 level.

Major Support Levels – $210, $207, and $202.

Major Resistance Levels – $215, $220, and $222.

BNB Price Prediction – Poised For Bullish Breakout Unless This Changes

BNB price (Binance coin) stayed above the main $202 support against the US Dollar. The price is recovering and might rally if there is a move above $220.

  • Binance coin price is slowly moving higher above the $212 level against the US Dollar.
  • The price is now trading above $214 and the 100 simple moving average (4 hours).
  • There was a break above a major bearish trend line with resistance near $213 on the 4-hour chart of the BNB/USD pair (data source from Binance).
  • The pair might gain bullish momentum if there is a close above $220.

Binance Coin Price Starts Recovery

After a major decline, BNB price managed to stay above the key support at $202. The price traded as low as $204 and recently started a decent increase, like Bitcoin and Ethereum.

There was a move above the $208 and $210 resistance levels. The price climbed above the 23.6% Fib retracement level of the main decline from the $234 swing high to the $204 low. Besides, there was a break above a major bearish trend line with resistance near $213 on the 4-hour chart of the BNB/USD pair.

BNB price is now trading above $214 and the 100 simple moving average (4 hours). On the upside, it is facing resistance near the $219.50 and $220 levels.

BNB Price Prediction

Source: BNBUSD on TradingView.com

The 50% Fib retracement level of the main decline from the $234 swing high to the $204 low is also near $220 to act as a hurdle. A clear move above the $220 zone could send the price further higher. The next major resistance is near $228, above which the price might rise toward $235. A close above the $235 resistance might set the pace for a larger increase toward the $250 resistance.

Another Drop in BNB?

If BNB fails to clear the $220 resistance, it could start another decline. Initial support on the downside is near the $214 level and the 100 simple moving average (4 hours).

The next major support is near the $210 level. If there is a downside break below the $210 support, the price could drop toward the $204 support. Any more losses could send the price toward the $202 support.

Technical Indicators

4-Hours MACD – The MACD for BNB/USD is gaining pace in the bullish zone.

4-Hours RSI (Relative Strength Index) – The RSI for BNB/USD is currently above the 50 level.

Major Support Levels – $214, $210, and $202.

Major Resistance Levels – $220, $228, and $235.