The company completed a restructuring in the wake of its decision to exit services related to its MEV-Boost Relay, a type of software used by Ethereum network validators.
Protocol Village: VitaDAO, a ‘DeSci DAO,’ Launches Matrix Biosciences
The latest in blockchain tech upgrades, funding announcements and deals. For the week of Oct. 9-15, with live updates throughout.
Ethereum Price Topside Bias Vulnerable Unless It Surges Past $1,665
Ethereum price is slowly moving lower toward the $1,600 support against the US dollar. ETH remains at risk of more losses unless it clears $1,650 and $1,665.
- Ethereum is struggling to stay above the $1,600 support zone.
- The price is trading below $1,640 and the 100-hourly Simple Moving Average.
- There is a connecting bullish trend line forming with support near $1,620 on the hourly chart of ETH/USD (data feed via Kraken).
- The pair could start a fresh increase if it clears the $1,650 and $1,665 resistance levels.
Ethereum Price Holds Support
Ethereum made another attempt to gain strength above the $1,650 resistance. ETH failed to settle above the $1,650 level, struggled to clear $1,665, and underperformed vs Bitcoin.
A high was formed near $1,664 before the price saw a fresh decline. It retested the $1,620 support. A low has formed near $1,617 and the price is now attempting another recovery wave. There was a minor increase above the $1,625 level.
Ethereum is now trading below $1,640 and the 100-hourly Simple Moving Average. There is also a connecting bullish trend line forming with support near $1,620 on the hourly chart of ETH/USD.
On the upside, the price might face resistance near the $1,640 level or the 100-hourly Simple Moving Average. It is close to the 50% Fib retracement level of the recent decline from the $1,664 swing high to the $1,617 low.
The next major resistance is $1,650 or the 76.4% Fib retracement level of the recent decline from the $1,664 swing high to the $1,617 low. The main resistance is still near the $1,665 level. A close above the $1,665 resistance might send the price toward the key resistance at $1,750.
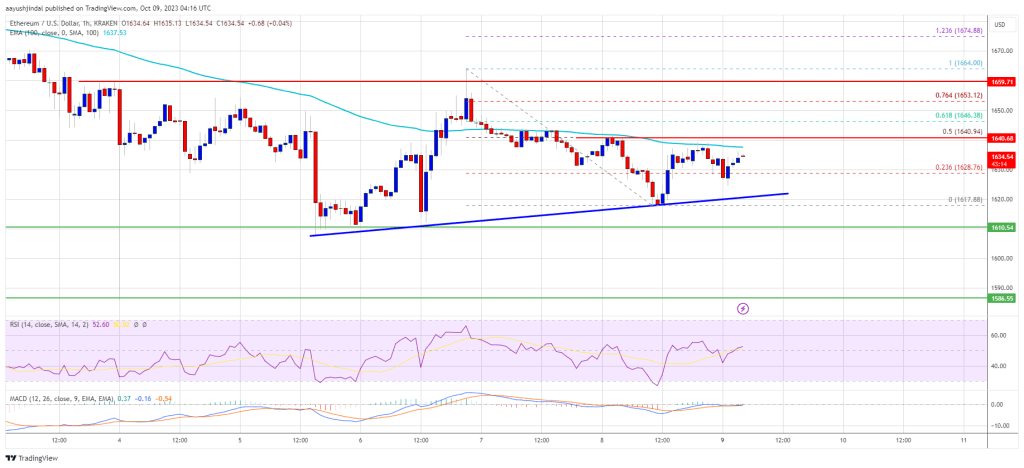
Source: ETHUSD on TradingView.com
To start a decent upward move, Ether must settle above the $1,720 and $1,750 levels. The next key resistance might be $1,850. Any more gains might open the doors for a move toward $1,920.
More Losses in ETH?
If Ethereum fails to clear the $1,665 resistance, it could continue to move down. Initial support on the downside is near the $1,620 level. The next key support is $1,600.
The first major support is now near $1,585. A downside break below the $1,585 support might start another strong decline. In the stated case, the price could revisit the $1,540 level. Any more losses may perhaps send Ether toward the $1,500 level.
Technical Indicators
Hourly MACD – The MACD for ETH/USD is losing momentum in the bearish zone.
Hourly RSI – The RSI for ETH/USD is now below the 50 level.
Major Support Level – $1,600
Major Resistance Level – $1,665
Coinbase Ranks As Second Largest ETH Staking Entity As Lido’s Dominance Raises Concerns
Prominent crypto exchange Coinbase has emerged as the second largest ETH staking entity based on a recent scoop by Chinese reporter Colin Wu. This development comes amidst growing concerns about network centralization in regard to Lido’s dominance in the ETH staking market.
Coinbase Accounts For 14.1% Of ETH Staking Activity – Report
According to Wu, a report from Dragonfly data scientist hildobby, using data from Dune analytics, reveals that Coinbase presently has 3.873 million staked ETH, representing 14.1% of all staked ETH.
Coinbase dominance in the ETH staking sphere is only superseded by that of the liquid staking platform, Lido DAO, which accounts for one-third of all staked ETH.
Other platforms with a significant staking percentage include the Binance and Kraken exchanges, with a 4.2% and 3.0% market share, respectively. Meanwhile, the Figment staking pool comes third with a 4.9% market dominance.
Notably, Coinbase experienced a 44% increase in ETH staking activity over the last six months. Coincidentally, this development falls within the period during which the Ethereum Shanghai upgrade has been active.
Contrary to fears that the last Ethereum network update may induce a decline in staked ETH due to the ability to finally withdraw staked assets, the Shanghai upgrade has so far boosted stakers confidence, resulting in a net positive flow of 7.84 million ETH since its implementation in April.
At the time of writing, the total amount of staked ETH stands at 27.42 million ETH, representing 22.81 of ETH’s circulating supply.
Lido’s Growing Dominance Sparks Centralization Concerns
In other news, Wu stated there are community concerns about centralization in regard to Lido’s ETH staking dominance. Due to the Proof-of-Stake Consensus model, a higher amount of staked ETH translates to a higher voting power during governance processes.
Data from Dune Analytics shows that Lido accounts for 8.80 million staked ETH, representing 32.11% of the ETH staking market. Notably, the liquid staking platform experienced a 55% rise in staking activity over the last six months.
According to information from Ethereum’s official blog, concerns about centralization are quite valid, as any validator controlling a minimum of 33% of staked ETH can prevent the network from finalizing any block, even in the presence of a 66% majority.
Moreover, if a validator acquires 55% of the staked ETH, they could theoretically split the Ethereum chain into two forks. All these are speculations, as there is no evidence indicating that Lido DAO has any malicious intentions toward the Ethereum network.
At press time, ETH trades at $1,620.18, with a 1.36% decline in the last day, based on data from CoinMarketCap. In tandem, the token’s daily trading volume is down by 36.41% and valued at $2.86 billion.
Is Ethereum’s Staking Boom A Ticking Time Bomb? JPMorgan Weighs In
Ethereum (ETH), a forerunner in the decentralized finance (DeFi) ecosystem, has seen a notable surge in its staking activities. This staking boom has raised eyebrows among experts from JPMorgan concerned over ETH’s increase in centralization and the consequences that may arise.
Ethereum, aiming to transition to a proof-of-stake consensus mechanism, opened the floodgates for staking. This meant holders could ‘stake’ or lock their tokens to support network operations like block validation. However, while this promises rewards for the stakers, JPMorgan analysts have reported that there could be ripple effects.
Ethereum Centralization Concerns Rise To The Surface
JPMorgan analysts, led by Nikolaos Panigirtzoglou, highlight the inadvertent increase in Ethereum’s network centralization, particularly post the Merge and Shanghai upgrades. The Ethereum network became “more centralized as the overall staking yield declined,” they noted.
According to the analysts, what’s leading to this centralization could be attributed to liquid staking providers. Lido, a notable player, has been pinpointed for its dominant role. The JPMorgan report noted:
The top 5 liquid staking providers control more than 50% of staking on the Ethereum network, and Lido specifically accounts for almost one-third.

The analysts further disclosed while platforms such as Lido tote their decentralized nature, the underlying reality appears different. The analysts said these platforms “involve a high degree of centralization.”
According to the analysts, the ramifications of such centralization can’t be understated. They mentioned that “a concentrated number of liquidity providers or node operators” might compromise the network’s integrity, leading to potential points of failure, attacks, or even conspiracy, resulting in an “oligopoly.”
They further highlighted that such centralized entities could censor or exploit user transactions, undermining the community’s interests.
The Rehypothecation Risk And Declining Rewards
Another dimension to the staking story is the looming threat of ‘rehypothecation.’ In simple terms, it’s the act of leveraging staked assets as collateral across various DeFi platforms. According to the JPMorgan’s analysts:
Rehypothecation could then result in a cascade of liquidations if a staked asset drops sharply in value or is hacked or slashed due to a malicious attack or a protocol error.
Furthermore, as Ethereum continues its journey on the staking path, the staking rewards seem to diminish. The report indicated a drop in total staking yield from 7.3% before the Shanghai upgrade to roughly 5.5% recently.
Regardless, Ethereum has shown a slight upward trajectory of 1.5% in the past 24 hours, with a market price currently sitting at $1,643 and a market cap of approximately $9 billion, at the time of writing.
Featured image from Unsplash, Chart from TradingView
Ethereum Price At Risk of Sharp Decline Unless ETH Clears This Heavy Resistance
Ethereum price is slowly moving lower toward the $1,585 support against the US dollar. ETH must clear the $1,650 resistance to start a recovery wave.
- Ethereum is struggling to stay above the $1,600 support zone.
- The price is trading below $1,650 and the 100-hourly Simple Moving Average.
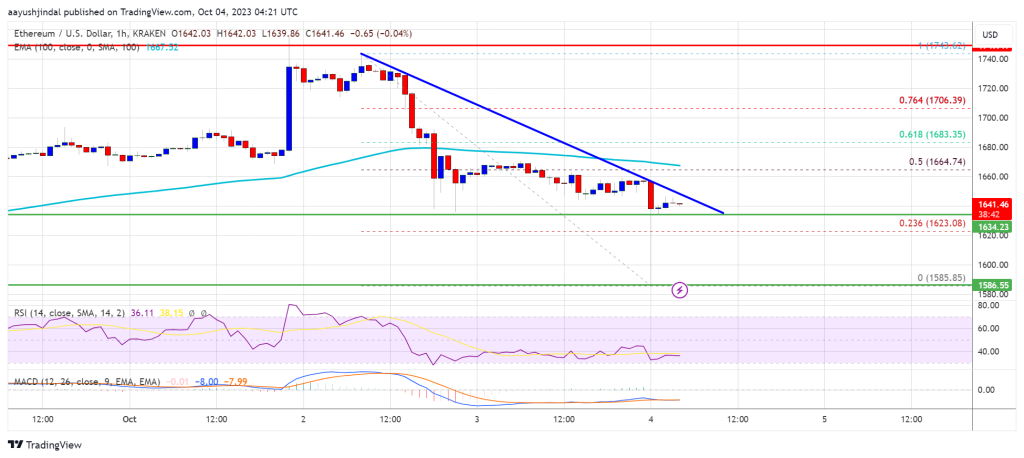
- There is a major bearish trend line forming with resistance near $1,645 on the hourly chart of ETH/USD (data feed via Kraken).
- The pair could start a fresh increase if it clears the $1,650 and $1,665 resistance levels.
Ethereum Price Grinds Lower
Ethereum attempted a recovery wave from the $1,630 zone. ETH climbed above the $1,650 resistance level but upsides were limited, like Bitcoin.
The price struggled to gain pace for a move above the $1,665 resistance level. A high was formed near $1,654 and the price reacted to the downside. It declined below the $1,620 support and even traded close to the $1,600 level. A low is formed near $1,607 and the price is now consolidating losses.
Ethereum is now trading below $1,650 and the 100-hourly Simple Moving Average. There is also a major bearish trend line forming with resistance near $1,645 on the hourly chart of ETH/USD.
On the upside, the price might face resistance near the $1,630 level. It is close to the 50% Fib retracement level of the recent decline from the $1,654 swing high to the $1,607 low. The next major resistance is $1,650, the trend line, and the 100-hourly Simple Moving Average.
The trend line is close to the 76.4% Fib retracement level of the recent decline from the $1,654 swing high to the $1,607 low. A close above the $1,650 resistance might send the price toward the key resistance at $1,665.
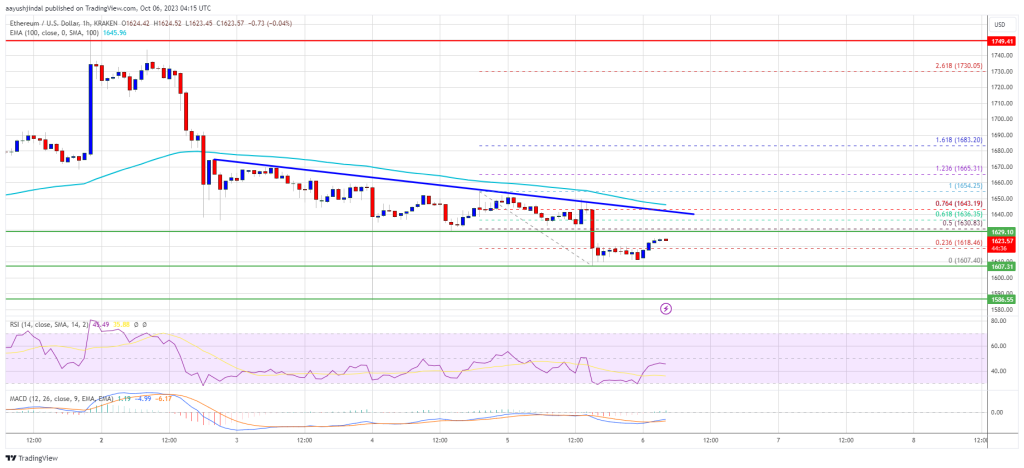
Source: ETHUSD on TradingView.com
To start a steady increase, Ether must settle above the $1,650 and $1,665 levels. The next key resistance might be $1,720. Any more gains might open the doors for a move toward $1,750.
More Losses in ETH?
If Ethereum fails to clear the $1,650 resistance, it could continue to move down. Initial support on the downside is near the $1,610 level. The next key support is $1,600.
The first major support is now near $1,585. A downside break below the $1,585 support might start another strong decline. In the stated case, the price could decline toward the $1,540 level. Any more losses may perhaps send Ether toward the $1,500 level.
Technical Indicators
Hourly MACD – The MACD for ETH/USD is gaining momentum in the bearish zone.
Hourly RSI – The RSI for ETH/USD is now below the 50 level.
Major Support Level – $1,585
Major Resistance Level – $1,665
Justin Sun Unstakes 20,000 Ethereum (ETH) From Lido Finance, What’s Going On?
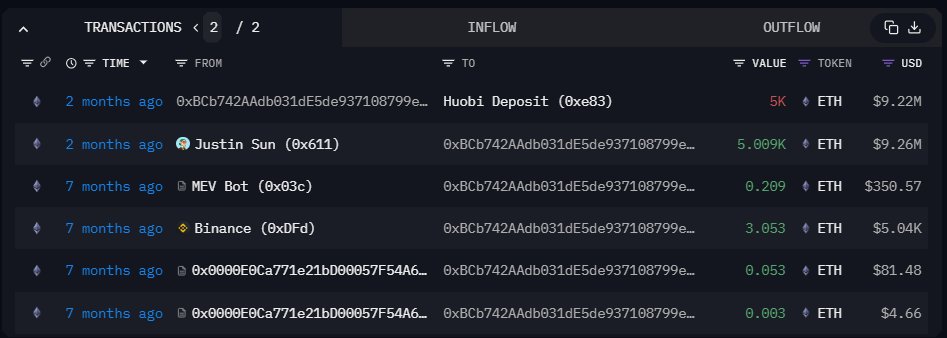
A crypto wallet associated with Justin Sun, the co-founder of Tron, a smart contract platform, has moved 20,000 Ethereum (ETH) worth roughly $32.4 million from Lido Finance, a liquidity staking platform. Funds were transferred to Binance, the world’s largest crypto exchange, trading volume and client count.
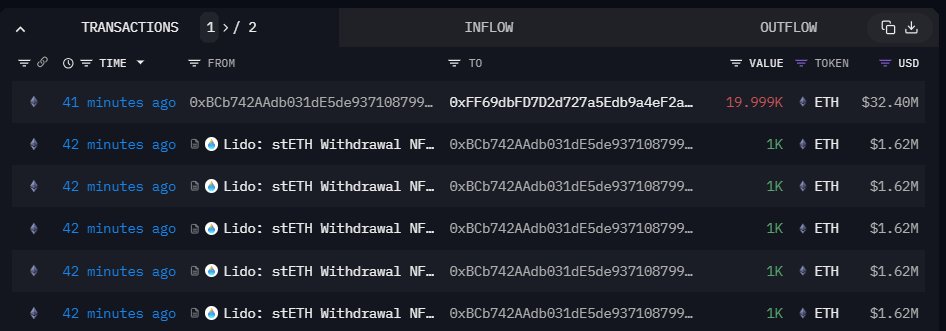
The transaction, executed in a single batch, was captured by The Data Nerd, an analysis platform, and shared on X on October 5. As it is, Ethereum (ETH) is under pressure, looking at the performance in the daily chart.
Ethereum Drops 4%, Are Bears Flowing Back?
Trackers show that the coin is down roughly 4% in three days, confirming sellers of October 2. Notably, the daily chart has a double bar formation with the bear candlestick of October 2, completely reversing buyers of October 1.
This arrangement suggests that bears could be in control, especially considering the draw-down of the past few trading days and the level of participation on October 2 when the coin slipped.
In technical analysis, losses at the back of increasing volumes often point to high participation. If prices are rising, then the coin in question could rally. Conversely, a sell-off could worsen if the bar had high trading volumes.
It is also unclear whether Justin Sun plans to sell ETH after transferring coins to exchanges. Crypto transfers to centralized exchanges, which support many stablecoins like USDT and others, are often associated with sell-offs.
Market participants may interpret such movements as bearish, fueling the sell-off, subsequently heaping more pressure on prices. ETH is now at a one-week low.
Justin Sun Shuffling ETH In 2023
The Data Nerd observes that prices fell the last time the wallet moved ETH to Huobi, which has since rebranded to HTX. In August, the wallet moved 5,000 ETH to HTX. The deposit came a week before ETH prices crashed 12%.
Bitcoin and Ethereum prices fell sharply in mid-August, causing a “cascade liquidation” that spooked investors. ETH bulls have since failed to reverse those losses. Considering the relatively low trading volumes in the last two months, prices are still boxed within the August 17 trade range, a bearish signal.
In late February 2023, Justin Sun staked 150,000 ETH, worth roughly $240 million, to Lido Finance. The transfer remains the largest single-stay transaction, forcing the liquidity staking provider to activate the Staking Rate Limit feature, capping the amount of coins one can stake at 150,000 ETH.
Lido Finance said the feature is more of a “safety valve” that “addresses possible side-effects such as rewards dilution, without needing to pause stake deposits explicitly.”
This Ethereum Metric Is Retesting The Bear-Bull Junction, Will Break Happen?
On-chain data shows the Ethereum MVRV ratio is currently testing a level that has historically served as the boundary between bear and bull markets.
Ethereum MVRV Ratio Is Retesting Its 180-Day SMA Right Now
The “Market Value to Realized Value (MVRV) ratio” is an indicator that measures the ratio between the Ethereum market cap and realized cap. The former is naturally just the total supply valuation at its spot price. At the same time, the latter is an on-chain capitalization model that calculates the value differently.
The realized cap assumes that the real value of any coin in circulation isn’t the spot price (which the market cap refers to) but the price at which it was last bought/transferred on the blockchain.
One way to look at the realized cap is that it represents the total amount of capital that the investors have put into the cryptocurrency, as it considers each holder’s cost basis or buying price.
Since the MVRV ratio compares these two capitalization models, it can tell us whether the investors hold more or less value than they initially invested in Ethereum.
The indicator’s usefulness is that it may serve as a way to determine whether the asset’s price is fair or not right now. When the investors hold a value significantly more than they put in (that is, they are in high profits), they would be more tempted to sell, and hence, the spot price could face a correction.
Similarly, the holders as a whole being in deep losses can instead be a signal that the bottom might be near for the cryptocurrency, as it’s becoming quite underpriced.
Now, here is a chart shared by analyst Ali on X, which shows the trend in the Ethereum MVRV ratio, as well as its 180-day simple moving average (SMA), over the past few years:
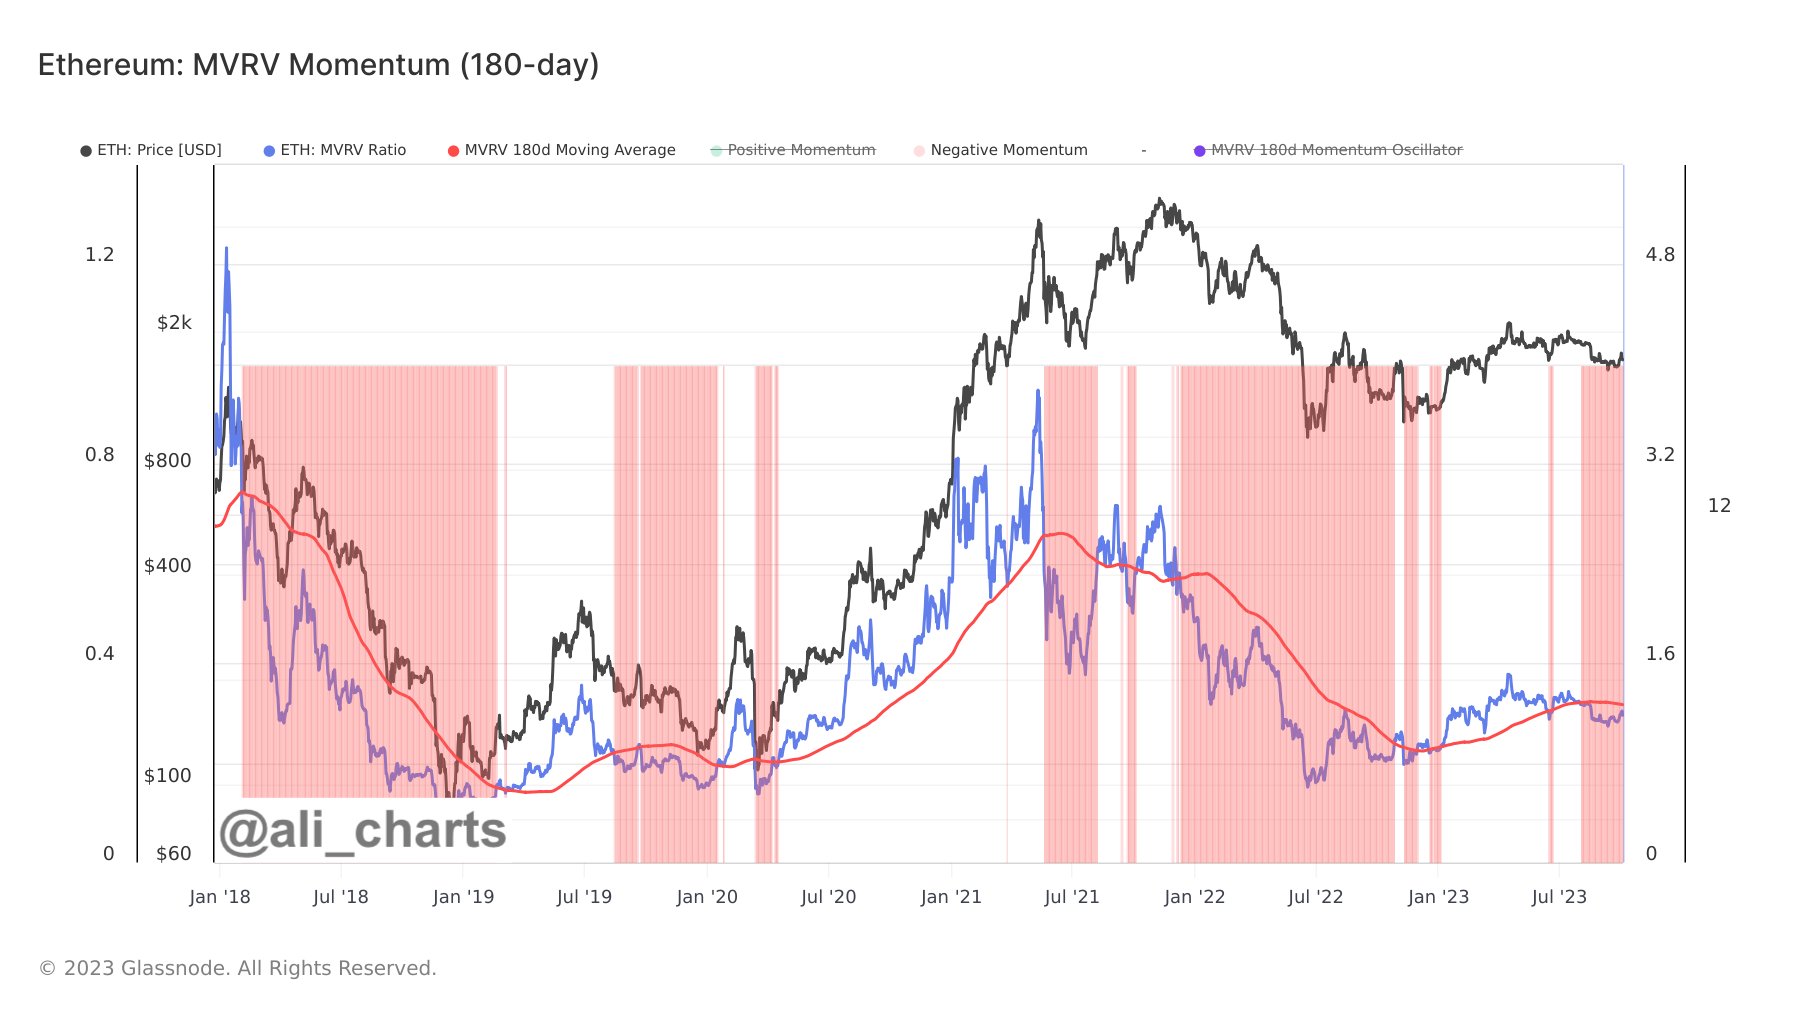
The 180-day SMA of the ETH MVRV ratio has interestingly held significance for the cryptocurrency. According to Ali, “Ethereum market cycles transition from bearish to bullish when the MVRV (blue line) breaks strongly above the MVRV 180-day SMA (red line).”
During the bear market last year, the ratio had been below the 180-day SMA line, but with the rally that began this year in January, the metric had managed to break above the level, and bullish winds supported the asset once more. During the recent struggle for the asset, however, the MVRV has again slipped under the level.
Nonetheless, in the past few days, the ETH MVRV has been trending up a bit and approaching another retest of this historical junction between bearish and bullish trends.
It remains to be seen whether a retest will happen in the coming days for Ethereum and if a break towards the bullish territory can be found.
ETH Price
2024 Crypto Cliffhanger: VC Firm Co-Founder Warns of Bitcoin, Ethereum Collapse
In a recent post, investor Chris Burniske expressed the belief that a bottom is looming for the top cryptocurrencies. Burniske predicts that Bitcoin and Ethereum could dip as low as $20,000 and $1,000, respectively, with top altcoins, except Solana (SOL), hitting new lows.
Notably, BTC retraced from $28,000 to slightly above $27,600, with ETH seeing a similar decline in the past few days.
Crypto Analysts Predicts Market Bottom Ahead Of Bull Run
According to the founder of Placeholder Capital, Chris Burniske, a bull market will likely begin soon. However, the analyst believes the upcoming bull run will be preceded by a bottom cycle in the present financial quarter (Q4 2023). Furthermore, Burniske believes that this bottom will lead to declining crypto prices.
According to his analysis, fear is high but only temporarily, as sellers are exhausted. Burniske believes the predicted lows for the top cryptocurrencies will present attractive buying opportunities in preparation for the upcoming bull market.
Fear is high, but temporally and price-wise, selling exhaustion is near imo. Sure $BTC could go to low $20Ks & $ETH to low $1Ks & most everything long-tail (except $SOL) can hit new lows, but when we look back on Q4 2023 & Q1 2024 it’ll be clear it was a good time to be a buyer. https://t.co/I6hpKCw1Q8
— Chris Burniske (@cburniske) October 4, 2023
The crypto analyst supported his predictions with Linear charts, stating that it is easy to spot tops and bottoms with such charts. For context, Linear charts show the change in the price of an asset. Burniske believes it is up to traders to choose their accumulation style with patience and persistence.
What Lies Ahead For Bitcoin And Ethereum?
Bitcoin trades at $27,697, with a 0.56% price increase in the last 24 hours. Ethereum’s, on the other hand, is $1,639, with a 0.45% 24-hour decline.
Meanwhile, BTC has encountered stiff resistance at $28,000, leading to a decline to $27,000 in the last few days. The asset formed a bottom on the daily chart on September 11 before the buyers forced a price recovery.
Although BTC recovered slightly, the sellers have continued to re-enforce the $28,000 resistance. If the selling pressure increases, a decline to the $25,141 support level is possible in the coming days.
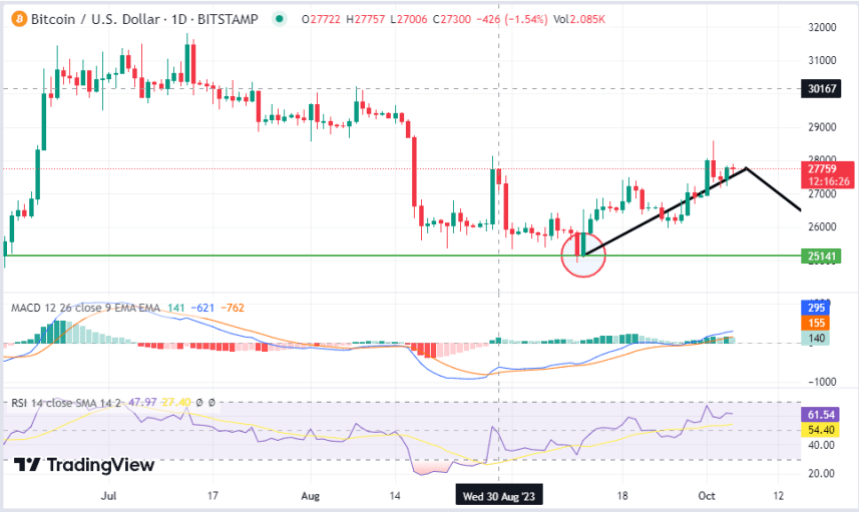
Moreover, the green MACD Histogram bars have faded, confirming a drop in buying pressure as sellers reclaim dominion. Also, the RSI is dropping from the buy zone and displays a value of 61.54.
If the RSI drops below 50, BTC may resume the downtrend in the coming days. If Bitcoin drops further, a bottom cycle will likely begin in the crypto market.
The potential decline to the $25,142 support level could facilitate a bull cycle. The reason is that it presents an attractive entry level for the accumulation phase.
Ethereum To Follow Similar Trend As Bitcoin
Also, ETH displays a similar price trend to Bitcoin, with a prominent dip likely to occur in the coming weeks. ETH is in a downtrend on the daily chart, forming lower lows as sellers continue to dominate the market.
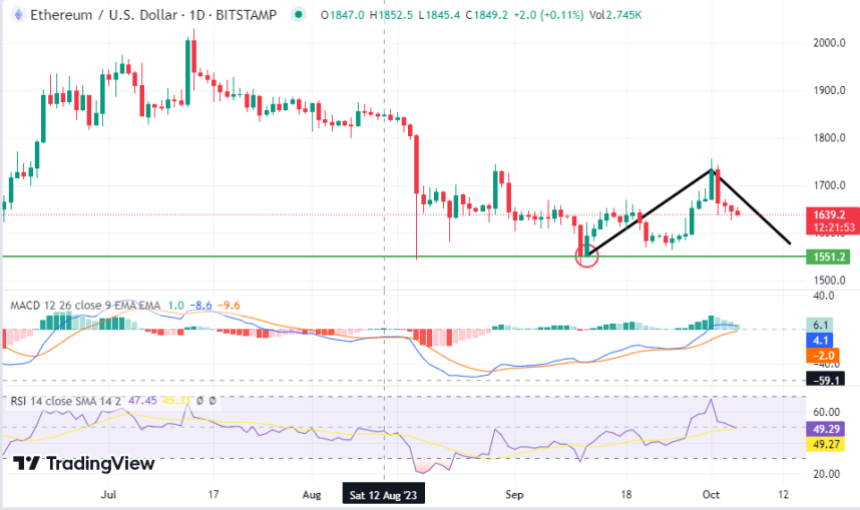
Based on its historical data, it formed a bottom on September 11, after a similar decline before rallying on September 12. Therefore, ETH will likely return to the $1551 support level to form a double-bottom pattern before another rally.
Also, its Moving Average Convergence/Divergence (MACD) shows a weak buy signal with fading bullish histogram bars. Additionally, the Relative Strength Index (RSI) indicator displays a value of 49 and will likely drop to the oversold region.
Based on ETH’s past price action, traders should expect further decline in the coming weeks before a recovery.
How Have Ethereum Futures ETFs Fared So Far? Data Reveals Shocking Numbers
Apart from Spot Bitcoin ETFs, Ethereum Futures ETFs have been the talk of the crypto industry for months as investors look toward a catalyst for the next bull run. However, data has shown the highly anticipated ETFs have had underwhelming results in trading volume.
Although the crypto market has witnessed some gains in the past few days, this hasn’t flowed into Ethereum Futures ETFs as investors seem hesitant to adopt these new Ethereum investment vehicles.
How Have Ethereum Futures ETFs Fared So Far?
Ethereum futures ETFs provide indirect exposure to the price of ETH through futures contracts and Nine Ethereum Futures ETFs were introduced to the market on Monday, October 2nd. These include ETFs by ProShares, VanEck, Bitwise, and other financial firms following a year of anticipation.
As the second biggest cryptocurrency by market cap, many expected the ETFs to take off quickly and piggyback on the early success of Bitcoin Futures ETFs. However, data shows the trading volume for these new products has remained relatively low so far.
According to a report by Bloomberg, these nine futures ETFs attracted $1.92 million in the 24 hours after launch. Most of this trading occurred in the ProShares Ether Strategy ETF which contributed over 45% of trading volume.
Pretty meh volume for the Ether Futures ETFs as a group, a little under $2m, about normal for a new ETF but vs $BITO (which did $200m in first 15min) it is low. Tight race bt VanEck and ProShares in the single eth lane. pic.twitter.com/F9AHtrVcVf
— Eric Balchunas (@EricBalchunas) October 2, 2023
According to data compiled by Bloomberg Intelligence, trading volume reached $15.6 million on Wednesday. At the moment, the inflows are being led by the VanEck Ethereum Strategy ETF (EFUT), which has $8.27 million, followed by the ProShares Ether Strategy ETF (EETH), which has $5.96 million.
Ether futures ETFs starting see some flows, not a ton, but it’s something, +$15.6m with VanEck in an early lead over ProShares.. pic.twitter.com/e0bu7T0ZLT
— Eric Balchunas (@EricBalchunas) October 4, 2023
In comparison, Bitcoin Futures ETFs registered $1 billion in trading volume within the first 24 hours after launch. But it’s important to note that the market sentiment during these two periods wasn’t the same. Bitcoin futures ETFs were launched during the peak of the 2021 crypto bull market, and cryptocurrencies have had major pullbacks since then.
Future Outlook Of ETH
While Ethereum futures ETFs provide a new way to gain exposure to Ethereum, low trading volume shows they have yet to gain major mainstream interest. These ETFs were supposed to be a sustained catalyst for the price of Ethereum, but this has not been the case.
Ethereum Spot ETFs have also been in the talks, with ARK Invest filing the first application in early September. If granted approval, spot ETFs are more likely to have a better performance than futures ETFs.
Despite Ethereum pushing over $1,700 on Monday after the launch of the futures ETFs, it has since lost all those gains. At the time of writing, Ethereum is trading at $1,630.
Ethereum Price Recovery In Jeopardy? Decoding Key Hurdles To Fresh Increase
Ethereum price is struggling to stay above the $1,620 support against the US dollar. ETH must clear the $1,665 hurdle to start a fresh increase.
- Ethereum trimmed all gains and now trading near the $1,630 level.
- The price is trading below $1,660 and the 100-hourly Simple Moving Average.
- There is a connecting bearish trend line forming with resistance near $1,650 on the hourly chart of ETH/USD (data feed via Kraken).
- The pair could start a fresh increase if it clears the $1,650 and $1,665 resistance levels.
Ethereum Price Holds Support
Ethereum managed to recover and stay above the $1,620 pivot level. Yesterday, we discussed a bearish reaction in ETH below the $1,650 level, like Bitcoin.
A swing low was formed near $1,585 before the price recovered above $1,620. It is now consolidating above the 23.6% Fib retracement level of the downward move from the $1,742 swing high to the $1,585 low. It seems like the bears are active below the $1,650 level.
Ethereum is now trading below $1,660 and the 100-hourly Simple Moving Average. On the upside, the price might face resistance near the $1,650 level. There is also a connecting bearish trend line forming with resistance near $1,650 on the hourly chart of ETH/USD.
The next major resistance is $1,665 and the 100-hourly Simple Moving Average. It is close to the 50% Fib retracement level of the downward move from the $1,742 swing high to the $1,585 low.
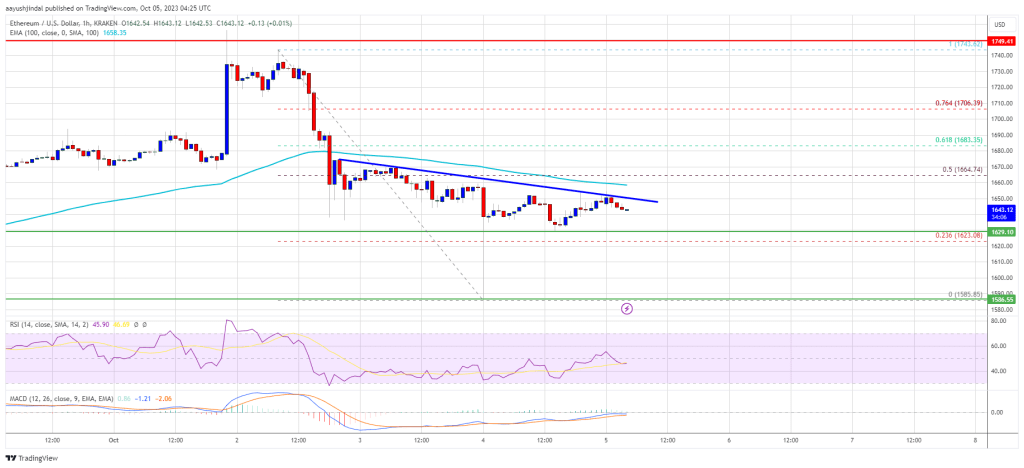
Source: ETHUSD on TradingView.com
A clear move above the $1,665 resistance zone could start a decent increase. In the stated case, the price could visit the $1,700 resistance. The next key resistance might be $1,720. Any more gains might open the doors for a move toward $1,750.
Another Drop in ETH?
If Ethereum fails to clear the $1,665 resistance, it could start another decline. Initial support on the downside is near the $1,630 level. The next key support is $1,620.
The first major support is now near $1,585. A downside break below the $1,585 support might start another strong bearish wave. In the stated case, the price could even visit the $1,540 level. In the stated case, there is a risk of a drop toward the $1,500 level.
Technical Indicators
Hourly MACD – The MACD for ETH/USD is losing momentum in the bearish zone.
Hourly RSI – The RSI for ETH/USD is now below the 50 level.
Major Support Level – $1,620
Major Resistance Level – $1,665
This Chart Is Pro-Solana: Is It Time To Sell ETH For SOL?
For the last two years, Ethereum (ETH) has outperformed Solana (SOL), looking at the performance in the weekly chart. However, according to one technical analyst on X, this is about to change, especially considering the candlestick arrangement of the SOLETH chart on the weekly chart.
Will SOL Outperform ETH In 2024 And 2025?
Sharing a screen grab, the analyst who goes by the handle “CryptoGodJohn” on X is optimistic, saying at spot rates, this can be the “right” time for traders to swap their ETH for SOL before the next leg up that will push SOL higher in the next two years.
However, whether this will pan out remains to be seen. What’s evident is that the path of least resistance appears northwards, looking at price charts.
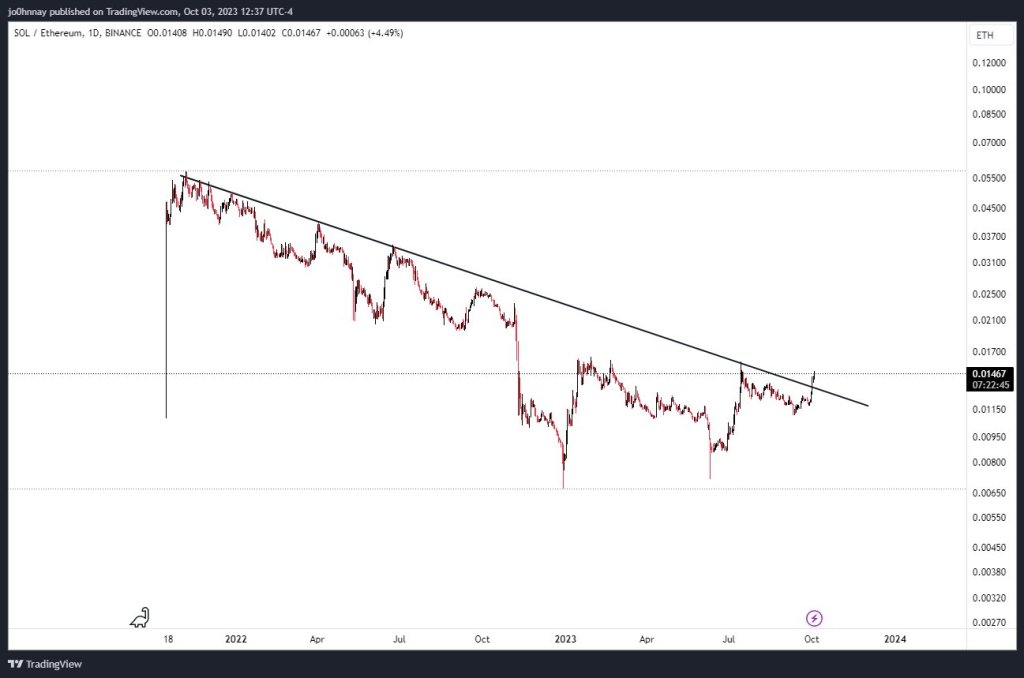
At the time of writing, SOL is up 71% versus ETH from June. Moreover, zooming in closer, SOLETH prices are teetering around critical resistance levels. Although trading volumes are relatively light and cannot be compared with those of late Q2 2023, sentiment is beginning to shift and favors SOL bulls. The sharp expansion in the year’s second half could be a statement.
The SOLETH is at 0.0134 ETH level, a liquidation level that was last retested in July and January 2023. If buyers push harder, lifting the coin above the 0.0162 ETH level at the back of rising trading volumes, bulls of mid-July will be confirmed. In that case, SOL might stretch gains towards the 0.0265 ETH level and return to the September 2022 zone.
Even so, although traders are optimistic, it is not immediately clear how prices will react at spot levels. As it is, the SOLETH in the weekly chart is facing rejection. The present bar has a long upper wick, pointing to a possible sell-off in lower time frames.
Will Solana Bulls Reverse The Post-FTX Collapse Free-Fall Of Q4 2022?
Additionally, SOLETH prices are still defined by the early November 2022 bear candlestick. The bear candlestick is wide-ranging and has high trading volumes, pointing to the rapid conversion of SOL to ETH in a moment of fear.
Around this time, FTX, a once-popular cryptocurrency exchange, collapsed. In 2021, FTX and Alameda Research, the trading wing linked to Sam Bankman-Fried, the CEO of FTX, invested $100 million in the Solana Foundation.
It is said that FTX and Alameda Research controlled over 50 million SOL. The community feared that with FTX filing for bankruptcy, the over 50 million SOL would likely be sold to repay creditors.
In the sessions ahead, whether SOL will reverse the post-FTX collapse drop remains to be seen. Should it happen, SOL gains at least 50% versus ETH.
Price analysis 10/4: BTC, ETH, BNB, XRP, SOL, ADA, DOGE, TON, DOT, MATIC

Bitcoin is consolidating at the top of its range and this is inspiring traders’ confidence in a variety of altcoins.
The Protocol: Which Ethereum Layer-2 Project ISN’T Competing to Land Celo?
In this week’s issue of The Protocol, we highlight layoffs hitting key firms as well, and how blockchain projects are competing for new mandates – specifically big Ethereum layer-2 developers like OP Labs, Polygon and Matter Labs vying to provide the technology for the Celo blockchain’s new network
Crypto Drug Cartel Ties: On-chain Investigator Drags Ethereum Into The Mess
An on-chain crypto investigator took to social media to expose the supposed black truth behind Justin Sun’s Tron but has thrown Ethereum in the mix, alleging that the cryptocurrency is backed by the CCP and may harbor crypto wallet addresses by Fentanyl traffickers.
On-Chain Detective Unveils Potential Tron Ponzi Scheme
An X (formerly Twitter) user going by the username @BoringSleuth has gained the attention of the crypto community after uncovering potential evidence of Tron allegedly being a Ponzi scheme governed by one of the world’s largest crypto criminal drug cartels.
“I showed and told the World that Tron $TRX was a massive Ponzi, run by a part of the largest criminal Cartel in the World, and connected to the CCP,” BoringSleuth said.
I showed and told the World that Tron $TRX was a massive Ponzi, ran by a part of the largest criminal Cartel in the World, and connected to the CCP.
Today, the DOJ charged 8 CCP companies with illegal drug production, distribution, and sales around Fentanyl. Over half of their… https://t.co/Yjbnv2fgPN pic.twitter.com/do4JLiAgLh
— TruthLabs
(@BoringSleuth) October 4, 2023
BoringSleuth disclosed that the United States Department of Justice (DOJ) has sanctioned eight Chinese Communist Party (CCP) companies for allegedly operating a clandestine drug production and distribution sales network around Fentanyl.
The crypto investigator revealed that more than half of the wallets owned by these companies were traced back to Tron and the remainder allegedly being on the Ethereum blockchain.
After analyzing the original sales of the TRX token, BoringSleuth stated that he had reviewed the top 20 cryptocurrency wallets in Tron’s original token sale list to decipher the owners of the wallets and how much TRX supply these wallets have acquired.
According to the investigator, out of the 20 wallets, 17 were created and owned by the infamous criminal organization disguised to represent genuine investors. He revealed that the criminal organization was connected to the CCP, and 98% of Tron’s total token supply was received by these 17 wallets.
The on-chain investigator also mentioned that cryptocurrency exchanges like Huobi Global, and cryptocurrencies like Shiba Inu may also be linked to the CCP and Wanxiang, a Chinese multinational conglomerate and the team that funded Ethereum Foundation wallets and Ethereum’s Founder, Vitalik Buterin.
Investigations Cast Shadows On Ethereum
The crypto industry has experienced a series of Ponzi schemes and rug pulls for years now, causing investors and regulators to be wary of crypto exchanges and organizations in the space.
While Tron is faced with speculations of being a well-orchestrated Ponzi scheme and having connections with the CCP, the revelation that Ethereum, the world’s second-largest cryptocurrency may be backed by the CCP and connected to companies involved in drug trafficking has left the crypto community in a paradox.
According to BoringSleuth, the CCP is allegedly supporting Ethereum and other blockchains as well as multiple Decentralized Exchanges (DEX) and Centralized Exchanges (CEX) in the crypto space.
The crypto investigator utilized a previous transaction that saw the CCP receiving 133,700 ether on a single Genesis Block address owned by the party, as a reference to a connection between Ethereum and the CCP.
BoringSleuth has also stated a potential connection between Ethereum’s Founders and the CCP, which he said he would be revealing in detail soon.
The allegations faced by Tron and Ethereum come amid the increasing scrutiny of China’s role in the cryptocurrency landscape. Although the crypto X community is presently reeling from the on-chain investigator’s hypothesis, no concrete evidence linking Ethereum to the CCP has emerged, leaving the allegations in the realm of speculation.
Ethereum Price Plunges to $1,600: Can Bulls Save the Day?
Ethereum price trimmed all gains and revisited $1,580 against the US dollar. ETH could continue to move down if it settles below the $1,600 support.
- Ethereum started a fresh decline below the $1,650 support.
- The price is trading below $1,665 and the 100-hourly Simple Moving Average.
- There is a key bearish trend line forming with resistance near $1,645 on the hourly chart of ETH/USD (data feed via Kraken).
- The pair could start a fresh increase if it clears the $1,650 and $1,665 resistance levels.
Ethereum Price Revisits Support
Ethereum’s price failed to stay above the $1,665 level and moved into a bearish zone. ETH extended its decline below the $1,650 level, like Bitcoin.
The decline was such that the price even spiked below the $1,600 on Kraken. The price retested the key support at $1,585. A low was formed near $1,585 and the price is now attempting a fresh increase. There was a move above the $1,620 level.
Ether climbed above the 23.6% Fib retracement level of the downward move from the $1,743 swing high to the $1,585 low. Ethereum is now trading below $1,665 and the 100-hourly Simple Moving Average.
On the upside, the price might face resistance near the $1,650 level. There is also a key bearish trend line forming with resistance near $1,645 on the hourly chart of ETH/USD. The next major resistance is $1,665 and the 100-hourly Simple Moving Average.
Source: ETHUSD on TradingView.com
The 50% Fib retracement level of the downward move from the $1,743 swing high to the $1,585 low is also near the $1,665 level. A clear move above the $1,665 resistance zone could set the pace for a fresh increase. In the stated case, the price could visit the $1,700 resistance. The next key resistance might be $1,750. Any more gains might open the doors for a move toward $1,820.
More Losses in ETH?
If Ethereum fails to clear the $1,665 resistance, it could continue to move down. Initial support on the downside is near the $1,620 level. The next key support is $1,600.
A downside break below the $1,600 support might start another strong bearish wave. In the stated case, the price could even trade below the $1,585 level. In the stated case, Ether could visit the $1,540 level.
Technical Indicators
Hourly MACD – The MACD for ETH/USD is losing momentum in the bearish zone.
Hourly RSI – The RSI for ETH/USD is now below the 50 level.
Major Support Level – $1,600
Major Resistance Level – $1,665
The Great Crypto Shuffle: How 2017’s Top 100 Coins Fared In The Rollercoaster Market
A recent analysis by an analyst has painted a clearer picture of just how volatile the crypto market has been, especially for those who took their chances on lesser-known altcoins a few years back.
The analyst studied the top 100 cryptocurrencies as they stood in December 2017 and found that the fortunes of these digital assets varied significantly over the past six years.
From Prominent To Obscure: The Rise And Fall Of 2017’s Crypto Stars
Six years in the financial world is relatively short, but it can seem like an eternity for the fast-paced crypto market. An X (formerly known as Twitter) user named davanai shared his analysis of the top 100 cryptos in 2017, revealing some startling figures.
Out of the top 10 cryptos, New Economic Movement (XEM) is the only one that has dropped out of the top 100 list. On the other hand, previous giants like Monero and Dash are teetering on the brink of exiting the elite group.
Amid these declines, the twin towers of the crypto world, Bitcoin (BTC) and Ethereum (ETH), have held their positions at 1st and 2nd spot, respectively. XRP, among the most discussed cryptos in the 2017 bull run, has slipped only slightly to the 5th position.
Cardano (ADA), too, while losing two spots, remains in the top ten. However, not all stories are of resilience. Populous Coin (PPT), once the 19th largest crypto, is now a shadow of its former self, trading at 99.97% below its all-time high.
Distinguishing The Winners From The Losers
Interestingly, the analyst classified 27 of the top 100 cryptocurrencies as “scams”. While this doesn’t directly confirm any deceit, these digital currencies have nearly vanished in terms of market presence and activity.
Out of the top 100, just 21 achieved record highs during the initial three months of 2021, while 68 remain below their highest valuations from 2017 or “almost a scam,” according to the analyst.
Research statistics:
5 of 20 are worth more than ATH 2021
27 of 100 SCAM project
68 of 100 are below ATH 2017 or almost a scam
— davanai
(@0xdavanai) October 2, 2023
On the brighter side, three altcoins have climbed up in their rankings since 2017. Binance Coin (BNB), Chainlink (LINK), and Dogecoin (DOGE) have defied the broader trend, proving that it’s not all doom and gloom in the altcoin world.
The findings provide a cautionary tale for crypto investors. As the analyst pointed out, purchasing the top 100 cryptos would likely result in losses over time. As traditionally understood, diversification may not apply in the high-stakes world of crypto investing.
• You should buy altcoins with a clear understanding of the situation, and not relying on luck
• Don’t listen to fables about diversification, because only 3 out of 100 tokens are profitable in the long run
• Cryptocurrency profitability is about mindset and strategy
— davanai
Featured image from Unsplash, Chart from TradingView
Ethereum ETFs Face Lackluster Debut From Small Investors: Is The Hype Fizzling Out?
Yesterday’s launch of futures-based Ethereum (ETH) exchange-traded funds (ETFs) delivered underwhelming results, with shallow trading volumes indicating a deficient demand for ETH exposure.
Furthermore, a recent report by The Wall Street Journal report by The Wall Street Journal, it was revealed that the launch of the first Ethereum exchange-traded funds on Monday generated little interest from small investors.
These ETFs provided individual investors access to the second-largest cryptocurrency through brokerage accounts. However, per the report, most of the futures-based Ether ETFs ended the day in the red, with a combined trading volume of less than $2 million.
Red Flags For Ethereum ETFs?
The Ether ETFs, offered by prominent asset management firms such as ProShares, VanEck, and Bitwise Asset Management, are entering a highly competitive market. Experts believe these funds will have to compete fiercely in cost and marketing strategies to attract investors amidst the crowded landscape.
Eric Balchunas, senior ETF analyst at Bloomberg Intelligence, expressed his concerns regarding the funds, stating:
A lot of these funds are going to struggle to get assets. There’s probably only room for one stud in this race.
During a Bloomberg TV appearance, Balchunas emphasized the relatively low trading volume of the Ethereum ETFs compared to BITO, a Bitcoin (BTC) ETF that tracks the price of BTC using Bitcoin Futures launched in 2021.
Notably, the trading environment for the first futures-based Ether ETFs differs significantly from the first futures-based Bitcoin ETFs. ProShares’ initial Bitcoin ETF (BITO) debut, which took place during the peak of the crypto bull market, was one of the most highly traded ETF launches ever.
Conversely, on the inaugural trading day of Ether future ETFs, the value traded amounted to nearly $1.9 million by noon, with Valkyrie emerging as the frontrunner in the race for Ether futures ETFs. Initially focused on Bitcoin futures and later expanded to include Ether, the fund experienced a 3.9% increase.
VanEck’s EFUT managed to generate some volume by launching ahead of its competitors. However, volumes quickly dwindled, with a staggering 49% of EFUT’s daily volume occurring within its first trading minute.
Disappointing Launch Day For Futures-Based ETH
Senior analyst of k33 research, Vetle Lunde, suggests that this lackluster launch points to more choppy market conditions ahead. The highly anticipated launch day failed to meet market expectations, reminiscent of the underwhelming debut of Bakkt.
This sheds light on a seemingly “non-existent” demand for additional crypto exposure, indicating a continuation of the current consolidation range in the market.
In defense of the lackluster ETF launch, it is worth noting that activity in crypto ETFs has been consistently shallow in recent months. BITO, for example, has witnessed consistent outflows since mid-July and experienced its third-lowest average daily volume (ADV) in September 2023, surpassed only by volumes in August and December 2022.
The Ethereum futures products launched on Monday, along with their respective net expense ratios, include:
- BitWise Ethereum Strategy ETF (AETH) – 0.85%
- Bitwise Bitcoin and Ether Equal Weight Strategy ETF (BTOP) – 0.85%
- ProShares Ether Strategy ETF (EETH) – 0.95%
- ProShares Bitcoin & Ether Equal Weight Strategy ETF (BETE) – 0.95%
- Bitcoin & Ether Market Cap Weight Strategy ETF (BETH) – 0.95%
- VanEck Ethereum Strategy ETF (EFUT) – 0.66%.
The disappointing debut of futures-based ETH ETFs underscores the challenges in generating substantial investor interest in crypto ETFs. As the crypto market continues to evolve, market participants will closely monitor developments and assess the impact on investor sentiment and the future of crypto ETFs.
Featured image from Shutterstock, chart from TradingView.com
Optimism network launches testnet fault-proof system in pursuit of decentralization

OP Labs implemented its modular fault-proof system on the OP Goerli testnet.
Ethereum Price Trims Gains But Here’s Why ETH Could Start Fresh Rally
Ethereum price corrected gains from the $1,750 zone against the US dollar. ETH is holding the key $1,620 support and might start a fresh rally.
- Ethereum is correcting gains from the $1,755 high.
- The price is trading below $1,700 and the 100-hourly Simple Moving Average.
- There was a break below a connecting bullish trend line with support near $1,690 on the hourly chart of ETH/USD (data feed via Kraken).
- The pair could start a fresh increase unless there is a close below the $1,620 support.
Ethereum Price Corrects Gains
Ethereum’s price extended its increase above the $1,720 level. ETH even spiked above the $1,750 resistance zone before the bears appeared, like Bitcoin.
A high was formed near $1,755 before there was a downside correction. There was a move below the $1,700 support level and the 100-hourly Simple Moving Average. The price declined below the 50% Fib retracement level of the upward move from the $1,583 swing low to the $1,755 high.
Besides, there was a break below a connecting bullish trend line with support near $1,690 on the hourly chart of ETH/USD. Ethereum is now trading below $1,700 and the 100-hourly Simple Moving Average.
However, the price is still above the 61.8% Fib retracement level of the upward move from the $1,583 swing low to the $1,755 high. On the upside, the price might face resistance near the $1,670 level and the 100-hourly Simple Moving Average.
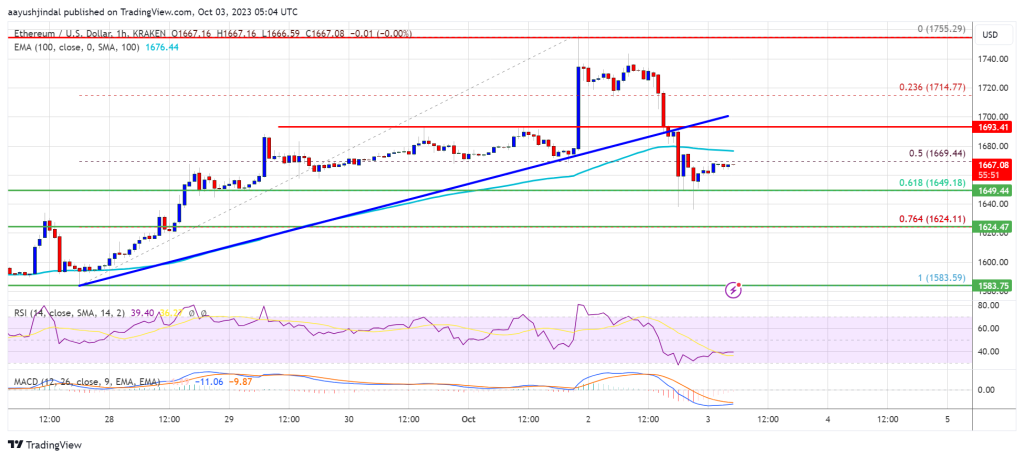
Source: ETHUSD on TradingView.com
The next major resistance is $1,700. A clear move above the $1,700 resistance zone could set the pace for a fresh increase. In the stated case, the price could visit the $1,750 resistance. The next key resistance might be $1,820. Any more gains might open the doors for a move toward $1,880.
More Losses in ETH?
If Ethereum fails to clear the $1,700 resistance, it could continue to move down. Initial support on the downside is near the $1,650 level. The next key support is $1,620.
A downside break below the $1,620 support might start another strong bearish wave. In the stated case, there could be a drop toward the $1,580 level. Any more losses might call for a test of $1,550.
Technical Indicators
Hourly MACD – The MACD for ETH/USD is losing momentum in the bearish zone.
Hourly RSI – The RSI for ETH/USD is now below the 50 level.
Major Support Level – $1,620
Major Resistance Level – $1,700


