Chainlink (LINK) Forms Bullish Pattern That Led To 50% Rally On Average

On-chain data shows that a Chainlink indicator is currently forming a pattern that has led to an average 50% increase for LINK in the past.

Chainlink 30-Day MVRV Ratio Has Plunged

In a new post on X, analyst Ali discussed the latest trend in Chainlink’s 30-day MVRV ratio. The “Market Value to Realized Value (MVRV) ratio” is a popular on-chain indicator that tracks the ratio between LINK’s market cap and realized cap.

The market cap naturally refers to the total valuation of the asset’s circulating supply at the current spot price. In contrast, the realized cap is a different type of capitalization model that calculates the total value of the cryptocurrency by instead taking the price at which each coin in circulation last moved on the network as its “true” value.

Since the last transaction of any coin was probably the last time it changed hands, the price at its time would signify its current cost basis. As such, the realized cap sums up the cost basis of every coin in circulation.

In this view, the realized cap would be nothing but a measure of the total capital the investors have used to purchase the asset. In contrast, the market cap represents the value that they are holding right now.

The MVRV ratio compares these two models, and its value can provide hints about whether the overall market holds more or less than it puts into Chainlink.

In the context of the current topic, the 30-day version of this indicator is of focus, which restricts itself to only the investors who bought within the past month. Here is the chart shared by the analyst that shows the trend in this LINK indicator over the past couple of years:

Chainlink MVRV Ratio

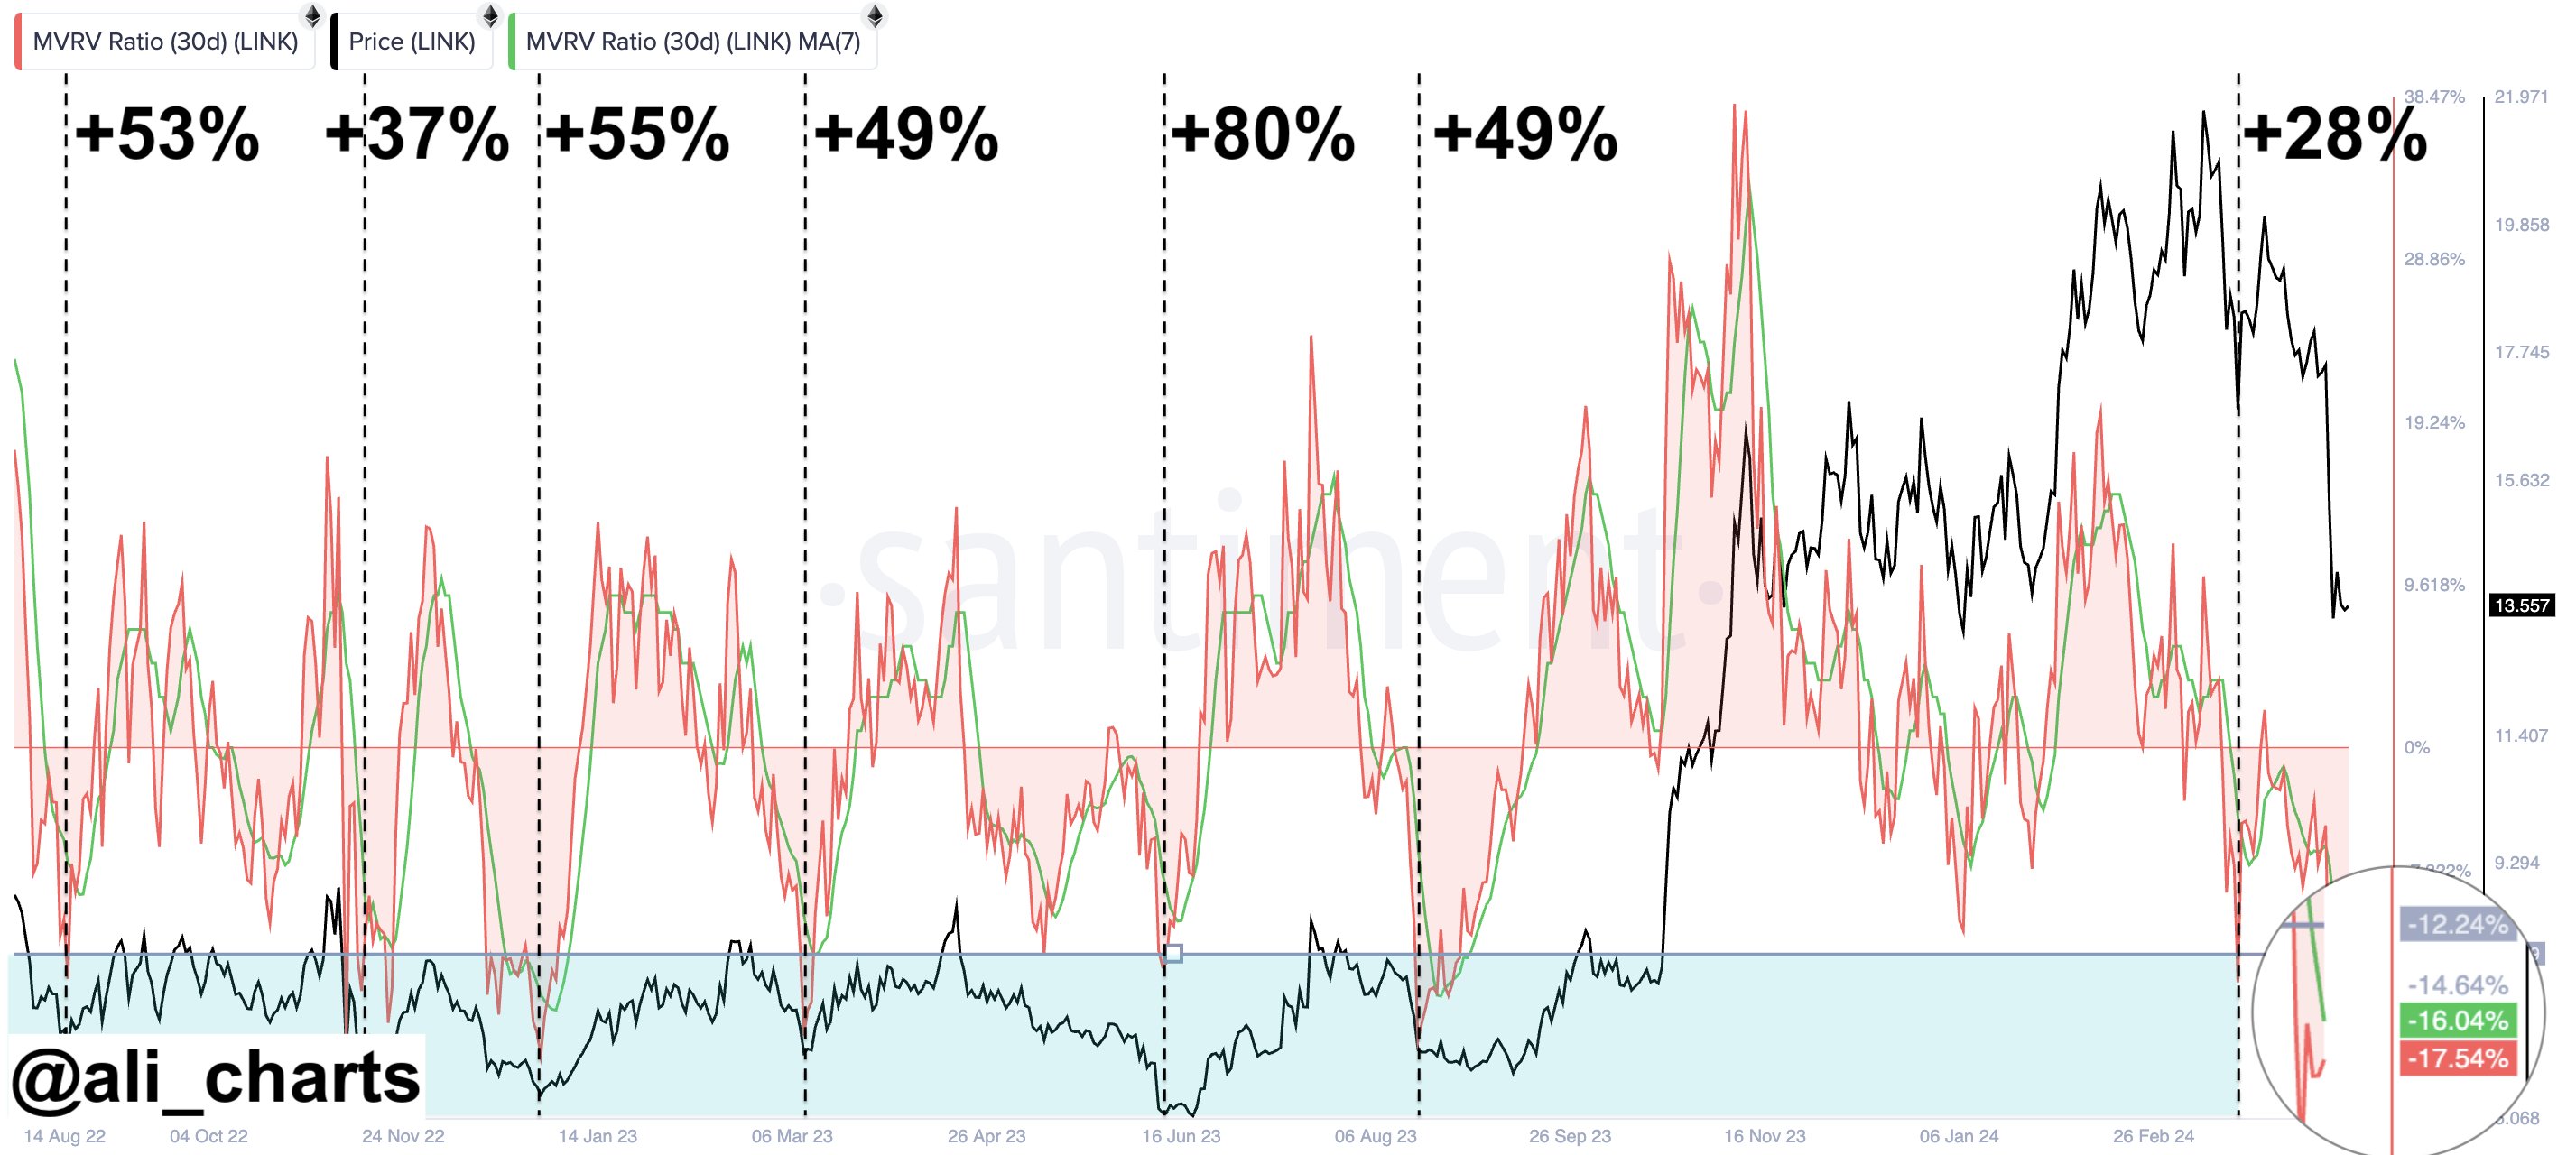
As displayed in the above graph, the Chainlink 30-day MVRV ratio has recently taken a sharp plunge and dipped under the 0% mark. The 0% mark is where the market cap and realized cap are exactly equal, so below it, the latter would be greater than the former.

When this is the case, the investors are carrying losses. This recent plunge into the negative has naturally come for the metric as the cryptocurrency’s price has plummeted, putting the 30-day buyers underwater.

In the chart, Ali has highlighted a specific pattern that Chainlink appears to have followed regarding this indicator, plunging deep into the negative territory. “Each time Chainlink MVRV 30-Day Ratio has dropped below -12.24% since August 2022, it’s signaled a prime buying opportunity, averaging 50% returns!” notes the analyst.

Recently, the indicator has declined towards 17.54%, meaning it’s below this level, which has historically led to profitable buying windows for the coin. It remains to be seen whether the pattern followed in the last two years will hold this time as well.
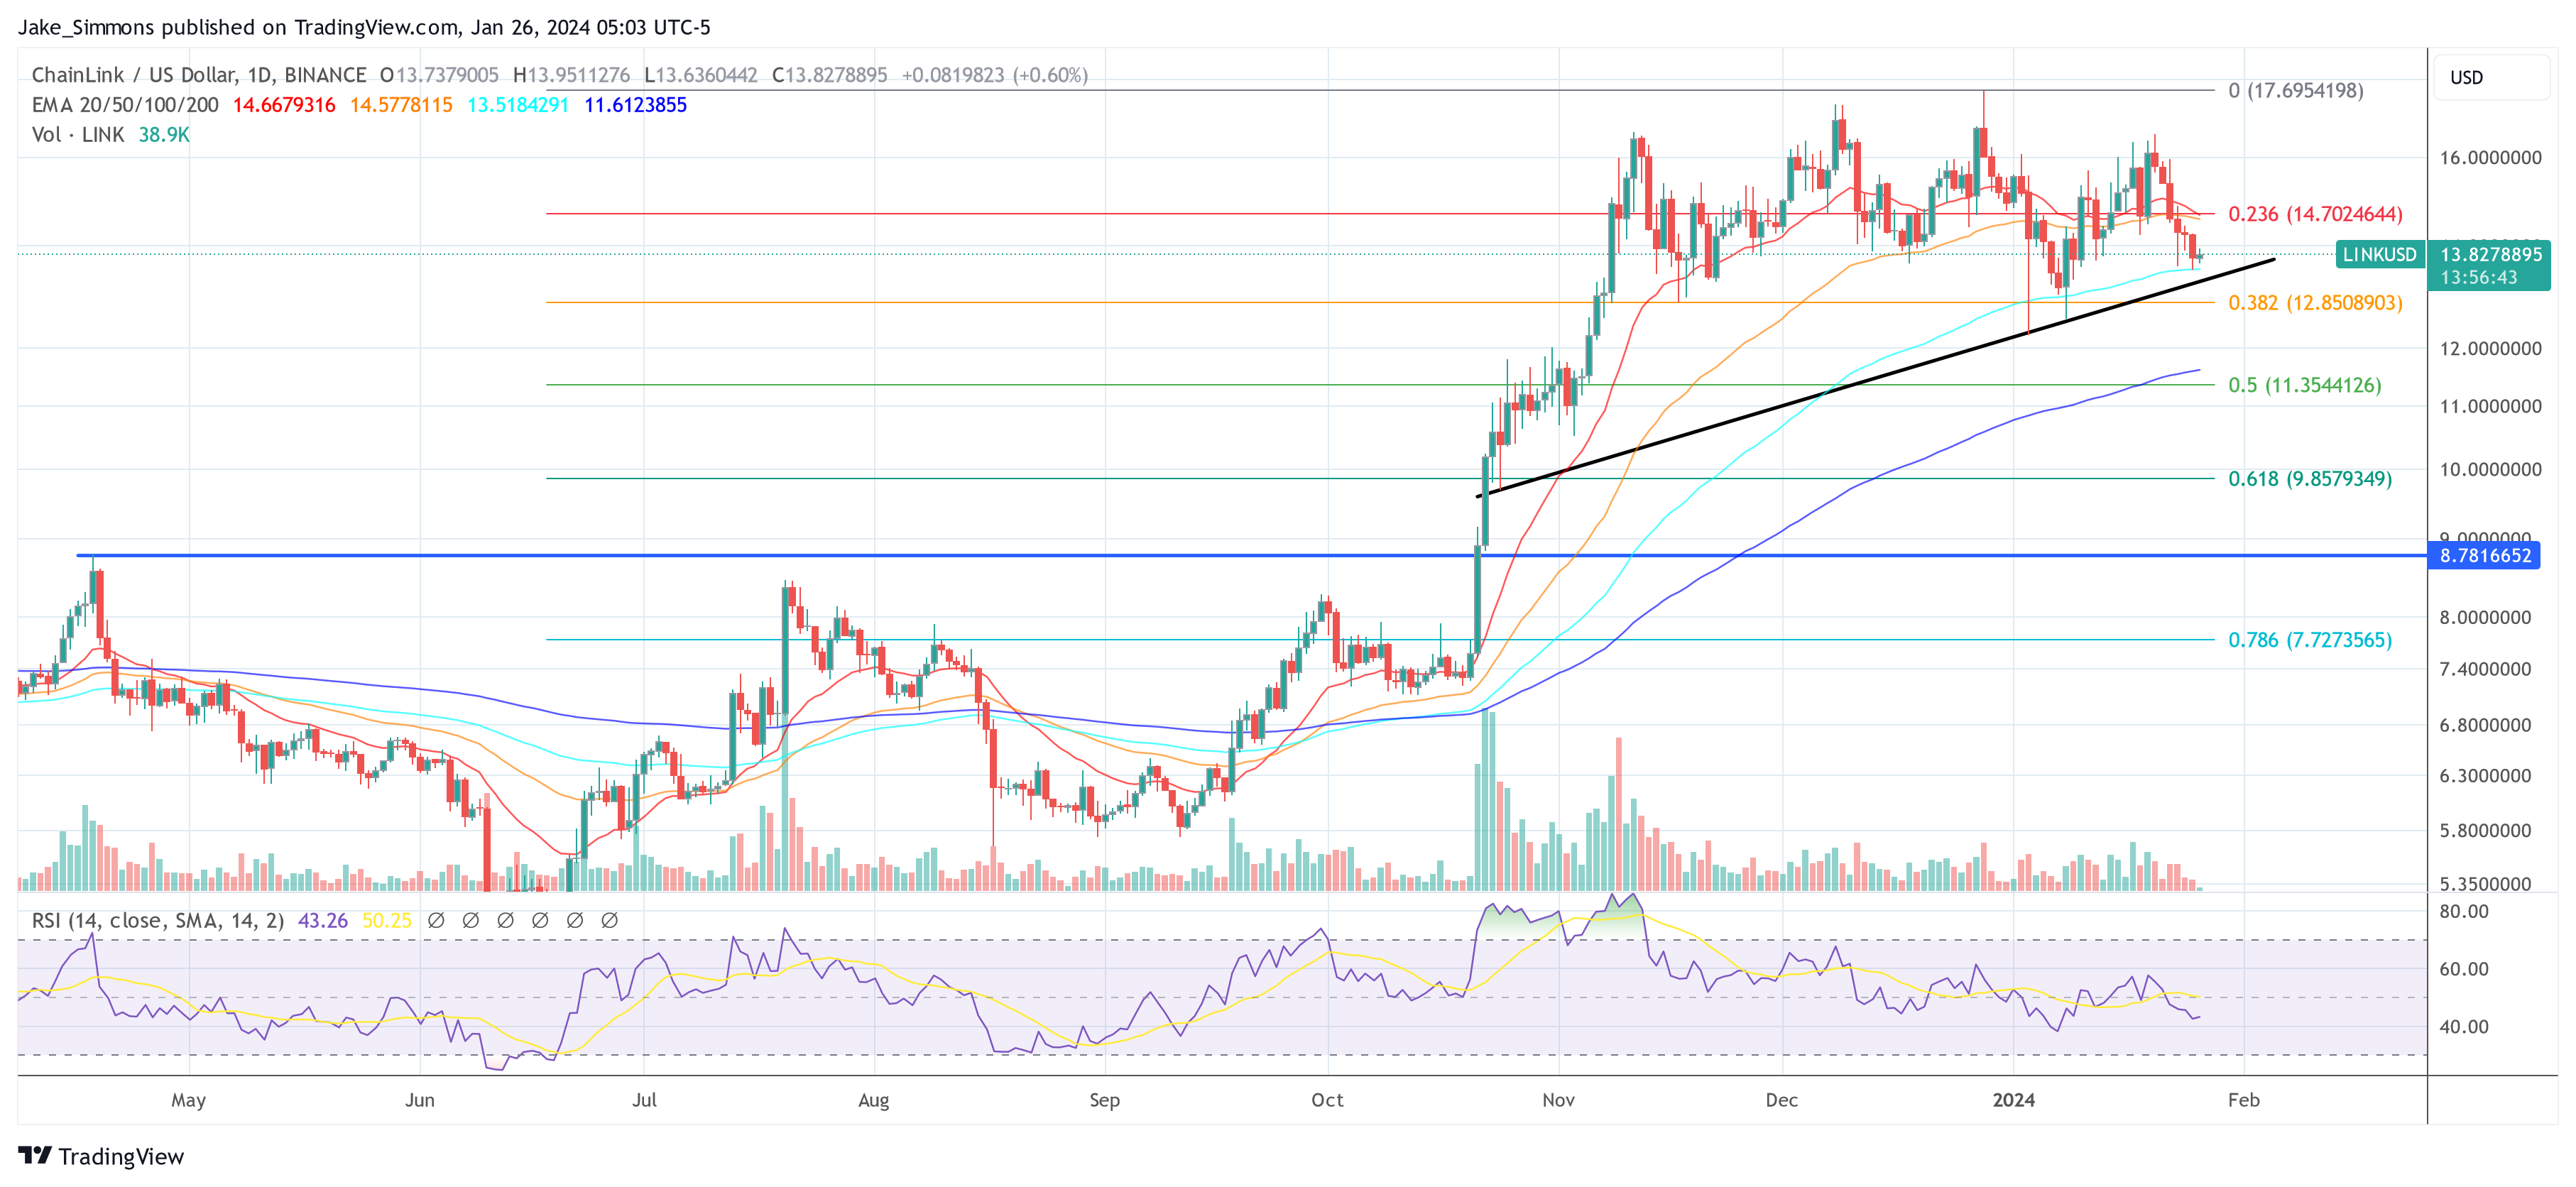
LINK Price

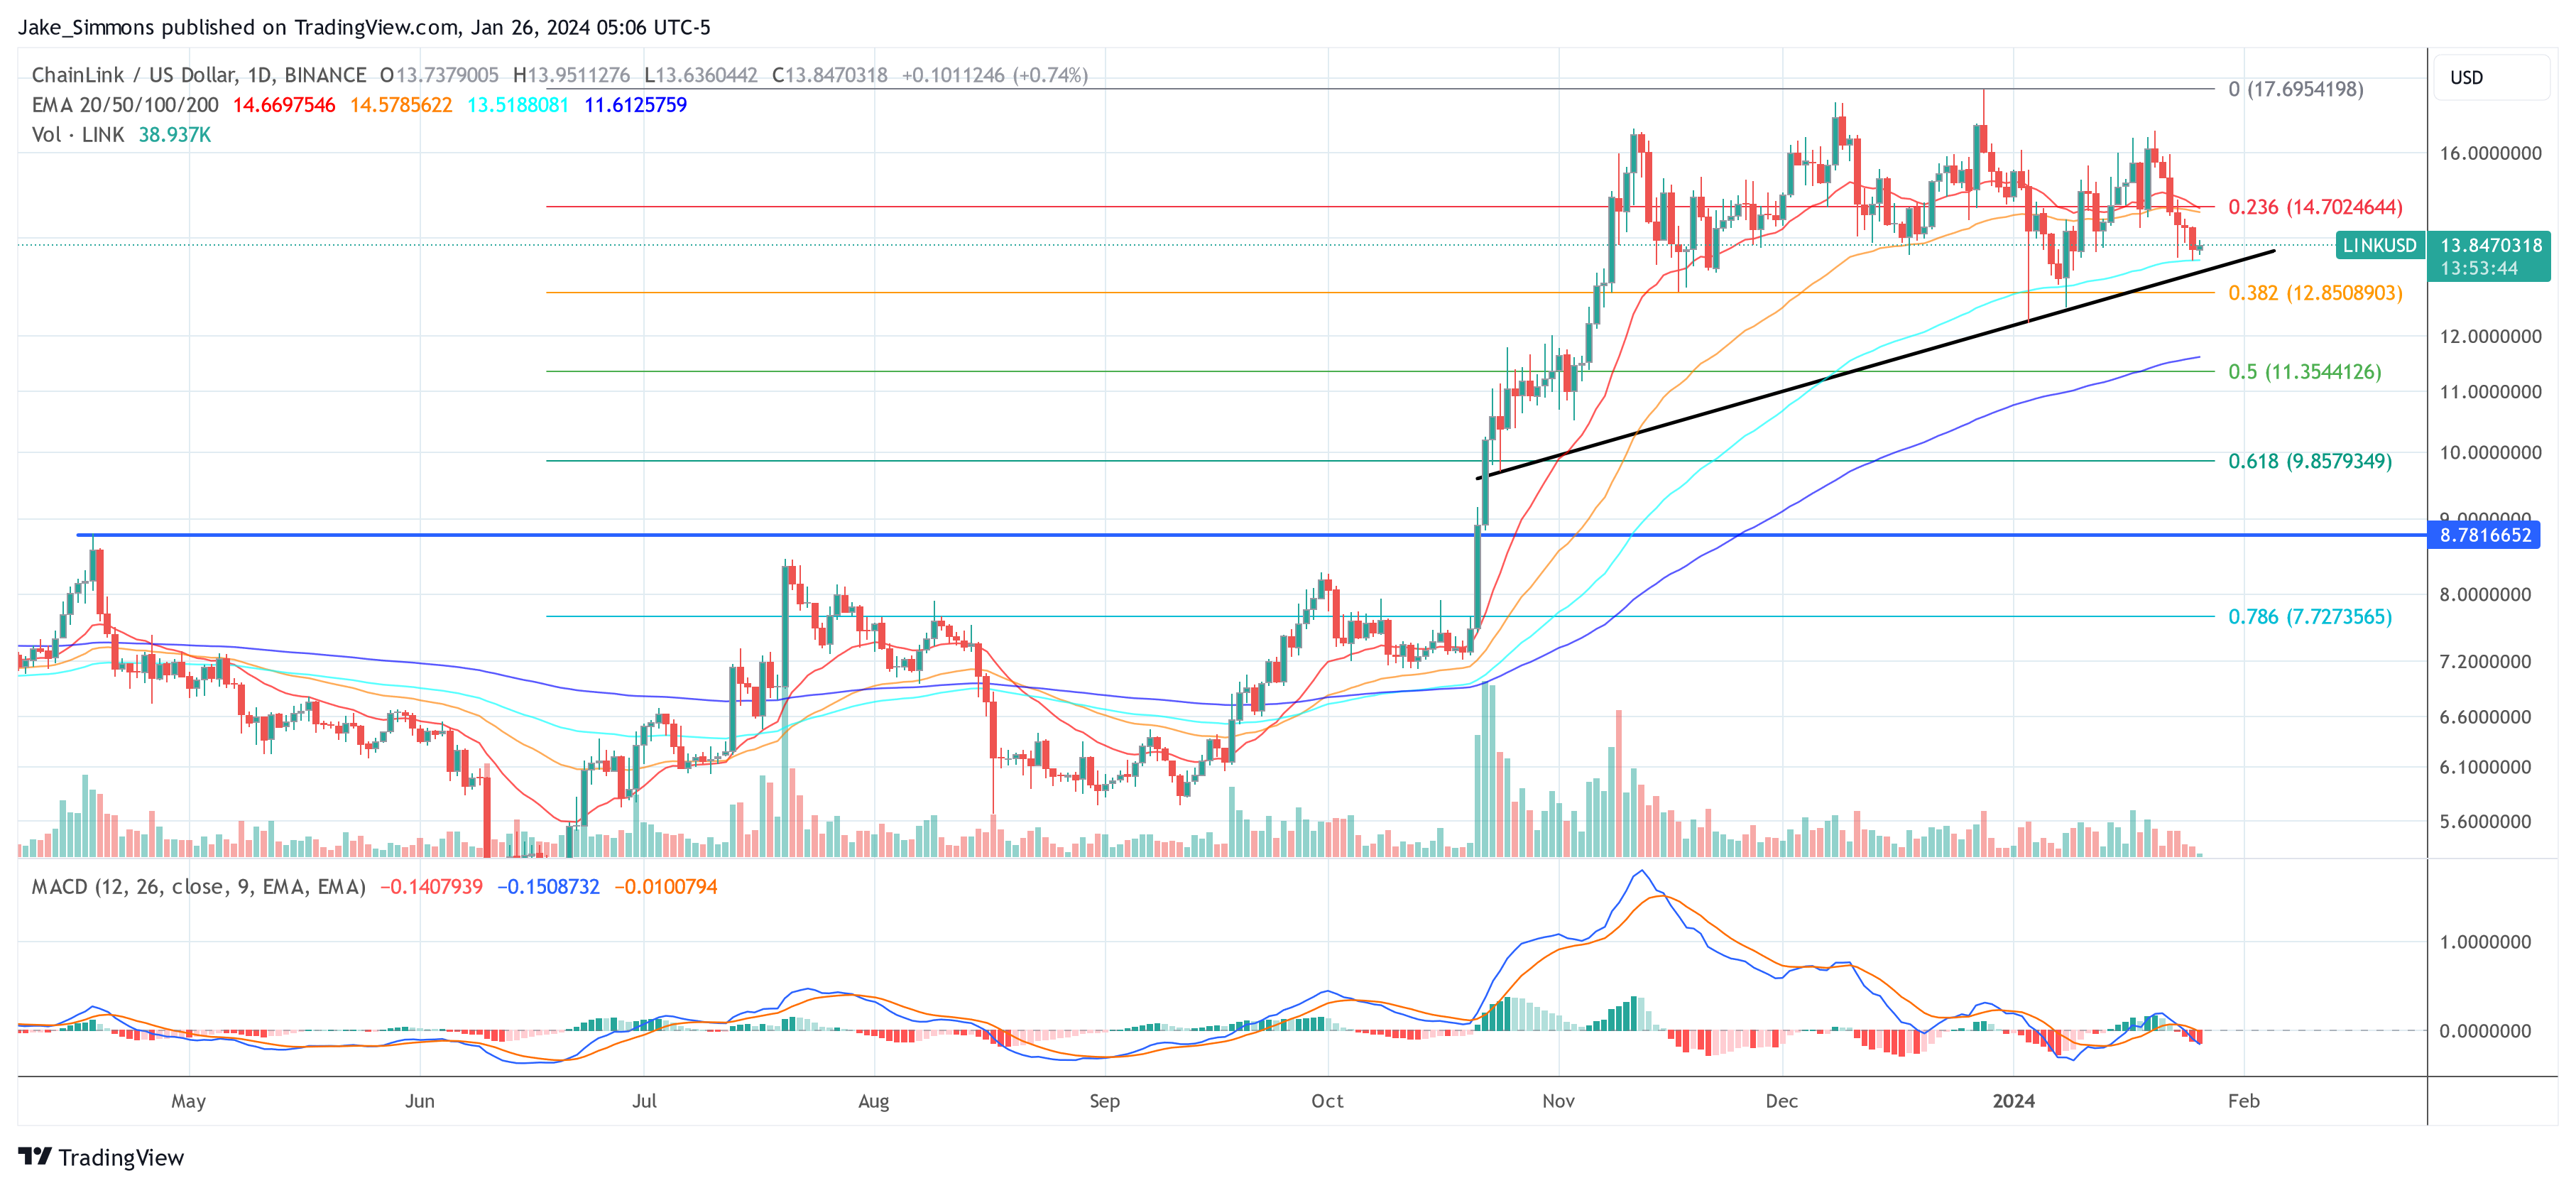
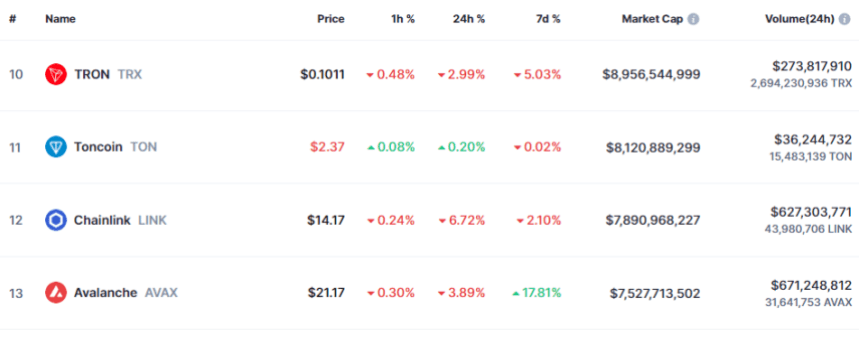
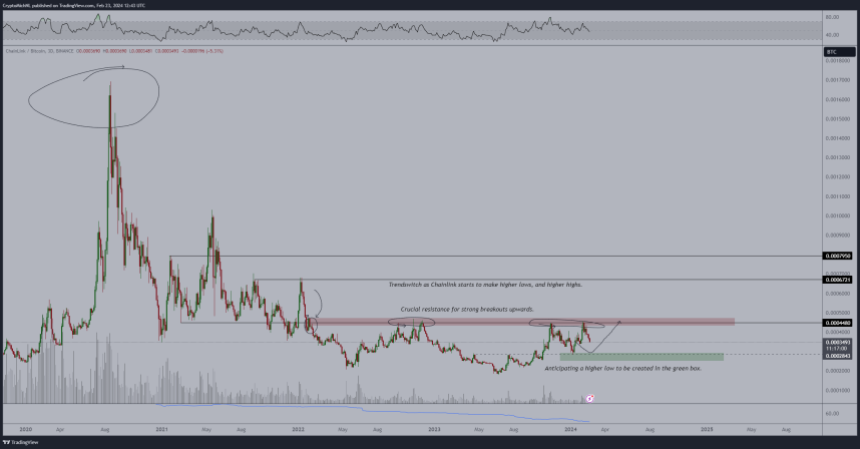
The past week has been terrible for Chainlink investors. The asset’s price has plunged by more than 23%, coming down to just $13.3 now.

Chainlink Price Chart

Analyst Forecasts $40 Target For Chainlink (LINK)

Chainlink (LINK) continues to remain among the headlines following a negative performance, which saw the token’s price decline by 7.63% in the last week based on data from CoinMarketCap. However, despite this discouraging price loss, investors and market experts appear to remain bullish on the altcoin. For instance, popular crypto analyst Michaël van de Poppe has recently released a price prediction that states LINK could double its market price in the coming months.

Chainlink (LINK) Poised To Notch 122% Gains, Analyst Says

In a Friday post on X, Michaël van de Poppe presented a bullish case for Chainlink using the LINK/BTC 3-day chart. The analyst began his prediction by noting LINK’s positive stint in the first two weeks of February, during which the token rose by 32.77% to trade above the $20 price mark.

However, despite this impressive price gain, the prominent altcoin failed to breach a crucial resistance zone at 0.00480 BTC, thus failing to initiate a breakout. Following this event, van de Poppe believes that Chainlink is now seeking a higher low to serve as its support level.  For context, a higher low In technical analysis refers to a pattern on a price chart in which a successive low point in a trend is higher than the previous low point. It is usually interpreted as a bullish signal indicating a potential trend reversal or continuation of an upward trend.Chainlink

After successfully finding its higher low, van de Poppe anticipates LINK to experience a price reversal, gaining by 4,500 satoshis, which is currently valued at $2.29 at the current Bitcoin price of $50,761. Thus, Chainlink could soon return above the $20 mark. Furthermore, the analyst believes this price gain could lead to LINK finally initiating a breakout, hitting a price in the range of $30-$40 within the next few months. If this prediction proves true, the altcoin could experience a potential maximum gain of 122.71% on its present market price.

LINK Price Overview

At press time, Chainlink continues to exchange hands at $17.96 with a 0.11% gain in the last day. Meanwhile, the token’s daily trading volume has experienced a slight decline of 0.70% and is now valued at $426.65 million. Based on market shares, Chainlink is ranked as the 12th largest cryptocurrency with a total market cap value of $10.55 billion.

Chainlink

LINK trading at $17.944 on the daily chart | Source: LINKUSDT chart on Tradingview.com

Chainlink Open Interest Sitting At Record Levels, What This Means For Price

Chainlink has seen its open interest spike significantly in the month of February, so much so that it has reached new all-time highs. This trend has not waned despite the decline in the price of the cryptocurrency, which could paint a rather bullish picture for the LINK price going forward.

Chainlink Open Interest Crosses $450 Million

The Chainlink open interest ended the month of January on a high note and carried this trend into the month of February. A major jump was seen between January 31 and February 3 when the open interest went from below $250 million to more than $320 million.

In the days following this, the open interest continued to rise, and eventually hit a peak of $533 million. This was significant because it was not just the highest point for the year but it is the highest that the open interest has ever been for the asset.

Chainlink Open interest

As expected, the price would quickly rise to keep up with the open interest as investors continued to place their bets on the price. There has been a retracement in the open interest. However, Chainlink has continued to maintain more than $450 million in open interest since February 12.

Currently, Coinglass data shows that the Chainlink open interest is $456 million as of February 23, continuing to maintain a high level. Given this, it might be prudent to look at how the LINK price has reacted in the past when open interest remained elevated.

Historical Performance Of The LINK Price

While the Chainlink open interest is at record levels, there have been times in the past where the open interest had been elevated for a period of time like it is now. So, how the price reacted during those periods could provide a pointer for how it might perform now.

The last time that the open interest was this elevated for a long period of time was back in October-November 2023 when open interest more than doubled. It would maintain this elevated level for almost a month, but at the end of it, the LINK price would react positively and saw a price surge from $11 to $15, which was a 36% increase in price.

If this scenario were to repeat now, then a 36% increase would send the LINK price to $24. This is not particularly hard to believe, given that the LINK price had topped out at $52 in the last bull market. So, such a move would still leave it 50% below its all-time high levels.

On the flip side of this, the open interest levels could also taper off, as was seen in November 2023. This could see the LINK open interest lose its hold on the $450 million that it maintained in February and fall toward $400 million before recovering again.

Chainlink Bulls Brace For Explosive Growth Following $216 Million Whale Accumulation

Chainlink (LINK), the oracle network powering smart contracts across the crypto landscape, is making waves with a recent surge in whale activity. Data reveals $216 million worth of LINK tokens withdrawn from the Binance exchange by a staggering 83 separate wallets, sending the token price on a parabolic trajectory.

Whales On A Feeding Frenzy

On-chain analytics platform Lookonchain paints a fascinating picture of the ongoing accumulation binge. Their findings suggest a coordinated effort, with distinct wallets withdrawing massive amounts of LINK. While the possibility of a single entity pulling the strings remains unconfirmed, the sheer volume of tokens amassed hints at a major shift in institutional participation within the Chainlink ecosystem.

This coordinated accumulation, especially the withdrawal of such a significant sum from a major exchange like Binance, raises intriguing questions, some analysts say. It could reflect growing institutional confidence in Chainlink’s long-term potential, particularly with initiatives like the Cross-Chain Interoperability Protocol (CCIP) expanding its reach.

Adding fuel to the fire, IntoTheBlock data reveals an additional $129 million stacked up by whales over the past 24 hours alone. This relentless buying pressure has translated directly to price action, with LINK experiencing a meteoric rise of 6% in the past week and a staggering 20% in the past month.

Chainlink Fundamentals Shine

While whale activity often grabs headlines, Chainlink’s underlying fundamentals paint an equally compelling picture. As the leading oracle provider in the Web3 space, Chainlink acts as a bridge between smart contracts and real-world data, enabling them to access secure and reliable information off-chain. This critical role fuels countless DeFi projects, positioning Chainlink as a cornerstone of the burgeoning decentralized finance landscape.

Moreover, Chainlink boasts a relentless development team, consistently rolling out new features and upgrades. Notably, the recent introduction of CCIP further enhances the network’s cross-chain compatibility, opening doors to a wider range of smart contract applications. This unwavering commitment to innovation further strengthens the investor case for Chainlink.

Parabolic Dreams: Will LINK Take Flight?

With bullish sentiment surging and whales circling, the question on everyone’s lips is: can LINK sustain its upward trajectory? While predicting the future of any crypto asset remains a perilous endeavor, analysts are cautiously optimistic. The confluence of strong fundamentals, whale accumulation, and a growing user base creates a fertile ground for further price appreciation.

Analysts said the ongoing accumulation by whales, coupled with Chainlink’s solid fundamentals, suggests a potential parabolic run. However, caution is warranted. The crypto market remains volatile, and profit-taking could trigger corrections. Nevertheless, LINK’s long-term prospects appear bright, making it an asset worth watching closely.”

Whether LINK’s price soars to parabolic heights or faces turbulence in the near future, one thing remains clear: the recent whale activity and unwavering developer commitment have thrust Chainlink back into the spotlight, solidifying its position as a key player in the ever-evolving blockchain landscape.

Featured image from Adobe Stock, chart from TradingView

Chainlink Appetite: Whale Scoops Up $84 Million Worth Of LINK, And Counting – Details

The cryptocurrency market has been abuzz with excitement as a mysterious Chainlink (LINK) whale embarks on a remarkable shopping spree, accumulating an astonishing volume of LINK tokens. Recent data from Lookonchain reveals that this enigmatic whale wallet has acquired more than 4.5 million LINK tokens over the course of just three days. Based on the current LINK price, this accumulation is valued at a staggering $84 million.

Chainlink Whales Surge, Holders Optimistic

This relentless accumulation activity by the Chainlink whale has captured the attention of analysts and investors, generating anticipation for a potential future surge in the LINK price. The market is rife with speculation as traders eagerly await the outcome of this significant accumulation.

But it’s not just the whale that is showing interest in Chainlink. Santiment’s data indicates a noteworthy increase in the total number of Chainlink holders. Over the past few months, the count of LINK holders has grown by approximately 9,000, reaching a substantial total of 717,000 holders. This surge in holders further fuels the growing optimism surrounding Chainlink’s future prospects.

Adding to the intrigue, Chainlink holders are actively withdrawing their LINK holdings from exchanges. A closer look at the supply on exchanges reveals a recent trend where holders are moving their LINK away from these platforms. Currently, the supply on exchanges represents only about 21.5% of the total supply, indicating a strong belief among holders that a potential future price rally is on the horizon.

Despite experiencing some fluctuations in recent days, the overall price trend for Chainlink remains robust. On the daily timeframe, the LINK price has been oscillating within the $18 price range for several days following a surge into this range on February 1st.

Chainlink Price: Bullish Momentum

As of now, the price sits at around $20.40, reflecting a 12% and 16% increase in the last 24 hours and seven days, with a Relative Strength Index (RSI) remaining above 60, indicating a resilient bullish trend.

These developments within the Chainlink ecosystem have created an atmosphere of eager anticipation among investors and enthusiasts. The whale’s accumulation, the growth in LINK holders, and the withdrawal of LINK from exchanges all contribute to the mounting excitement surrounding a potential future surge in price.

Meanwhile, LINK’s positive funding rate signals a prevailing bullish sentiment, indicating a higher demand for long positions among traders. The simultaneous increase in LINK’s Open Interest further suggests that market participants are leveraging their positions to go long.

This confluence of factors reflects a collective confidence in LINK’s upward potential, with traders expressing optimism through both funding decisions and larger leveraged positions, potentially fueling continued bullish momentum in the market.

Featured image from Adobe Stock, chart from TradingView

Chainlink Breeds New Whales As $49.9 Million Accumulation Spree Cause Prices To Surge

Chainlink (LINK) has traders buzzing as its price has been up by 40% since the last week of January, massively outpacing the broader cryptocurrency market. Amidst this price spike, mysterious whale wallets have been topping up their holdings, as evidenced by on-chain data. 

According to blockchain tracker Lookonchain, there’s been a massive outflow of LINK from crypto exchange Binance in the past two days, particularly with 49 new wallets receiving 2,745,815 LINK within this timeframe. 

Massive LINK Accumulation Occurs On Binance Before Withdrawal

Details from Binance point to an ongoing accumulation of LINK from the crypto exchange. In the middle of this accumulation, a particular whale or institution has been going on a buying spree, gobbling up more than 2.7 million LINK tokens worth $49.9 million. This accumulation came days after the Lookonchain noticed that four new wallets had withdrawn over 119,583 LINK tokens worth over $2.15 million from Binance.

Similarly, Lookonchain noted that another whale address “0x2A19” has withdrawn 494,957 LINK tokens worth $9 million from Binance in the past 10 days. Notably, whale transaction tracker Whale Alerts has also noted some accumulation of LINK tokens from other crypto exchanges.

Analytics platform Santiment also noted that LINK whale addresses have upped their activity amidst the price surge as large amounts of coins were moved by previously stagnant wallets. This influx of tokens back into the network’s circulation, coupled with a minor liquidation of wallets, seems to have contributed to the price spike.

How Will New Chainlink Whales Impact Price Action Going Forward?

The crypto industry is currently going through a modest price gain led by Bitcoin recently breaking above the $44,000 level again. As a result, the industry is now up by 3.25% in the past 24 hours, with a 22.60% increase in trading volume. 

LINK hasn’t been left out of this price gain, registering a 4.30% gain in the past 24 hours. However, LINK has been on a sustained breakout since January, reaching as high as $19.68 on February 5. 

The price spike isn’t particularly surprising, as fundamentals of the Chainlink ecosystem point to a steady price growth for LINK. Chainlink’s role in DeFi and NFTs with its smart contracts oracles cannot be overstated. Chainlink also recently released its Staking v0.2 protocol in December, allowing investors to stake a minimum of 1 LINK for a base floor reward rate of 4.5% per year in LINK.

Consequently, the massive accumulation of LINK by whales is a very bullish signal for the token’s price action going forward. These large investors see LINK’s long-term value and potential and are loading up their bags in anticipation of higher prices.

LINK price chart from Tradingview.com (Chainlink whales)

Dogecoin Trounced: Chainlink’s 34% Jump Kicks DOGE Out Of Top 10 List

After Chainlink’s impressive run of more than 34% over the past week, LINK has dethroned Dogecoin (DOGE) from the top 10 crypto by market cap list.

Chainlink Has Pulled Away From The Crowd With A Sharp Surge Recently

While most cryptocurrency sectors have observed minimal movement recently, Chainlink has emerged as an outlier, enjoying a surge of over 34% in the last week.

The below chart shows how LINK has performed over the past month.

Chainlink Price Chart

LINK had achieved a major milestone, breaking above the $18 level earlier during this latest rally, but with a sharp 8% continuation of the run, the coin has now surged beyond the $19.5 mark for the first time since early 2022.

Should Chainlink’s surge continue, the cryptocurrency would be retesting the $20 level, which could prove to be a source of major resistance, according to on-chain data.

LINK has surged more than 38% over the past thirty days, which means it has significantly outperformed the wider sector. Bitcoin, for instance, hasn’t even been able to put together positive returns in this period, as the original cryptocurrency’s price has declined by almost 2%.

Thanks to this strong rally, Chainlink has changed its standing among the wider sector. Specifically, the token has shaken things up in the market cap list.

Dogecoin Has Lost Its Position In The Top 10 List To LINK

Following the rally, LINK has improved its market cap rank and is now the 10th largest cryptocurrency in the sector based on this metric. Dogecoin, holding this spot earlier, has now fallen to 11th.

The table below shows how the two assets fit in the broader sector.

Dogecoin Vs Chainlink

Although Chainlink has now surpassed Dogecoin in this metric, the gap between the two assets is still not much. This means the two coins may continue to flip each other in the coming days unless one shows diverging performance.

As LINK has arrived at this spot with a sharp surge, things may be looking favorably for the asset, especially considering that DOGE has rather put up negative returns in the past week.

The overall picture has also been a bit dire for the memecoin recently, as the chart below displays that its price has followed a sideways trajectory during the past month.

Dogecoin Price Chart

Unless things change fast for Dogecoin, its exit from the top 10 list may be here to stay. Of course, this only assumes that Chainlink itself doesn’t fall off shortly.

Chainlink Breakout: LINK Poised For 38% Rally If It Clears This Key Resistance

Decentralized oracle network Chainlink (LINK) has been making significant strides in the altcoin market, outperforming its peers with an impressive 44.8% price increase over the past 30 days. 

Surging to a 24-month high, the cryptocurrency has inched closer to the $20 mark, attracting the attention of bullish investors. Notably, the uptrend for LINK may be far from over, as it can potentially record a substantial 38% price gain by breaking through a critical resistance level.

Chainlink Trading Volume Skyrockets

Crypto analyst Ali Martinez indicates that Chainlink faces formidable resistance between its current trading price of $19.40 and $20.03, with 5,330 addresses collectively holding over 8.59 million LINK. 

Chainlink

Despite this supply wall, if Chainlink manages to break through, Ali Martinez suggests that the next critical resistance level stands at $26.87, presenting an opportunity for a significant 38% price surge.

Adding to the positive outlook, Chainlink has witnessed a surge in trading volume and an increase in circulating market cap over the past few days. 

Data from Token Terminal reveals that while Chainlink’s trading volume has steadily risen over the past 30 days, the token experienced exceptional trading volume of over $9.5 billion in the past three days alone. This surge in trading activity suggests a growing interest from investors in the Chainlink protocol.

Chainlink

Examining the circulating market cap, Token Terminal data highlights a positive trend. The circulating market cap of Chainlink stands at $10.53 billion, displaying a notable increase of 32.66% over the past 30 days. In terms of fully diluted market cap, Chainlink records $18.16 billion, indicating a substantial rise of 28.89% over the same period.

Institutional Interest In LINK?

Recent blockchain data suggests that institutional investors are actively accumulating LINK. According to Spot On Chain data, the emergence of eight wallets withdrawing a substantial amount of LINK tokens, coupled with a price surge shortly after, indicates institutional interest in the cryptocurrency. 

Over the past twelve hours, eight new wallets, likely representing a single individual or institution, have collectively withdrawn 227,350 LINK tokens, equivalent to approximately $4.12 million at the withdrawal time. 

Notably, a significant portion of these tokens was withdrawn from centralized exchanges (CEX) just before the price experienced a sudden increase of approximately 4.1%. This pattern suggests that institutions may strategically accumulate LINK tokens, anticipating future price appreciation.

Moreover, as indicated by its performance on the algorithmic market scanner Commando, LINK has consistently been a top performer in the cryptocurrency market. 

According to the market intelligence platform Decentrader, with a current score of 1.83 and a green signal on low time frames, Chainlink’s technical analysis suggests a positive outlook for the cryptocurrency. Noteworthy is the recent breakthrough of Chainlink’s price from a range held up by the 200-week moving average (200WMA). 

This breakout indicates a shift in market sentiment and a potential upward trend. The cryptocurrency is now aiming to target the “Sniper resistance” level just above $20 while finding support at the top of the previous range, around $16.8, according to Decentrader. 

Overall, institutions’ accumulation of Chainlink tokens and the cryptocurrency’s technical breakout point to growing confidence in LINK’s investment potential. 

The withdrawals from centralized exchanges suggest a desire to hold LINK tokens outside exchange custody, possibly indicating a longer-term investment strategy. 

Chainlink

Currently, LINK is trading at $19.7, up 8% in the last 24 hours.

Featured image from Shutterstock, chart from TradingView.com

Chainlink (LINK) Price Breaks Out Of Bullish Flag Pole, Here’s The Next Target

The Chainlink (LINK) price has been on an impressive rally over the last week that has brought its price to new yearly highs. As LINK bulls continue to hold firmly above the $18 support, the emergence of this bullish rally has continued to signal that the price surge is far from over.

Crypto Analyst Says Chainlink Bullish Flag Has Been Broken

In an analysis posted on the TradingView website, crypto analyst CobraVanguard explains why the Chainlink price is currently very bullish. According to the analyst, despite the altcoin showing very bullish signs, a lot of traders are failing to realize that this is the case.

They identified a flag pole that was created in the chart, and in this case, the flag for the LINK price was actually bullish. Even more interesting is the fact that the analyst revealed that the Chainlink price had successfully broken this flag, which they say is bullish for the price.

Chainklink price chart from Tradingview.com

“LINKUSDT is in a Bullish flag Patter,” the analyst said. “We can expect a bullish movement as much as the Measured Price movement (flag pole) to happen!” This further solidifies LINK’s entrance into its most bullish phase so far in 2024.

Another major factor that the analyst identifies for the LINK price at this level is that the price was testing the major supply zone at $18. At the time, the LINK price had not cleared this level. But at the time of writing, LINk has broken clean off this major supply zone and is now trending toward $19. “The Flag Is Broken,” the crypto analyst declared.

What Are The Targets For The LINK Price?

In the chart shared in the analysis, the crypto analyst identifies two major points of interest in the Chainlink chart and these are the Supply Zone and the Target Price. The first, which is the Supply Zone, is at $18.3, and the LINK price has already broken above this level.

Given this, the next major point of interest is the Target Price, and CobraVanguard puts this at the $27 price level. However, there is no straight shot toward this level as the analyst’s chart also shows a correction below the $13 support before rallying onto its target.

If this analysis holds over the coming days/weeks, then the LINK price could see a sharp 20% correction as the first sign. Then from there, a complete 100% move upward to bring the price to the $27 price target.

At the time of writing, LINK bulls continue to show dominance after a sharp 7% move in the last day. On the broader chart, the LINK price is up 27% in the last week, bringing its market cap to $10.9 billion.

LINK price chart from Tradingview.com (LINK Crypto analyst)

Chainlink Surges 12% To $18: Price Set To Retest $20 Next?

Chainlink has shot up over 12% to break $18 during the past day. A retest of the on-chain resistance wall at $20 could be next.

Chainlink Has Outperformed Market With Its 12% Rally

The past 24 hours have been green for most of the cryptocurrency sector, but the positive returns have been small for most of the market, with Bitcoin, the largest digital asset, only seeing profits of 1%.

Chainlink, however, has separated from the crowd during this period, rallying around 12%. The chart below shows how the coin has performed over the last few days.

Chainlink Price Chart

With this latest surge, Chainlink has surpassed the $18 level for the first time in almost two years. With profits of about 30% over the past week, LINK is by far the best-performing asset among the top 60 cryptocurrencies by market cap.

Speaking of the market cap list, LINK has now flipped Tron (TRX) to become the 11th largest asset in the sector following this recent strong performance. The table below shows where LINK stands among its peers in the sector right now.

Chainlink Market Cap

Dogecoin (DOGE) is the next coin above Chainlink now, and if the asset can continue its run, it should be able to flip the meme coin. While there is still some gap between their market caps, it isn’t too big.

Whether the coin can further this rally or not, perhaps on-chain data could provide some hints.

LINK Has Next Major On-Chain Resistance Wall Around $20

As explained by analyst Ali in a new post on X, LINK has significant on-chain resistance at $20. In on-chain analysis, the strength of a support/resistance level lies in the amount of BTC that the investors bought at it.

Below is a chart that shows the distribution of holder cost basis across the various LINK price ranges near the current price of the cryptocurrency.

Chainlink Resistance

When the analyst shared the chart, LINK was trading around $17.85, and the ranges until the $19.49 to $20.03 one weren’t too dense with investors. Chainlink has mowed through some of these weaker price levels since then, and the asset may continue to do so until it strikes the resistance wall around $20.

In total, 5,330 addresses bought 8.59 million LINK within this range. Generally, investors become more sensitive when the price retests their cost basis, so they may be prone to making some moves. For investors in loss like those inside this range, such a retest can mean an exit opportunity, as they might be desperate to get their money back.

This effect becomes more pronounced as investors share their cost basis inside the same range, so ranges with dense cost basis distribution can be a source of major resistance for the spot price.

Chainlink Price Surge Powers Altcoin Market, Bulls Aim For $20 Target

Chainlink (LINK), the leading oracle network on the blockchain, has been on a tear, outperforming the broader market with a 30% gain in the past week. This surge has pushed LINK’s price to $17.82, solidifying its dominance among altcoins, as bulls set their sights on the vaunted $20 target.

Chainlink On-Chain Activity Hints At Renewed Investor Interest

Analysts point to several factors driving the rally. Santiment, an on-chain data provider, revealed a surge in activity from previously dormant wallets, suggesting renewed investor interest. This is reflected in the “Age Consumed” metric, which measures the total number of days coins have been dormant before being moved. For Chainlink, this metric hit a 5.38 billion spike – the highest ever recorded.

Whales Accumulating, But Liquidations Pose Minor Threat

Santiment’s data also indicated minor liquidations from some wallets, a phenomenon often associated with fear or uncertainty. While these liquidations could trigger short-term volatility, they might also present buying opportunities for savvy investors. Additionally, reports suggest whales accumulating LINK, further fueling bullish sentiment.

The rationale behind this perspective lies in the understanding that fear-induced sell-offs might create temporary price dips, allowing savvy investors to acquire assets at more favorable prices.

Moreover, recent reports have indicated a pattern of whales accumulating LINK, contributing to the overall bullish sentiment surrounding the cryptocurrency. Whale accumulation, where large holders increase their positions, is often interpreted as a sign of confidence in the asset’s future potential.

Technical Analysis Paints Bullish Picture

Crypto analyst Michael van de Poppe identified a “higher low” on the LINK/BTC trading pair, which he considers a bullish signal. He predicts a potential breakout, with LINK reaching $25-$30 in the near future, fueled by a broader altcoin market rally. Van de Poppe even envisions a 50-80% surge for the altcoin market, pushing its valuation to a staggering $1.25 trillion.

While Van de Poppe’s analysis sparks optimism, it’s crucial to remember that expert predictions are not guarantees. The cryptocurrency market remains inherently volatile, and past performance is not indicative of future results.

CFGI At ‘Neutral’ 

Meanwhile, LINK’s “Fear & Greed Index” is currently positioned at 40, indicating a state of neutrality in the market sentiment. This numerical assessment reflects a balance between fear and greed among investors and traders in the context of Chainlink’s performance.

A “Neutral” reading on the Fear & Greed Index implies that the market is not heavily skewed towards either extreme optimism or pessimism. In such a scenario, investors may exhibit a measured and cautious approach, avoiding impulsive decisions driven solely by emotions.

This equilibrium in sentiment suggests that participants are likely assessing the market conditions with a more rational and balanced perspective, considering various factors before making significant moves.

The “Fear & Greed Index” serves as a valuable tool for market participants to gauge the prevailing sentiment and potential market trends. In the case of Chainlink’s current reading at 40, it signifies a market environment where neither excessive fear nor greed is dominating decision-making.

Featured image from Adobe Stock, chart from TradingView

Is Chainlink (LINK) Ready To Soar? Key Indicators To Monitor

Among the 20 most important cryptocurrencies by market capitalization, Chainlink (LINK) is currently recording the second-highest loss of -10.4 % in the last seven days. This puts it just behind Ethereum, which recorded a slightly sharper decline of -10.9 %.

Despite this, a glimmer of optimism emerges when delving into the 1-day chart of LINK/USD. The analysis suggests a potential turnaround on the horizon. Should the current market structure remain intact, there’s a promising indication that the recent corrective phase for LINK might be drawing to a close.

Chainlink Price Analysis: Indicators To Watch

Several key indicators and patterns emerge that warrant the attention of traders and investors alike. Firstly, the price action has been demonstrating a series of higher lows, which could be indicative of an ascending triangle pattern forming – a bullish continuation pattern. As long as the LINK price holds above the rising trend (black line) established in late October of the previous year, the bulls remain in control.

At press time, LINK was trading at $13.82, presenting a nuanced narrative in its Exponential Moving Average (EMA) positioning. A critical observation is that LINK’s price is buoyantly positioned above the longer-term 100-day and 200-day EMAs, recorded at $14.6679316 and $11.61, respectively. This configuration typically signals a robust long-term bullish momentum, underpinning investor confidence in the asset.

Contrastingly, the short-term outlook is conveyed by the positioning of the 20-day and 50-day EMAs. With the 20-day EMA at $14.67 and the 50-day EMA at $14.58, both hover above the current price level, imparting a potential resistance zone. This immediate overhead resistance is indicative of a short-term bearish pressure or consolidation phase, possibly reflecting a market pause as traders and investors reassess their positions.

Chainlink price

The Fibonacci retracement levels, drawn from the swing low in June to the peak in December, suggest that LINK has recently tested the 0.236 retracement level at $14.70 as resistance. The subsequent levels to watch are 0.382 at $12.85, followed by 0.5 at $11.53, which could serve as potential support levels if a bearish reversal occurs. Conversely, a break above the 0.236 level may open the door to test the $17.69 level, which stands as a significant resistance.

On the volume front, trading activity has been moderate, with no significant spikes indicating a decisive market direction. The Relative Strength Index (RSI) is hovering around the 50 mark, which typically denotes a neutral market sentiment without clear overbought or oversold conditions.

The MACD indicator exhibits a bearish signal with the MACD line at -0.1407939, positioned below the signal line, which is at -0.1508732. The negative value of the MACD line suggests that the short-term momentum is weaker than the long-term momentum, indicating bearish sentiment in the current market.

Furthermore, the distance between the MACD and the signal line is very narrow, as reflected by the small histogram value of -0.0100794. This small negative histogram value indicates a weakening of downward momentum, as the MACD line is close to crossing above the signal line.

Chainlink price

Traders might view such a crossover as a potential change in momentum, possibly hinting at an upcoming bullish phase. However, until the crossover occurs, the prevailing sentiment indicated by the MACD remains bearish in the short term.

LINK/BTC: Bulls In Control

The LINK/BTC trading pair (weekly chart) is also favoring the bulls. The descending trend line, which has historically acted as a resistance since the peak in 2020, was decisively broken in October last year. This breakout is a key development, indicating a potential reversal of the downtrend that has dominated the LINK/BTC pair for a significant period.

Following the breakout, a retest of the descending trend line occurred, a move often anticipated by technical analysts. The successful retest occurred in the second week of January, when the price bounced off the trend line, reinforcing it as a new support level.

This retest is indicative of a shift in market sentiment, where former resistance levels transform into support, a classical sign of a trend reversal. A breakout above 0.0004472, and LINK could be exploding towards 0.0006875 or even 0.0009.

Chainlink price

In summary, Chainlink’s technical posture is one of cautious optimism, with a clear upward trend since November but facing immediate resistance near the $14.70 level. Market participants should watch these technical indicators closely for signs of either a continuation of the uptrend or a potential reversal if support levels falter.

Chainlink Gets Whale Backing: LINK Price Up 14% Amid Market Dip

In the midst of the recent turbulence within the cryptocurrency market, Chainlink (LINK) has emerged as a notable outlier, demonstrating resilience against the sweeping downturn that has left major altcoins crumbling.

Surprisingly, LINK has steadfastly clung to the $16 mark, showcasing a 14% rally in the last seven days and defying the prevailing market trends. However, investors are left to ponder whether this is a promising sign for Chainlink’s future or merely a momentary blip in the radar.

Massive Chainlink Whale Purchase

This positive signal coincides with a notable $8.9 million whale purchase, injecting a substantial dose of confidence into the market. Yet, beneath the surface, murmurs of a whale exodus are causing concern.

This purchase also dampens some worries especially following a recent selling spree by Chainlink investors, who offloaded a significant 2.3 million tokens since January 12th.

The positive signal also comes after recent concerns in the absence of a noteworthy uptick in fundamental growth metrics such as network usage. Without substantial real-world adoption, the coveted $20 price point for Chainlink might remain an elusive mirage.

Chainlink’s Strengths Persist Amid Market Uncertainty

Meanwhile, IntoTheBlock’s global in/out of the money (GIOM) chart uses the historical entry prices of the current LINK holders to highlight critical levels of support and resistance.

In the near term, investors may opt for short-covering maneuvers to prevent falling into a net-loss position, a strategy that could lead to the consolidation of Chainlink’s (LINK) price just below the $15 threshold in the upcoming days.

Conversely, bullish market participants could potentially counter this bearish scenario by successfully pushing the price beyond the $20 territory. However, a potential hurdle arises from the fact that over 94,000 holders have accumulated 51 million LINK at a minimum price of $18.8.

This sizable accumulation suggests the possibility of bears establishing a formidable sell-wall in that price range, potentially triggering a retreat in LINK’s value.

The interplay of these dynamics underscores the delicate balance between short-term tactical moves and broader market sentiment that currently characterizes the trajectory of Chainlink’s price.

Despite the prevailing turbulence, the core strengths of Chainlink should not be overlooked. Its established role as a leading oracle provider within the blockchain ecosystem remains undiminished.

If the broader crypto market stages a recovery and fundamental growth aligns, a resurgence for Chainlink is not out of the realm of possibility.

Featured image from Freepik

Chainlink (LINK) Breakout: Accumulation Zone Points To Upside Potential, $20 In Sight

The decentralized Oracle network Chainlink and its native token LINK have grown impressively in the past month. Despite experiencing a correction since late December, where LINK reached a 20-month high of $17.6, the token has shown signs of renewed bullish momentum. 

Key Resistance Levels For LINK’s Price Rally

Renowned crypto analyst Ali Martinez has identified a robust demand zone for Chainlink between $14.8 and $15.2, slightly below its current trading price of $15.415. 

Within this range, many addresses (17,650) purchased 85.12 million LINK. With limited resistance, LINK appears to be well-positioned to advance towards the $20 mark.

Chainlink

Based on the analyst’s observations, if the current bullish momentum witnessed over the past seven days persists, LINK could swiftly reach the $20 price level. Looking at LINK’s 1-day chart, the next resistance levels to overcome before potentially climbing toward $20 are $15.55, $16.69, and $16.92. Breaching these levels would pave the way for a clear path towards the $20 milestone.

However, it is important to note that in the absence of major resistance walls, the battle for the next direction of LINK’s movements remains equally balanced. In the event of another price correction or selling pressure, the token lacks significant support walls to rely on.

Chainlink

Analyzing LINK’s 1-day chart, the first support level in the event of a drop would be around $14.22. If this level is breached, the next support stands at $13.31. A further decline could test the support at the $11 price level. A breach of this level could signify a breakdown in the four-month bullish structure of LINK.

Chainlink Ecosystem Growth

Despite the battle for supremacy between LINK’s bulls and bears, the protocol’s ecosystem has shown notable growth in key metrics since the last update. For example, Chainlink’s circulating market capitalization is $8.35 billion, reflecting a positive growth rate of 3.58%.

According to Token Terminal data, in terms of revenue over the past 30 days, Chainlink has generated $11.67 thousand. However, this figure shows a decline of 54.16% compared to the previous period, indicating a decrease in earnings during this timeframe.

Considering the fully diluted market capitalization, which considers the maximum number of Chainlink tokens that could exist in the future, the value stands at $14.82 billion. This metric has experienced a slight increase of 3.48% recently.

When it comes to revenue on an annual basis, Chainlink has generated $219.81 thousand. This represents a positive growth rate of 2.64%, indicating an upward trend in the company’s earnings over a year.

Regarding financial ratios, Chainlink’s price-to-fully-diluted ratio is calculated at an astonishing 68,246.47x. This metric compares the company’s market capitalization to its fully diluted market capitalization. It reflects the premium investors will pay for each unit of potential future tokens.

Similarly, based on the fully diluted market capitalization, the price-to-sales ratio is reported to be 68,246.47x. This ratio measures the company’s valuation relative to its annualized revenue and indicates how much investors will pay for each dollar of sales generated.

Featured image from Shutterstock, chart from TradingView.com 

Chainlink Rises 17% – Is LINK On Course To Hit $20 This Week?

Traders in the crypto realm are watching Chainlink (LINK) with bated breath as the price coils up near the $16 mark, hinting at a possible break out towards $17, or even $20 given the right conditions this week.

Since November, LINK has been consolidating between $13.00 and $17.00, exhibiting classic market cycle behavior that presents prime opportunities for savvy traders.

Technical analysts are buzzing with potential bullish scenarios, with many pointing to the current price action as the telltale sign of an “accumulation phase.” As per the renowned Wyckoff method, this phase sees sellers exiting, prices stabilizing, and indecision ruling the market.

Will Chainlink Hit The Vaunted $20 Mark?

Following accumulation comes the much-anticipated “markup phase,” characterized by surging buying pressure, rapid price increases, and heightened activity.

And that’s precisely what the charts seem to be foreshadowing for LINK. Indicators like the Awesome Oscillator and MACD are flashing green and pushing towards bullish territory, suggesting growing confidence and impending upward momentum.

The Relative Strength Index (RSI) also leans north, potentially primed to cross its signal line and add fuel to the bullish fire.

Further bolstering the optimistic outlook are the Simple Moving Averages (SMAs). Both the 100- and 200-day SMAs are pointing north, with the latter currently nestled comfortably at $9.994. This upward trajectory indicates the path of least resistance lies in ascending territory for LINK.

Should buying pressure build steam above current levels, analysts predict a potential leapfrog over the 50-day SMA at $16.95, paving the way for a psychological $17 price point. In a highly bullish scenario, LINK could even tap into its full $20 potential, marking a 20% surge from its current position.

17% Rally Ignites More Optimism For LINK

But a fresh spark ignites the conversation – Chainlink just surged 17% today, propelling it closer to the long-held $17 barrier. Could this recent rally be the catalyst that sends LINK rocketing past its immediate target and into uncharted territory?

It’s still too early to definitively say. While the technical indicators remain encouraging, external factors and market sentiment can shift rapidly. However, one thing is certain: Chainlink’s latest surge adds another layer of intrigue to its already captivating price action.

Whether it coils upward for a glorious breakout or succumbs to profit-taking, the next few days promise to be a thrilling ride for LINK holders and a fascinating case study for technical analysis enthusiasts alike.

Featured image from iStock

Chainlink Becomes Long-Heavy As Price Clears $16: Top Here?

Chainlink has seen long contracts pile up on Binance during the past day, which may lead toward a top for the cryptocurrency.

Chainlink Funding Rate On Binance Has Turned Highly Positive

According to data from the on-chain analytics firm Santiment, the Chainlink funding rate on Binance has now reached the highest level in about four weeks. The “funding rate” refers to the periodic fee that derivative traders on any given platform are exchanging with each other right now.

When the value of this metric is positive, it means that the long holders are currently paying a fee to the short investors in order to hold onto their positions. Such a trend suggests a bullish mentality is dominant on the platform.

On the other hand, negative values imply a bearish sentiment is shared by most LINK traders on the exchange as the shorts outweigh the longs.

Now, here is a chart that shows the trend in the Chainlink funding rate on cryptocurrency exchange Binance over the last few months:

Chainlink Funding Rate

As displayed in the above graph, the Chainlink funding rate on Binance has assumed significantly positive values following the asset’s surge beyond the $16 mark.

Longs currently outweigh the shorts by the highest ratio since November 11th, when the cryptocurrency’s price set its then-yearly high, which the coin has now surpassed.

Historically, longs piling up on the derivatives market have often been negative for the price. This is because a mass liquidation event called a “squeeze” is usually more likely to affect the side with the most positions.

In a squeeze, a sudden swing in the price triggers a large amount of liquidations, which only feed into the swing further and end up leading to a cascade of more liquidations.

As the Chainlink funding rate is significantly positive, a long squeeze could be more likely to happen than a short squeeze. Last month, the asset hit its local top in these conditions, so the same might also repeat this time.

If LINK does observe a drawdown shortly, though, the decline may not be too extended. This is because there appears to be some strong on-chain support present between the $14.4 and $14.8, as analyst Ali pointed out in an X post yesterday.

Chainlink Price Chart

In on-chain analysis, levels are defined as resistance and support based on the total number of investors who acquired their coins at said levels. From the chart, it’s visible that 17,000 addresses have their cost basis inside the $14.4 to $14.8 range, which means it’s possibly a zone of strong support.

On the contrary, the levels above the current one are thin with investors, meaning that they shouldn’t pose too much resistance should the rally continue.

“As $LINK has regained the $16 threshold, watch if a bit of FOMO forms a local top, or if prices continue surging toward $20 with little resistance,” notes Santiment.

LINK Price

LINK had earlier broken past the $17 mark, but the asset has since seen some pullback as it’s now trading under the level once more.

Chainlink Price

Chainlink Signal Resurfaces: Is Another 31% Rally Coming?

On-chain data shows that a Chainlink signal that last preceded a 31% rally for the asset’s price has just reversed.

Chainlink Age Consumed Metric Has Observed A Sharp Spike Recently

According to data from the on-chain analytics firm Santiment, LINK has recently seen a significant movement from old coins. The relevant indicator here is the “Age Consumed,” which tells us whether the dormant Chainlink tokens are on the move or not right now.

When the indicator’s value registers a large spike, it’s a sign that the blockchain is currently observing the transfer of a significant number of old coins. Such dormant tokens belong to a cohort called the “long-term holders” (LTHs), made up of the relentless hands of the sector.

As such, this metric surging can be something to watch out for, as it means that these LTHs, who usually remain quiet no matter what’s going on in the wider market, have decided to break their dormancy.

Now, here is a chart that shows the trend in the Chainlink Age Consumed over the last few months:

Chainlink Age Consumed

As displayed in the above graph, the Chainlink Age Consumed indicator has observed a sharp rise recently, implying that the LTHs have been making transactions.

At the peak of this latest spike, the metric’s value touched 4.28 billion, which is the highest level seen since the middle of September. Back then, the indicator registered a spike almost double in scale, and interestingly, what followed in the next couple of weeks was a 31% rally as LINK went from $6.36 to $8.22.

It’s hard to say if a similar pattern would repeat for Chainlink this time since the LTHs could have broken their silence for several reasons, including for selling.

An analyst has pointed out that yesterday (which was about the same time as this spike in the Age Consumed), the whales made many transactions, as the chart below shows.

Chainlink Whale Transactions

In total, the Chainlink network observed 2,600 transactions valued over $100,000 yesterday. The spike would confirm that the LTHs who broke their dormancy weren’t just ordinary investors but the whales.

In isolation, it’s hard to say why these two indicators recently observed a spike. Still, when looking at the latest LINK news, perhaps the most likely explanation becomes apparent.

Yesterday, Chainlink staking v0.2 went live on the Ethereum blockchain, allowing the v0.1 stakers to migrate toward the new network. Thus, given the close timing of the spikes in the Age Consumed and Whale Transaction Count, it would appear quite probable that these LTHs were making transfers toward the new staking pools.

LINK Price

Chainlink had observed some drawdown towards the $13.7 mark just recently, but it would seem like the asset has already recovered as it’s now trading around $14.7.

Chainlink Price Chart

Chainlink Retests $14: Here’s What Will Happen If Support Holds

Chainlink has registered some drawdown and has recently retested the $14 level. Here’s what might happen if support holds at this mark.

On-Chain Data Suggests Resistance Is Thin At Higher Chainlink Levels

As pointed out by analyst Ali in a new post on X, Chainlink is currently in a critical on-chain demand zone. In on-chain analysis, a price range is defined as major support or resistance based on the number of investors or addresses that bought their coins inside the said range.

To any holder, their cost basis is naturally fundamental, as their profit/loss situation can flip whenever the cryptocurrency retests it. For this reason, an investor becomes more likely to show a move whenever such a retest takes place.

If the holder had earlier been holding a loss, but the price has now risen and reached its equilibrium point, they might lean towards selling. This is because they might fear their holdings would go into loss again shortly, so exiting at break-even wouldn’t sound like a bad idea.

The opposite can be true when the retest occurs from above: the investor might be willing to buy more, thinking that if this same cost basis proved profitable earlier, it would do so again soon.

A single investor making such buy or sell moves is insignificant for the rest of the market, but if many investors share the same cost basis, the asset could feel a sizeable reaction when the price retests the level.

Now, here is a chart that shows how the Chainlink ranges around the current price look in terms of the density of investors who bought inside them:

Chainlink Cost Basis

As displayed in the above graph, the Chainlink levels from $13.8 to $14.2 host the cost basis of about 11,470 addresses, which acquired 23.45 million LINK inside this range.

This range is notably thicker than any other range immediately below or above the asset’s current price. LINK has been floating around this range recently, meaning it has been retesting this major support zone.

From the chart, it’s apparent that the ranges above don’t contain that many investors, so in theory, a move toward the higher levels shouldn’t be too hard for the asset.

However, the trouble would be if this support area is lost and LINK slips under it for an extended duration. This dense zone will turn into a resistance wall if this happens, making it hard for the cryptocurrency to recover above it.

Ali notes, though, that if Chainlink can remain above this zone, the price could climb towards new highs for the year 2023.

LINK Price

Chainlink had slipped below this range just earlier, but the asset was quick to recover above it, implying that it’s still holding up as support.

Chainlink Price Chart

Analyst Predicts Chainlink Rally To $20 Based On This Pattern

An analyst has pointed out how Chainlink might be breaking out of a bull flag right now, which could suggest a rally toward $20.

Chainlink Is Escaping Out Of A Bull Flag Pattern Currently

In a new post on X, analyst Ali pointed out a breakout that may be forming in the LINK price chart. The relevant technical pattern here is the “bull flag,” which, as its name implies, looks like a flag on a pole.

This pattern forms when the asset’s price goes through a pullback after seeing a sharp rally and consolidates inside a region. The initial trend acts as the “pole,” while the parallel trendlines of the consolidation region make up the “flag.”

The flag’s length (the distance between the parallel trendlines) is always at most half the length of the pole. If it’s not, then the pattern isn’t that of a bull flag.

Inside the flag, the price feels resistance at the upper line and support at the lower one. A successful break out of the resistance zone generally indicates that the asset is ready to continue the initial uptrend.

According to the analyst, the chart below shows that such a pattern is forming for Chainlink.

Chainlink Bull Flag

As displayed in the graph, Chainlink had earlier been consolidating inside what seems to have been a bull flag, but with the recent surge, the asset has seen a break out of the pattern.

When Ali shared the chart, LINK had been trading just under the $15 mark. The analyst had noted that a retest of the breakout zone could happen soon, around $14.

The cryptocurrency has indeed made such a retest since then, as its price has observed some retrace. Ali believes the price could rally towards the $20 mark, continuing the bullish momentum from earlier. From the current asset price, such a jump would imply profits of almost 42% for Chainlink.

It remains to be seen whether the bull flag pattern holds for the cryptocurrency this time and if a return to a bullish trend occurs.

LINK Has Seen A Rally Of 185% In The Past Month

Regardless of the recent pullback that the asset has seen from above the $16 mark, its returns for the last 30 days are still incredible, as they currently stand at a whopping 85%.

The below chart shows what the performance of the asset has looked like during this period.

Chainlink Price Chart

With such large returns, Chainlink has naturally outperformed most of the other top assets recently, and it’s no wonder that the cryptocurrency has also significantly improved its standing in the market cap list.

Chainlink Market Cap

Chainlink Declines 6%: Rally Over Or Is There More To Go?

The Chainlink rally has slowed down recently; here’s what the various LINK on-chain metrics look like to see if the surge has hope of a restart.

Chainlink Has Registered Some Drawdown In The Past 24 Hours

Just during the weekend, Chainlink had been floating above the $16 mark, but winds seem to have shifted for the coin in the past couple of days, as it has registered some drawdown.

During the last 24 hours alone, LINK has dropped around 6%, leading to its price slipping below the $14 level. The chart below shows how the cryptocurrency has performed in the past month.

Chainlink Price Chart

As displayed above, Chainlink had been riding some sharp bullish momentum in this period before this latest plunge, as the asset had more than doubled in value. Despite the decline, LINK is still up over 90% in the past month, which is an impressive return.

Naturally, the investors may be wondering now if the asset has already hit its peak for this rally or if there is more to come shortly. It’s hard to say anything about that, but perhaps on-chain data could provide some hints.

LINK Activity Has Been Relatively High Recently

In a new post on X, the market intelligence platform IntoTheBlock has shared the data of some Chainlink on-chain indicators. First, when the firm made the post, about 56% of the asset’s investors were sitting on some profit.

Chainlink Profit

The cryptocurrency had then been floating at higher levels than currently (although not too high), so more LINK addresses would have entered a state of loss by now.

Generally, investors in profit are more likely to sell at any point, so a large amount of them being in the green could raise the probability of a selloff. Some Chainlink investors are currently harvesting their profits, but the profitability ratio is still not skewed that much towards profits.

Next, IntoTheBlock has talked about the number of transactions on the network.

Chainlink Transactions

“The Chainlink network is showing many positive signs in terms of transaction data,” says the intelligence platform. “Notably, we see a healthy increase in the number of transactions.”

The number of transactions is up 436% from the monthly lows, and as is usually the case, the volume has also spiked alongside this rise.

Chainlink Volume

The transaction activity being high suggests there is interest behind the asset, and so, the price action shouldn’t go stale just yet. However, the volatility due to this activity can go either way, as the asset is already witnessing.

A metric that could more solidly point at a direction for the cryptocurrency is the large holder netflow, which keeps track of the net accumulation/distribution behavior over the last month for LINK holders carrying more than 1% of the supply.

Chainlink Whale Netflow

As is visible in the chart, the large Chainlink holders have been buying recently, which could potentially be a positive sign for the asset. This doesn’t have to mean that the rally would restart shortly, of course, but it does provide some support for the idea.