Analyst Predicts Chainlink Rally To $20 Based On This Pattern

An analyst has pointed out how Chainlink might be breaking out of a bull flag right now, which could suggest a rally toward $20.

Chainlink Is Escaping Out Of A Bull Flag Pattern Currently

In a new post on X, analyst Ali pointed out a breakout that may be forming in the LINK price chart. The relevant technical pattern here is the “bull flag,” which, as its name implies, looks like a flag on a pole.

This pattern forms when the asset’s price goes through a pullback after seeing a sharp rally and consolidates inside a region. The initial trend acts as the “pole,” while the parallel trendlines of the consolidation region make up the “flag.”

The flag’s length (the distance between the parallel trendlines) is always at most half the length of the pole. If it’s not, then the pattern isn’t that of a bull flag.

Inside the flag, the price feels resistance at the upper line and support at the lower one. A successful break out of the resistance zone generally indicates that the asset is ready to continue the initial uptrend.

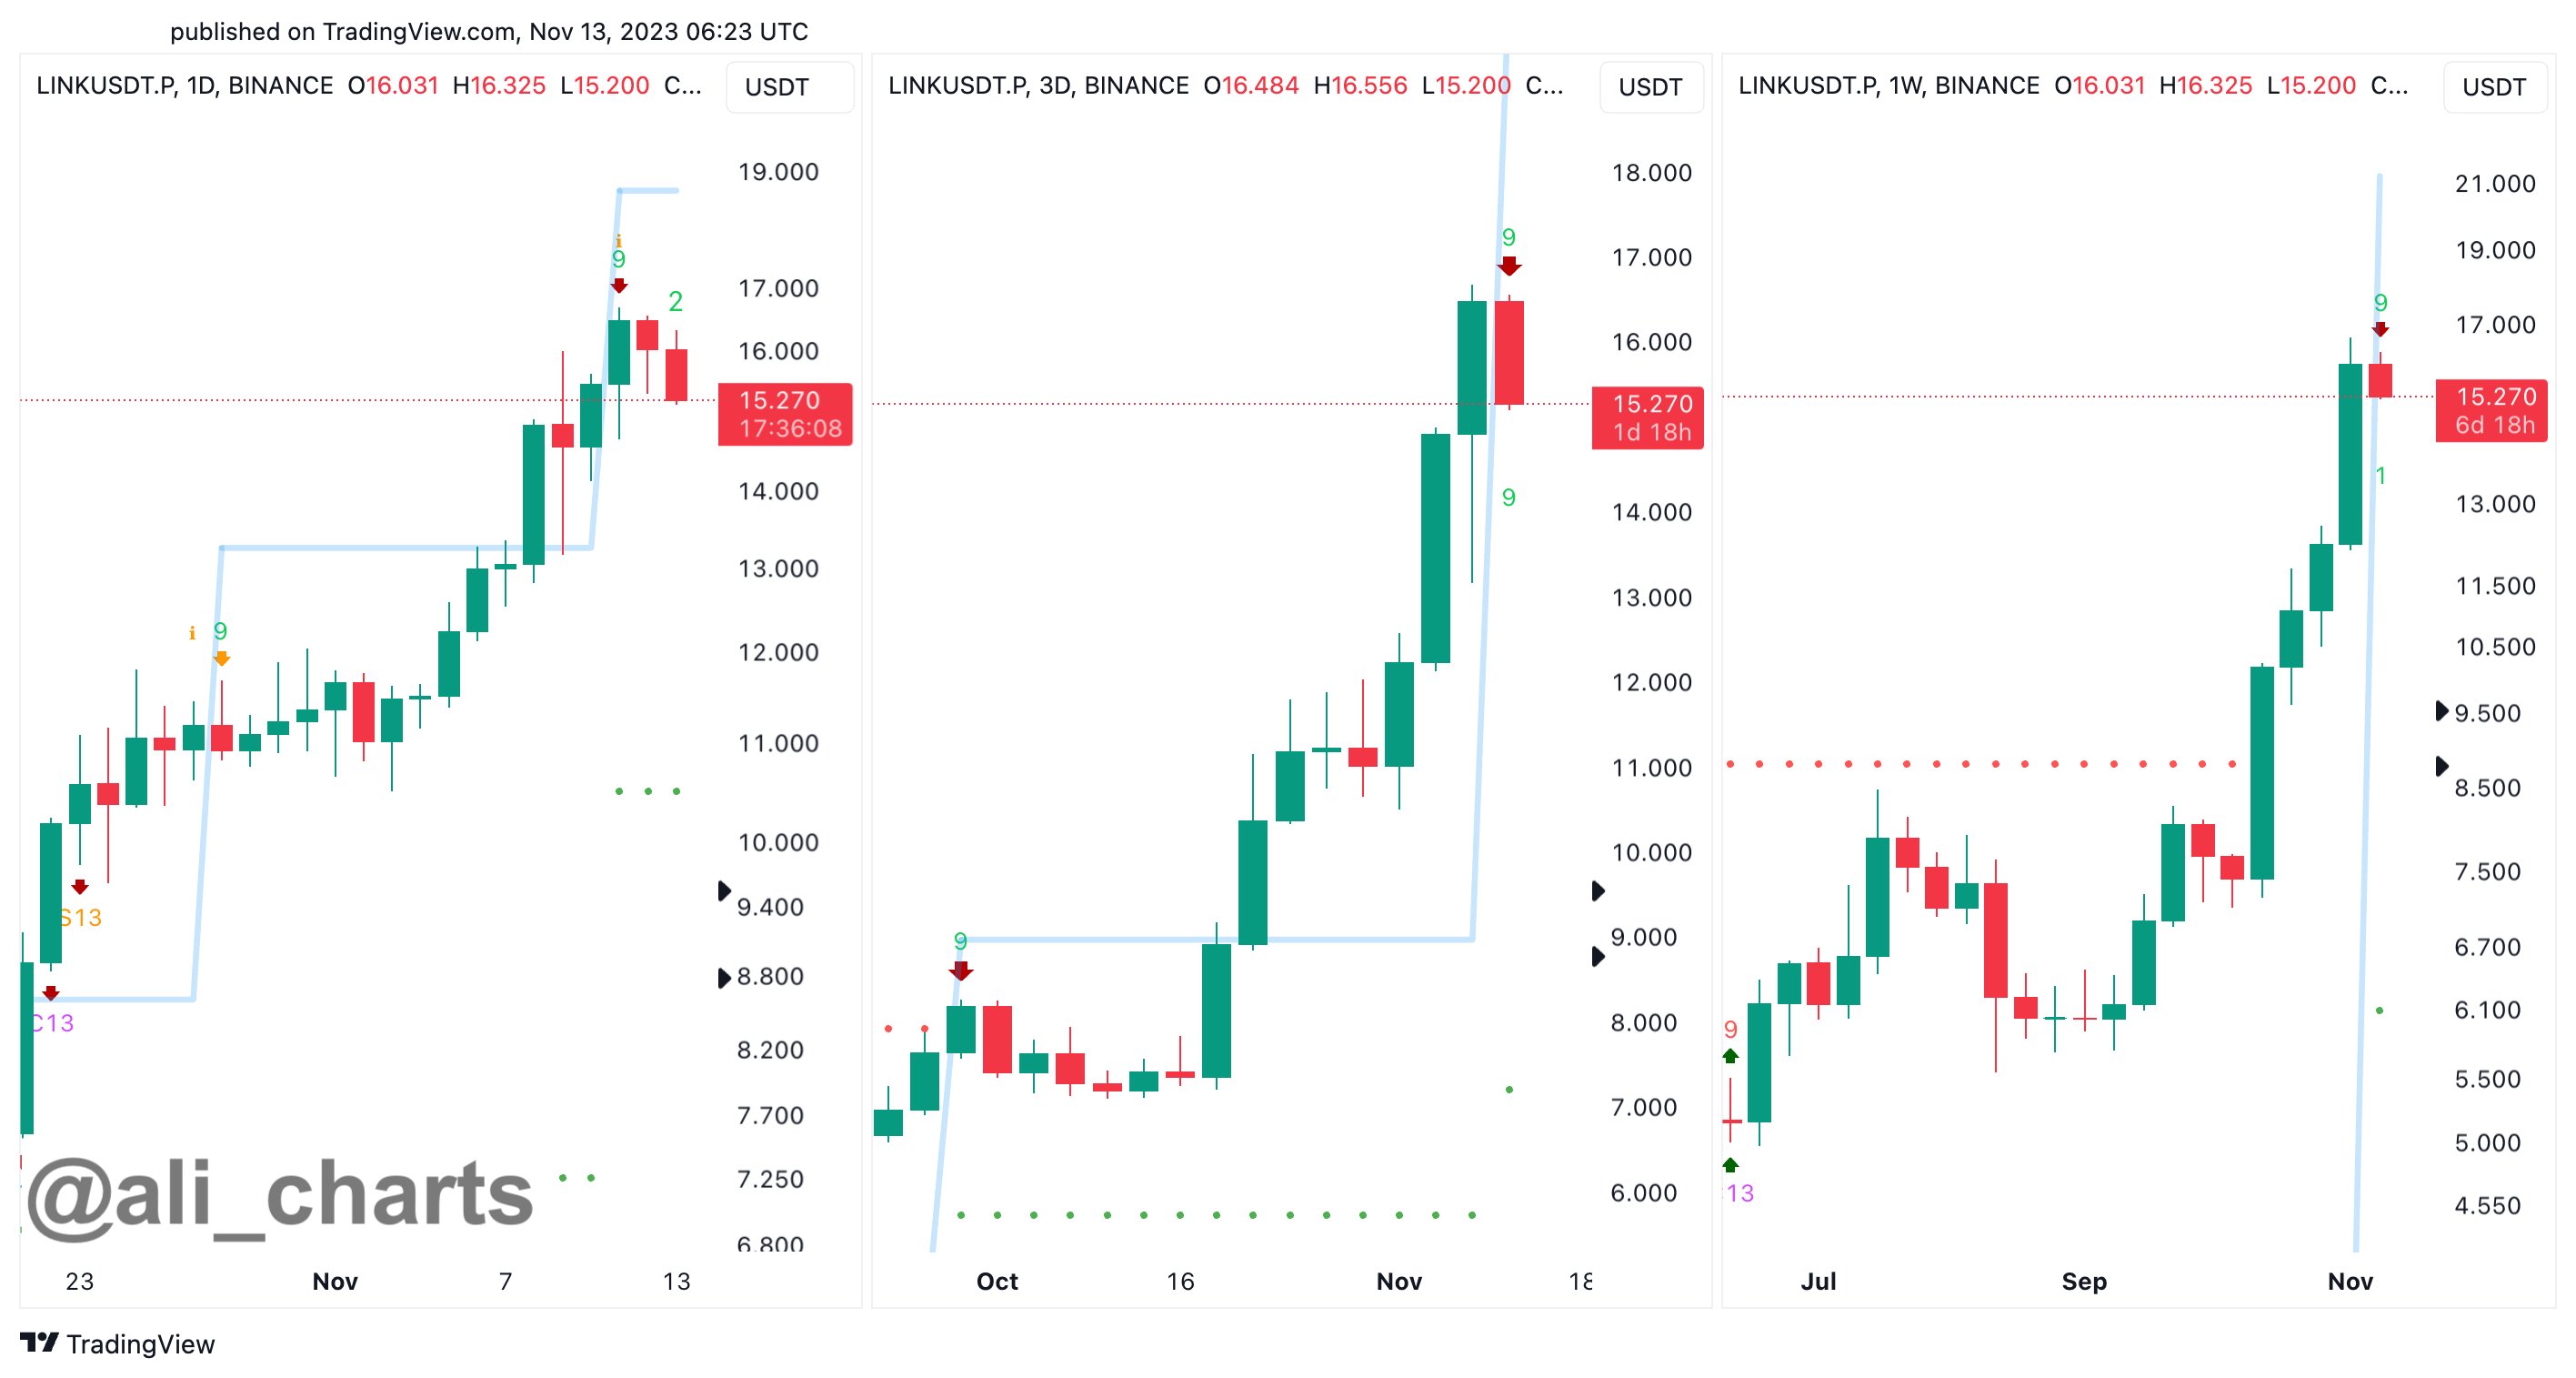
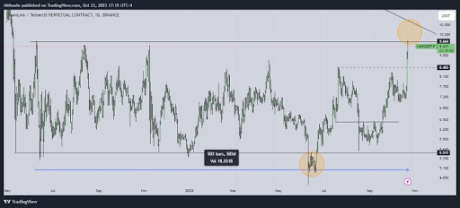
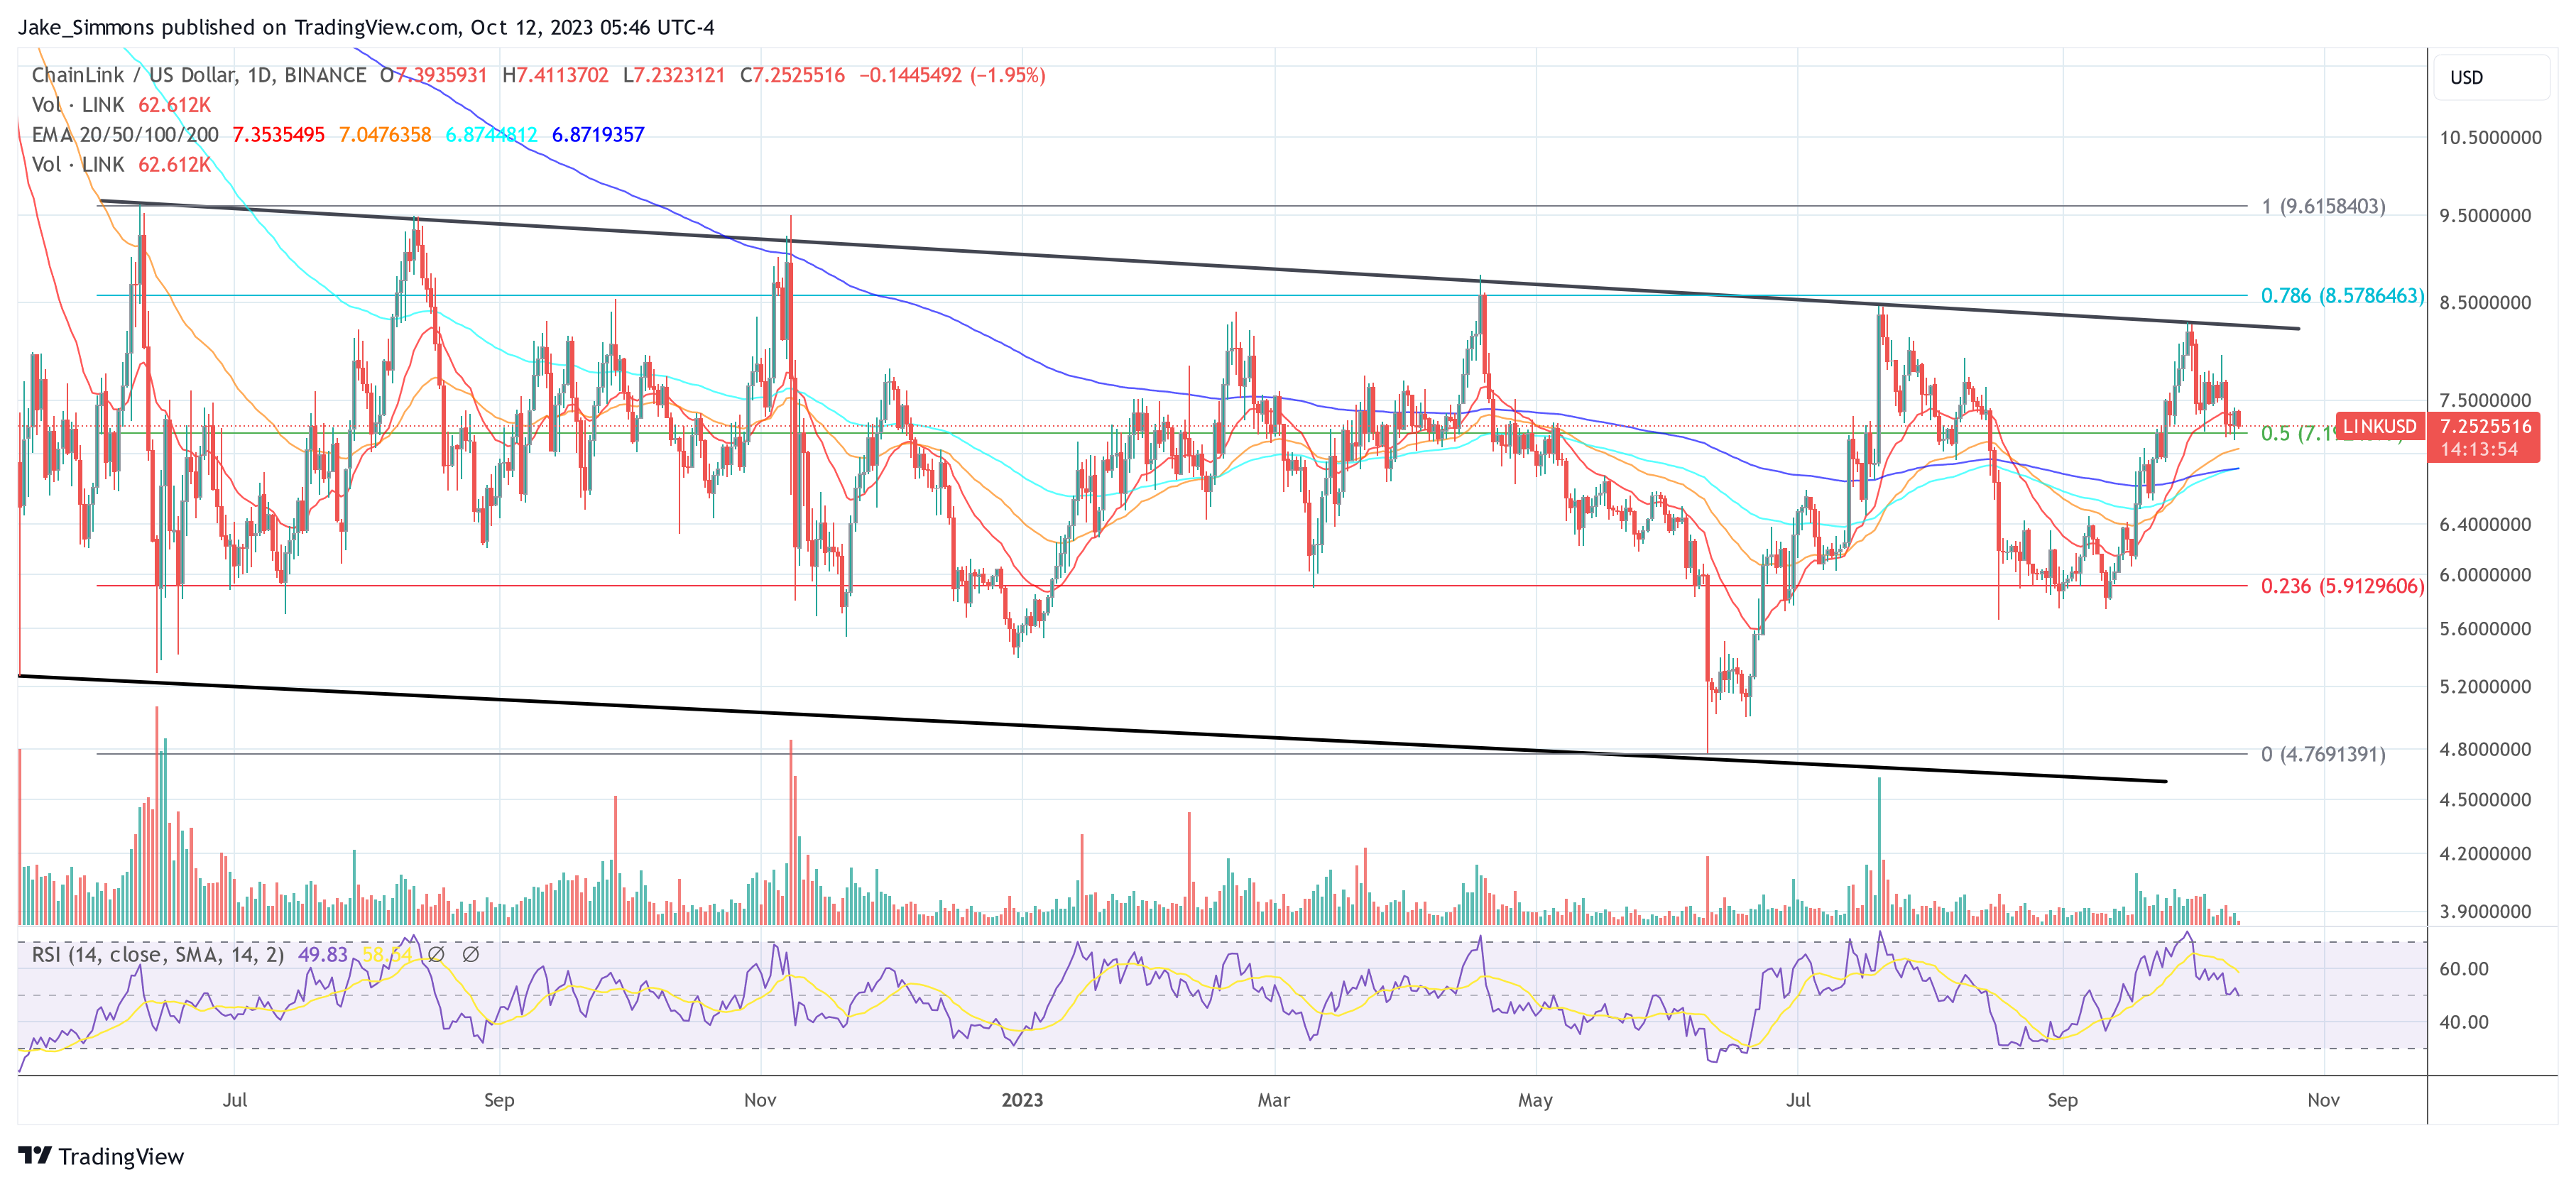
According to the analyst, the chart below shows that such a pattern is forming for Chainlink.

Chainlink Bull Flag

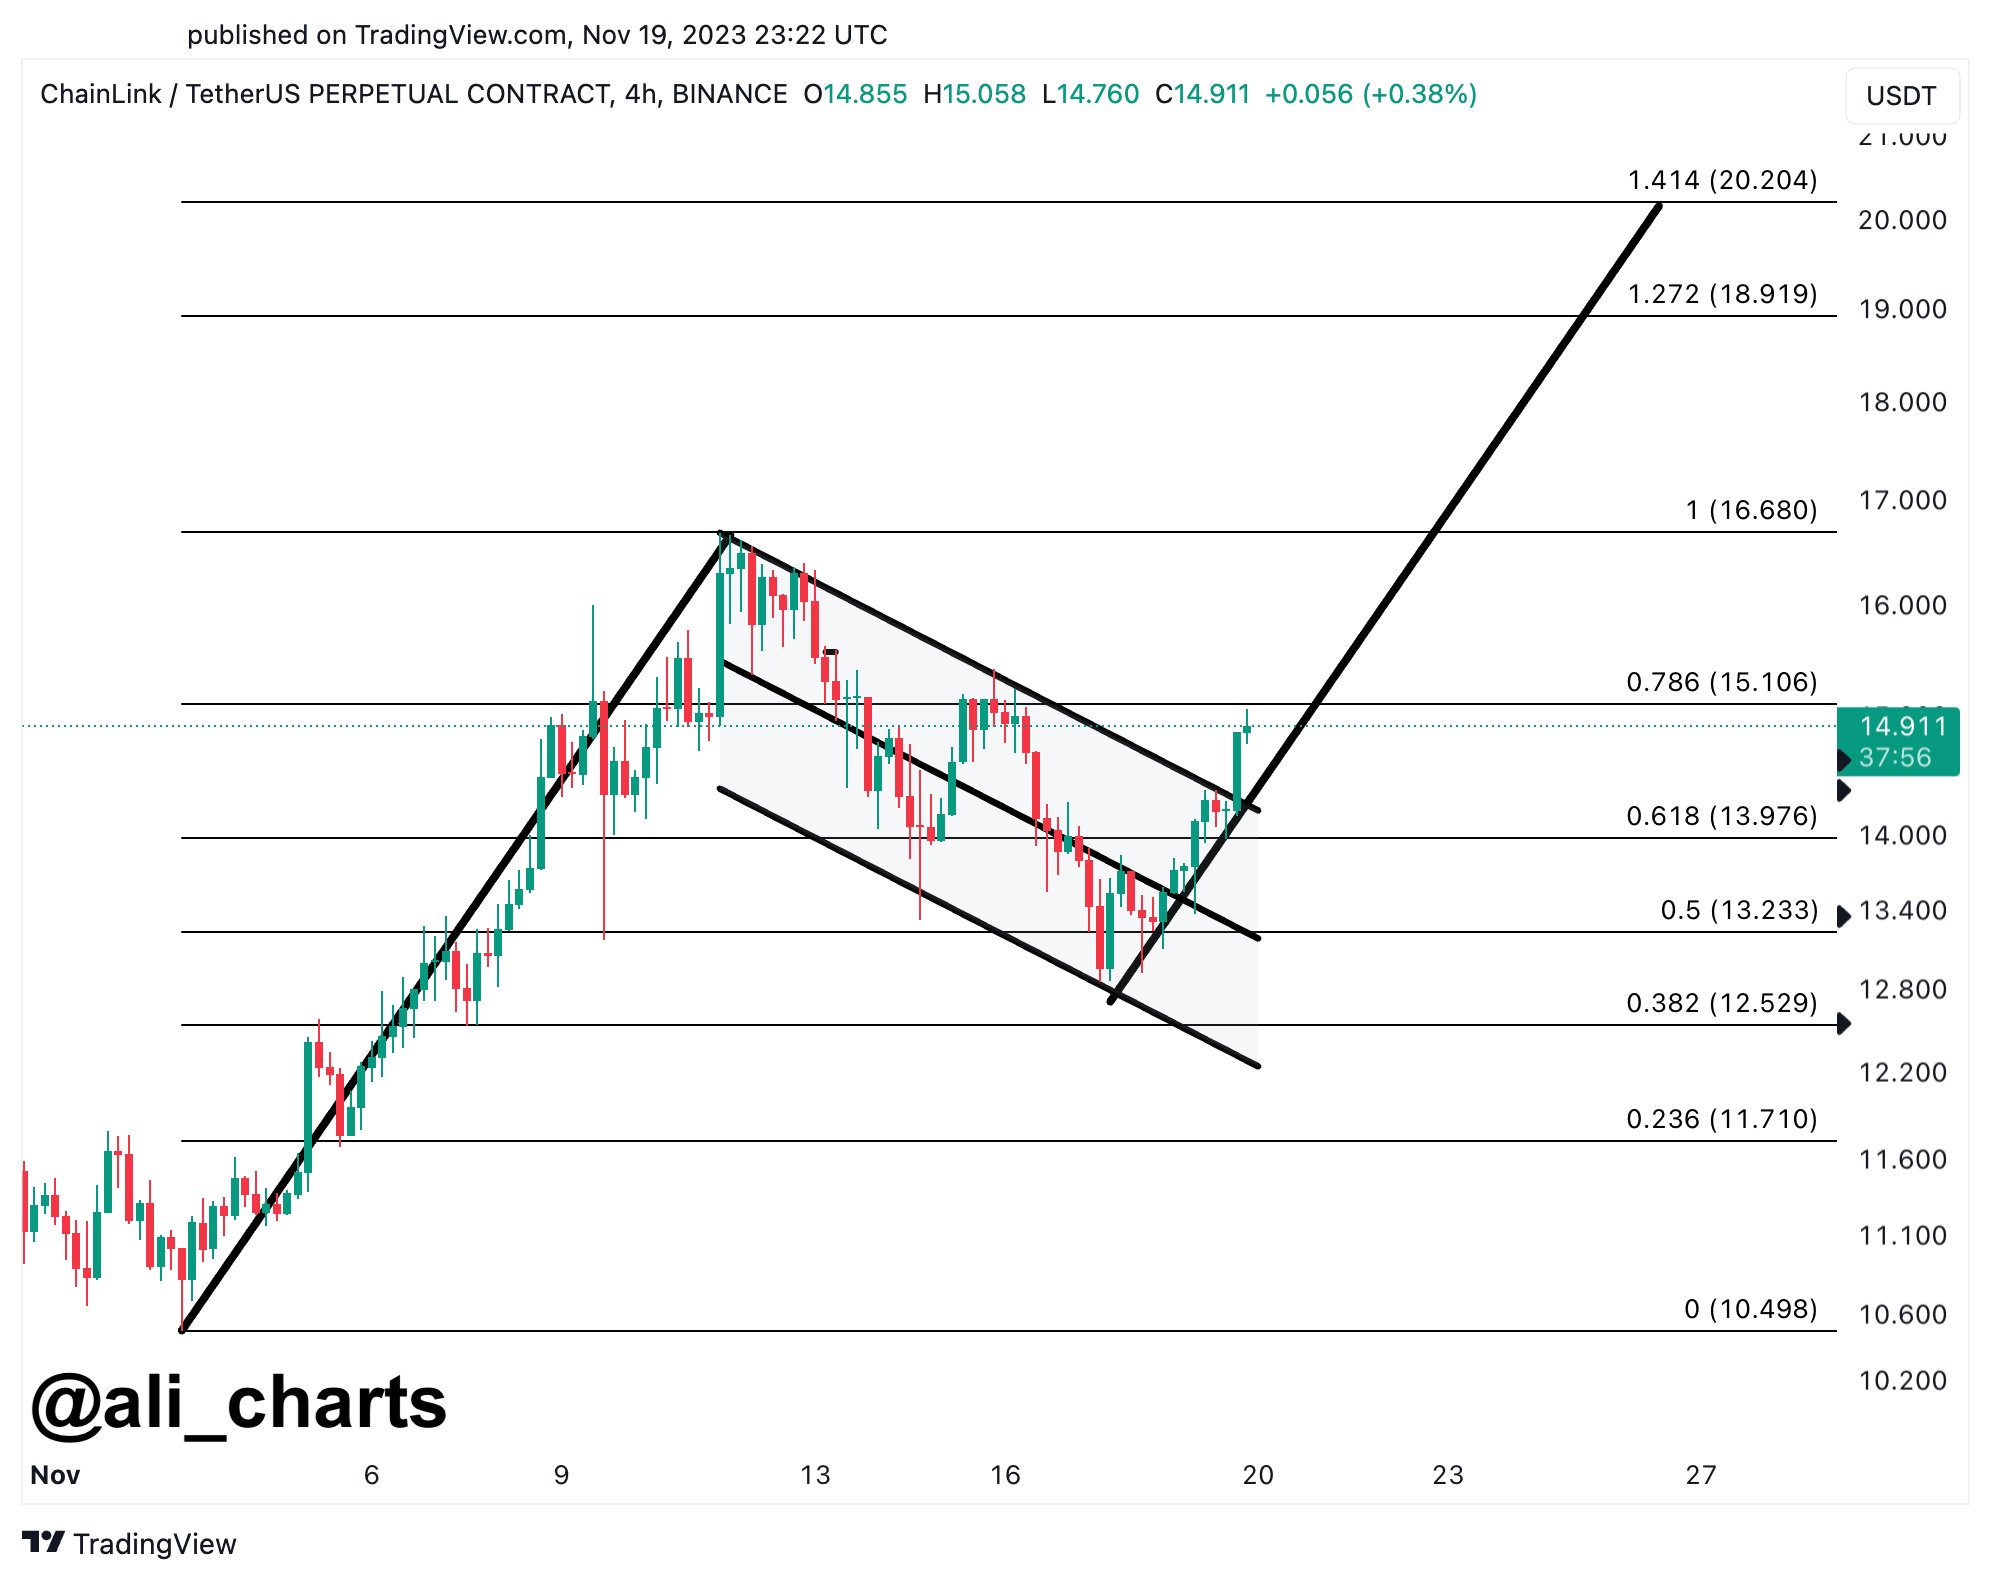
As displayed in the graph, Chainlink had earlier been consolidating inside what seems to have been a bull flag, but with the recent surge, the asset has seen a break out of the pattern.

When Ali shared the chart, LINK had been trading just under the $15 mark. The analyst had noted that a retest of the breakout zone could happen soon, around $14.

The cryptocurrency has indeed made such a retest since then, as its price has observed some retrace. Ali believes the price could rally towards the $20 mark, continuing the bullish momentum from earlier. From the current asset price, such a jump would imply profits of almost 42% for Chainlink.

It remains to be seen whether the bull flag pattern holds for the cryptocurrency this time and if a return to a bullish trend occurs.

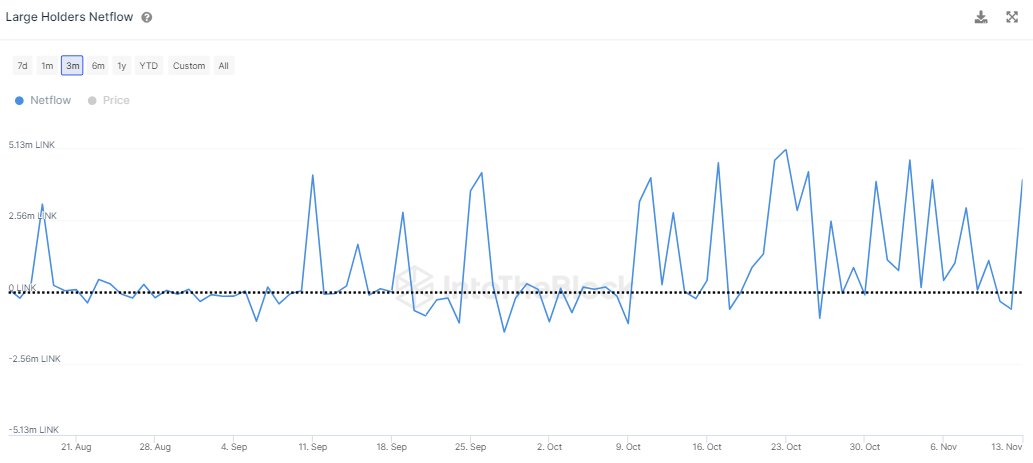
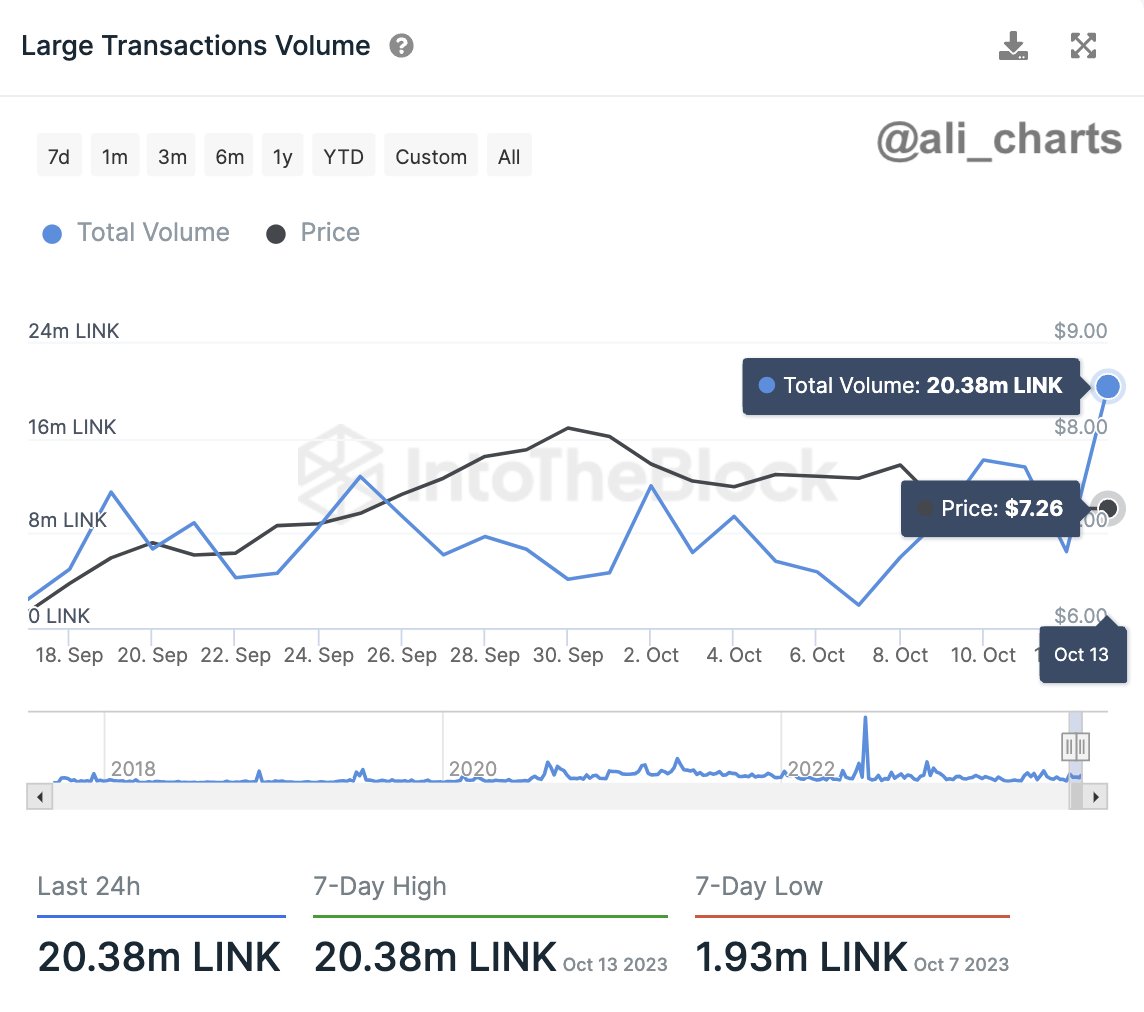
LINK Has Seen A Rally Of 185% In The Past Month

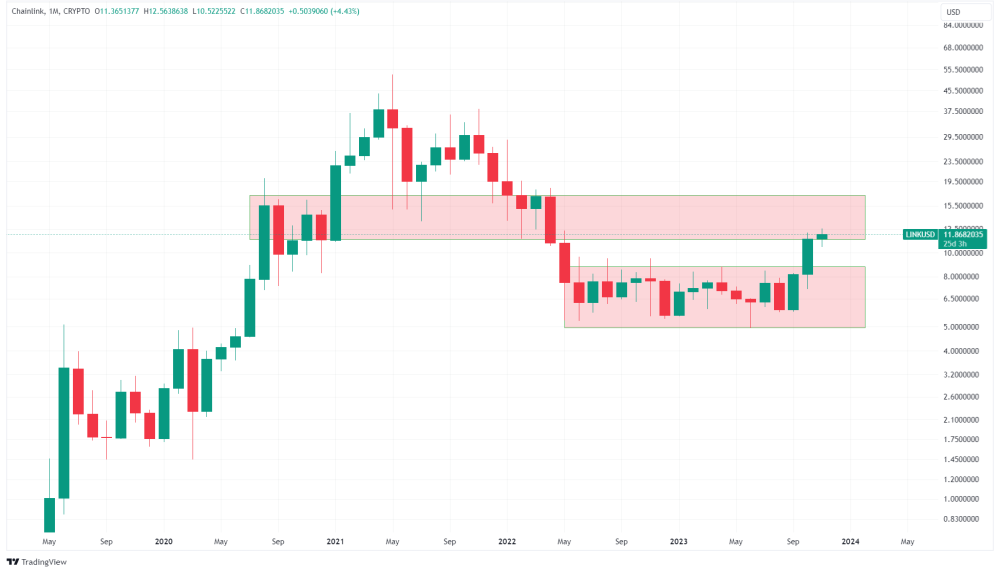
Regardless of the recent pullback that the asset has seen from above the $16 mark, its returns for the last 30 days are still incredible, as they currently stand at a whopping 85%.

The below chart shows what the performance of the asset has looked like during this period.

Chainlink Price Chart

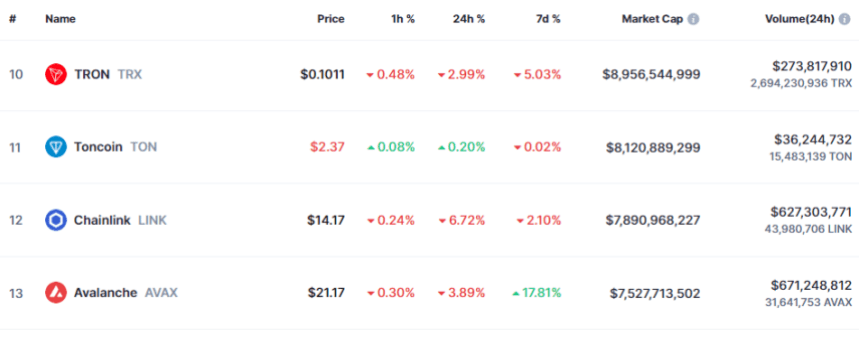
With such large returns, Chainlink has naturally outperformed most of the other top assets recently, and it’s no wonder that the cryptocurrency has also significantly improved its standing in the market cap list.

Chainlink Market Cap

Chainlink Declines 6%: Rally Over Or Is There More To Go?

The Chainlink rally has slowed down recently; here’s what the various LINK on-chain metrics look like to see if the surge has hope of a restart.

Chainlink Has Registered Some Drawdown In The Past 24 Hours

Just during the weekend, Chainlink had been floating above the $16 mark, but winds seem to have shifted for the coin in the past couple of days, as it has registered some drawdown.

During the last 24 hours alone, LINK has dropped around 6%, leading to its price slipping below the $14 level. The chart below shows how the cryptocurrency has performed in the past month.

Chainlink Price Chart

As displayed above, Chainlink had been riding some sharp bullish momentum in this period before this latest plunge, as the asset had more than doubled in value. Despite the decline, LINK is still up over 90% in the past month, which is an impressive return.

Naturally, the investors may be wondering now if the asset has already hit its peak for this rally or if there is more to come shortly. It’s hard to say anything about that, but perhaps on-chain data could provide some hints.

LINK Activity Has Been Relatively High Recently

In a new post on X, the market intelligence platform IntoTheBlock has shared the data of some Chainlink on-chain indicators. First, when the firm made the post, about 56% of the asset’s investors were sitting on some profit.

Chainlink Profit

The cryptocurrency had then been floating at higher levels than currently (although not too high), so more LINK addresses would have entered a state of loss by now.

Generally, investors in profit are more likely to sell at any point, so a large amount of them being in the green could raise the probability of a selloff. Some Chainlink investors are currently harvesting their profits, but the profitability ratio is still not skewed that much towards profits.

Next, IntoTheBlock has talked about the number of transactions on the network.

Chainlink Transactions

“The Chainlink network is showing many positive signs in terms of transaction data,” says the intelligence platform. “Notably, we see a healthy increase in the number of transactions.”

The number of transactions is up 436% from the monthly lows, and as is usually the case, the volume has also spiked alongside this rise.

Chainlink Volume

The transaction activity being high suggests there is interest behind the asset, and so, the price action shouldn’t go stale just yet. However, the volatility due to this activity can go either way, as the asset is already witnessing.

A metric that could more solidly point at a direction for the cryptocurrency is the large holder netflow, which keeps track of the net accumulation/distribution behavior over the last month for LINK holders carrying more than 1% of the supply.

Chainlink Whale Netflow

As is visible in the chart, the large Chainlink holders have been buying recently, which could potentially be a positive sign for the asset. This doesn’t have to mean that the rally would restart shortly, of course, but it does provide some support for the idea.

Chainlink Forms Sell Signal, Analyst Predicts Pullback To This Level

An analyst has pointed out how Chainlink is forming a TD Sequential sell signal right now, which could lead to a retracement to this level.

Chainlink Could Decline To $12.50 Following The Sell Signal

As explained by analyst Ali in a new post on X, LINK could be heading toward a correction based on what the TD Sequential signal says. The “Tom Demark (TD) Sequential” is a popular indicator in technical analysis that is used to pinpoint reversals in the price of any asset (which, in the current discussion, is naturally Chainlink).

The metric gives a signal whenever the asset has seen nine candles following a reversal in its price. The signal is a sell one if the candles are green, while it’s a buy one if the candles are red.

This phase is called the “setup phase.” Once the setup is done, a 13-candle long countdown phase kicks off. At the end of these 13 candles, the price could be believed to have hit another probable bottom or top (depending on whether the phase started with a sell or buy signal).

Chainlink has recently been enjoying some very rapid growth, which has led to the asset’s price hitting heights not seen since April of last year. This run, however, may be going toward at least a temporary setback, as according to Ali, a TD Sequential setup phase seems to have finished for the cryptocurrency recently. The signal has in fact appeared on not just one, but three of the coin’s price charts: daily, 3-day, and weekly.

Here are the charts as shared by the analyst:

Chainlink Sell Signal

As displayed in the above graph, the Chainlink TD Sequential setup phase has finished with green candles on all of these LINK charts, implying a reversal towards the bearish side may be imminent for the cryptocurrency.

Ali anticipates that the retracement would be towards the $12.50 level, which would mean a drawdown of more than 18% from the current price level of the asset. “Failing to hold above this critical support area could extend the losses to $10.50,” the analyst further adds.

Such a decline all the way to $10.50 would suggest a decrease of over 31% for Chainlink, but even if such a steep drop happens, LINK still wouldn’t have fully undone the recovery it has made since the last third of October, showing just how sharp the asset’s bullish momentum has been recently.

It now remains to be seen what trajectory the asset takes from here considering this bearish signal. So far, chances are not looking in the favor of the coin, as it has seen two red candles already since the pattern has formed, implying that the countdown phase might have begun.

LINK Price

Chainlink had risen above the $16.5 mark during the weekend, but the coin has taken a hit in the past day as it’s now close to the $15 level.

Chainlink Price Chart

Chainlink Has Massive Resistance Ahead, Will The Rally End Soon?

On-chain data shows there is major resistance ahead for Chainlink, a sign that could be troubling for the rally’s sustainability.

Only 55% Of Chainlink Investors Are In Profit So Far

As explained by an analyst in a post on X, Chainlink is still behind Bitcoin in terms of investor profitability despite the LINK price outperforming BTC in the year so far.

The below chart shows what the LINK address concentration looks like on the different price ranges that the asset has previously visited:

Chainlink Cost Basis

Here, the size of the dot represents the number of investors or addresses who purchased their coins inside the particular price range. It would appear that the ranges below $10 are host to the cost basis of a hefty number of holders.

Since the LINK price is above these levels right now, these investors would naturally be in a state of profit. These addresses only make for about 55% of the network total, however, implying that a significant number of them are still sitting at a loss. From the chart, it’s visible that the $16 to $27 range in particular has a considerable density of investors.

In on-chain analysis, major support and resistance levels are defined on the basis of the number of investors that are at a particular range. This is because of the fact that whenever the spot price interacts with the cost basis of an investor, they become more likely to show a move.

When the price retests the cost basis from above, the holder may decide to buy more. The reason behind this is that they might tend to believe that the level, which had been profitable for them earlier, might produce gains in the future again, so it would appear like an ideal point of accumulation for them.

On the other hand, the red holders might see the break-even point as a decent exit point, as they might fear that the cryptocurrency would go back down in the near future, so going out here at least means they can avoid taking any losses.

Such buying or selling from just a few investors when the price retests their common cost basis doesn’t produce any effects on the macro scale, but if a large number of investors bought at the same level, the reaction might be more pronounced.

Thus, the Chainlink levels ahead until the $27 mark might prove to be a source of some heavy resistance, making the rally hard to sustain through them.

The analyst notes, however, “once LINK breaks the $27 mark, the ensuing rally is expected to be substantial. Alongside this, the wallet profitability ratio is projected to surpass 80%.”

As mentioned before, Bitcoin’s investor profitability distribution is looking much better so far, as the below chart from IntoTheBlock shows:

Bitcoin Cost Basis

Bitcoin is currently battling against the resistance offered by the current investor-packed $34,100 to $35,100 range. Once BTC is through these levels, however, the road towards $40,000 might prove to be relatively easy.

LINK Price

Following its 12% rally in the past week, Chainlink is now sitting just below the $12.9 mark.Chainlink Price Chart

Four Reasons Why Investors Are Bullish On Chainlink

Chainlink’s recent price surge of 63% has turned heads in the cryptocurrency community. This uptrend begs the question: what’s driving investor confidence in Chainlink? Let’s dive into four key reasons that might be contributing to this bullish trend.

#1 Chainlink Dominance In The Oracle Space

Oracles act as a bridge between blockchain networks and the external world, fetching data that decentralized applications (dApps) rely on to function. This data can vary widely, from cryptocurrency price feeds essential for decentralized financial (DeFi) platforms to weather information or the results of real-world events for betting platforms.

Related Reading: November Outlook For Bitcoin Price: Another Pump Or Retrace?

Chainlink has emerged as the leader in this pivotal market, capturing a 47% share with its extensive network of over 1,000 oracles and support for 14+ blockchain platforms. By positioning itself as the primary provider of external data integration, Chainlink has become an essential component of the blockchain infrastructure.

#2 Other Products By Chainlink

Expanding beyond its initial focus on data feeds, Chainlink now offers a broad spectrum of blockchain services that have significantly strengthened its market presence:

  • Verifiable Random Function (VRF) – a verifiable method of producing complete randomness at a low cost, particularly useful to create random outcomes within gaming and gambling applications, as well as for any application requiring unpredictability in its protocol.
  • Automation – allows smart contract developers to utilize Chainlink’s infrastructure to automate their smart contracts cost-effectively and securely, which is crucial for the scalability and efficiency of decentralized applications (dApps).
  • Cross-Chain Interoperability Protocol (CCIP) – enabling seamless interaction and transfer of data and value across blockchain networks. This interconnectivity is pivotal for a more integrated and accessible blockchain ecosystem.

The introduction of CCIP, especially, underscores Chainlink’s commitment to driving the industry forward. It simplifies the user experience and broadens the potential use cases for blockchain technology, aspects that are highly attractive to institutional investors looking to enter the space.

#3 Institutional Interest

Chainlink’s CCIP and other products have allowed it to collaborate with big institutions, such as:

  • SWIFT – a global financial network that 11,000+ financial institutions use to securely transmit information and value, up to trillions of dollars.
  • DTCC – a global financial entity that processes and settles security transactions totaling quadrillions of dollars.
  • ANZ – one of the big four banks in the Asia-Pacific region, handling billions of dollars annually.
  • Other notable institutions working with Chainlink are BNP Paribas, Citi, and PwC Germany.

These partnerships highlight that institutions see the potential opportunity for blockchains and real-world systems to interact effectively. Chainlink’s co-founder Sergey Nazarov says:

It’s now clear that both top global banks and leading market infrastructures believe there will be greater adoption of digital assets across the entire banking industry, and that this adoption will happen using multiple different blockchain technologies at the same time.

#4 Bullish Price Action

Chainlink had traded between $5 and $9 between June 2022 and September 2023. In October, its price finally managed to break out of this range after an increase of 63%, reaching $12. This price increase was one of the largest within the cryptocurrency market, highlighting the faith investors have in this token.

Related Reading: Bitcoin Season: Leading The Charge In The Crypto Market

The price currently sits in a previous trading range between $11 and $17. For the price to reach the top of this range, it would have to climb another 50%.

With its previous all-time highs of $53, it suggests there is still much room for Chainlink’s price to grow. Specifically, a 340% increase would have to occur for it to reach its previous highs.

Predycto is the author of a cryptocurrency newsletter. Sign up for free. Follow @Predycto on Twitter.

Analyst Forecasts Chainlink (LINK) To Fall Below $10 Following Massive Price Surge

Chainlink (LINK) has emerged as one of the top cryptocurrencies in the last week following an impressive market performance which saw the token gain by 46.49% in the past seven days.

Even amidst whale movements, which suggest that investors are taking profit, LINK has managed to maintain its bullish momentum, gaining by 6.10% in the last day to above the $11 mark.

However, despite the positive sentiment that has currently overwhelmed the LINK market, some analysts believe the token may be due for a major retracement. 

LINK To Fall Below $10: Is The Bullish Run Over?

In a post on X on Friday, crypto analyst Altcoin Sherpa shared a prediction that LINK may soon experience a price dip, falling as low as $9.50. 

However, Altcoin Sherpa notes that this potential price loss may not spell the end of LINK’s bullish phase. In fact, the analyst describes the token’s price coming down as “healthy.” 

According to Sherpa’s prediction, LINK’s slide below $10 could simply be a price recorrection before the token resumes its upward trajectory. If this forecast proves true, many traders could view this $9.50 region as a great entry zone.

Interestingly, Cryptonary, another analyst on X, has recently shared a similar price prediction.

In a post on Thursday, Cryptonary called for much caution in the LINK market, stating the crypto asset may not sustain its current high price levels for long. 

To back up this forecast, the analyst states the Relative Strength Index (RSI) shows that Chainlink is currently in the overbought zone, which indicates a price pullback lies on the horizon.

Although many traders have opened long positions on LINK as indicated by the market’s positive funding rates, Cryptonary has advised investors against “joining the crowd”

Similar to Altcoin Sherpa, the analyst predicts LINK’s price to fall to $9.67 for a short-term retracement. However, with strong selling pressure, Cryptonary states that LINK could trade as low as $8. 

At the time of writing, LINK trades around $11.54 with a 0.25% gain on the last day. Meanwhile, the token’s trading volume is up by 8.01% and valued at $824.92 million. 

Chainlink Records Partnership Streak

In other news, Chainlink recently shared with the crypto community its streak of collaborations with major traditional brands in promoting the adoption of blockchain technology.

In a thread posted on X on Friday, the blockchain highlighted its partnership with the Swift payment company aimed at facilitating the seamless transfer of tokenized assets across multiple chains using Chainlink’s Cross Chain Interoperability Protocol  (CCIP). 

In addition to Swift, Chainlink also discussed its partnership with the Depository Trust and Clearing Corporation, the Australia and New Zealand Banking Group Limited, and Vodafone Digital Asset Breaker (DAB).

Chainlink

Chainlink (LINK) Rides Bullish Waves With 42% Gains In The Week, Is $15 Possible?

LINK recorded impressive gains in the past week, with an over 43% seven-day price increase. However, the token’s price has slightly retraced in the last 24 hours, likely due to buyers taking profit after an aggressive accumulation phase for LINK tokens. 

Chainlink’s notable uptick could be due to the ongoing bullish waves in the broader crypto market. Bitcoin, the flagship cryptocurrency, recorded a significant uptick, surging to nearly $35,000, the highest in over a year. 

Bitcoin’s performance triggered a wave of optimism across the crypto market, causing most coins, including LINK, to soar. Moreover, Chainlink’s CCIP has recorded additional adoption and likely consolidated on LINK’s price gains. 

But how far can the ongoing bullish momentum take LINK? Can it conquer prevailing resistance to reach $15? Let’s find out! 

LINK Shows Signs Of Retracement, Is $15 Possible?

LINK is in an uptrend after breaching the $6.99 support level as buyers re-entered the market and forced a rally to the $11.9 resistance level. 

LINK’s rally began last week when it surged from $7.42 on October 16 to $10.41 on October 23. While the rally has stalled, the latest strides show that buyers are intent on facilitating further rallies to retest the $11.9 resistance

A move above this level would empower LINK to target $15. Moreover, the higher high candlesticks on the chart imply that LINK will likely consolidate on its rally in the coming days. 

Additionally, the Moving Average Convergence/Divergence (MACD) is above its signal line, displaying a strong buy signal. The green Histogram bars confirm this signal, which implies that LINK buyers are still active. 

LINK trades at $11.003, with a 1.62% increase in the last 24 hours. Based on LINK’s trajectory, it will likely break above the $11.9 resistance to reach $15 in the coming weeks if buyers sustain their charge. 

LINKUSD price chart

What Is Driving LINK’s Price Gains?

Besides the general uptrend in the crypto market, Chainlink has recorded notable developments within its ecosystem, likely sustaining its price gains.  

One such is the integration of Chainlink’s CCIP by DeFi provider Affine. The Chainlink CCIP is the new industry standard for secure cross-chain linking on Ethereum and Polygon mainnets. 

Affine hopes to leverage the CCIP’s messaging abilities to create a cross-chain NFT bridging function for Affine Pass NFTs. It will ensure seamless and secure NFT transfers between supported blockchains. 

According to Affine developers, they selected Chainlink to host the Affine NFTs due to its proven security and reliability track record. 

More so, some experts forecast that there will be up to $5 trillion in tokenized digital securities by 2030. Chainlink will likely benefit from this expansion since it is a significant player in tokenized assets technology.

With benefits such as fast transaction settlements, operational cost savings, and enhanced transparency, tokenization will likely boost Chainlink’s overall value. 

These developments are likely sustaining the price gains for the LINK token in the past week. Although LINK trades slightly above $11 today, it will likely rise to $15 if market conditions remain favorable.

Chainlink (LINK) Surge Far From Done As Crypto Analyst Predicts Rise To $15

Chainlink (LINK) is one of the altcoins that have enjoyed a massive resurgence in recent days alongside the flagship cryptocurrency, Bitcoin. The token rose to as high as $10 on October 23 and seems to have established support at that level. Following this, some crypto analysts have gone on to analyze whether or not it can sustain this momentum.   

Can The Chainlink Rally Be Sustained?

In a post shared on his X (formerly Twitter) platform, crypto analyst Felix drew up an analysis of LINK’s price movement on the charts, noting that the token could see “further price movement, especially if it claims above the critical 500+ day resistance at >$9.6.”

Chainlink LINK

Source: X

He also seemed to suggest that a period of whale accumulation may have led to this price surge as over $9.92 million worth of LINK tokens were sent out of exchanges to wallets when it was still trading at around $7.26. LINK has risen by over 33% since then. 

Chainlink LINK $15

Source: IntoTheBlock

Felix highlighted the fact that the Chainlink ecosystem was displaying impressive on-chain strength at the moment, which ultimately leads one to question whether or not the rally can be sustained.

LINK’s Figures Are On The Rise

As Felix pointed out, LINK’s price seems to be experiencing an ‘up-only’ trend currently, and all other metrics are not left behind as the ecosystem is also seeing an increase in the number of active and new addresses. According to data from IntoTheBlock, the number of active addresses on the Chainlink network is steadily rising alongside the price increase.

In the last 7 days, the network has seen an increase of over 112% in the number of active addresses on the network. Meanwhile, there has also been an increase of over 190% in the number of new addresses on the network. 

As expected, the number of transactions on the network has also risen during this period, with Chainlink recording a 7-day high of over 12,000 transactions on October 23. Consequently, the trading volume is up over 7% in the last 24 hours, according to data from CoinMarketCap. 

There is also reason to believe that this momentum might be far from over, as fundamentals seem to be contributing to the bullish sentiment. If so, there is more good news ahead for the Bulls and Chainlink community as the Chainlink Staking v0.2 is set to launch before the year runs out. Many believe that LINK maximalists are going to continue to accumulate ahead of the launch.  

In reaction to an X post about an impending launch of the Staking v0.2, one crypto analyst boldly asserted that LINK could rise to as high as $15 later this year. 

Chainlink LINK price chart from Tradingview.com

Chainlink MVRV Enters Bearish Zone As LINK Breaks $10, Correction Soon?

On-chain data shows the Chainlink MVRV ratio has shot up as LINK has rallied above $10, a sign that a steep correction may be due for the asset.

Chainlink 30-Day MVRV Ratio Has Crossed The Bearish 20% Mark

As explained by an analyst in a post on X, the last three times the LINK MVRV ratio hit similar levels as now, the cryptocurrency registered a sharp drawdown. The “MVRV ratio” (where MVRV stands for Market Value to Realized Value) is an indicator that measures the ratio between the Chainlink market cap and the realized cap.

The realized cap here refers to a LINK capitalization model that assumes the true value of each coin in circulation isn’t the same as the asset’s spot price, but rather the price at which the coin last moved on the blockchain.

This price at which the coin was last transferred could be imagined to be the value at which its holder bought it, so the realized cap takes into account the prices at which each investor in the market acquired their LINK.

Thus, the realized cap is essentially a measure of the total amount of capital the holders as a whole have invested into Chainlink. Since the MVRV ratio compares the market cap with this metric, it can provide us with info about the profit/loss situation of the investors.

Now, here is a chart that shows the trend in the 7-day moving average (MA) of the ChainlinK MVRV ratio over the past year and a half:

Chainlink MVRV ratio

Note that in the above graph, the MVRV ratio shown isn’t just the ordinary version, but rather the 30-day one. What this means is that this indicator only takes into account the data of coins that were moved within the past month.

From the chart, it’s visible that the Chainlink 30-day MVRV ratio has observed a strong rise recently as the price of the cryptocurrency has enjoyed sharp upward momentum.

The metric has crossed the 21% mark with this increase, suggesting that the investors who bought within the last 30 days are holding 21% more in value than what they put in.

Usually, the more the profits held by the investors, the greater their probability of giving in to the allure of profit-taking. As such, whenever the investors are carrying a high amount of profits, the risk of a correction taking place can become significant.

In the current case, the Chainlink investors are those who only bought within the past 30 days, which means that this cohort is bound to have fickle-minded hands who would easily be tempted to harvest their gains.

As the analyst has marked in the chart, it would appear that the last three times the MVRV ratio crossed above 20% for this group, the LINK price observed a sharp decline.

In the first two cases, this drawdown was 34% each, while in the third and latest one, it was about 14%, which is still quite a notable drop. If this pattern is anything to go by, Chainlink may see another such correction soon.

LINK Price

Chainlink has seen another 9% rise during the last 24 hours as its price has now broken above the $10.1 mark.

Chainlink Price Chart

Chainlink Whales Moved Around $150M In LINK Before Latest Surge: Data

On-chain data shows the Chainlink whales showed some high activity right before the latest surge in the cryptocurrency took place.

Chainlink Whales Made Moves Before LINK’s 3% Surge

As pointed out by an analyst in a post on X, whales and institutional investors have shown an increasing amount of activity recently. The relevant indicator is the “large transactions volume” from the market intelligence platform IntoTheBlock, which keeps track of the aggregate volume of Chainlink transactions larger than $100,000.

Generally, the whales and institutional entities are the only investors capable of shifting such a large amount with a single transaction. These holders carry large balances in their wallets, making them influential on the network.

When the value of this metric is high, it means that these humongous investors are moving around large amounts right now. Such a trend implies that these investors are participating in some trading activity.

However, this metric alone can’t discern exactly what kind of activity it is, as both selling and buying transactions appear the same on the blockchain and count towards this volume.

On the other hand, when the indicator has low values, it suggests that the whales and institutional players aren’t interested in the cryptocurrency as they aren’t making too many moves. Now, here is a chart that shows the trend in the Chainlink large transaction volume over the past few weeks:

Chainlink Large Transactions Volume

As displayed in the above graph, the Chainlink large transactions volume registered a spike recently, implying that the whales had been moving many tokens across the network.

At the peak of this spike, the whales transferred around 20.38 million LINK within 24 hours. This stack would be worth over USD 150 million at the current exchange rate.

It’s uncertain why these humongous holders suddenly showed so much activity, but perhaps the surrounding price action could hint at it. This spike was seen a few days back, and since then, Chainlink has observed some net uptrend.

Thus, the timing of the transactions could suggest two likely possibilities. These large investors bought in anticipation of this rally (perhaps due to some inside information), or their buying is why the price surge found its appropriate fuel in the first place.

Either way, it’s a positive sign that the whales and institutional investors have recently participated in potential accumulation activity. In the coming days, this metric can be the one to keep an eye on, as further activity from these holders could signal that more volatile price action may be ahead.

Once again, though, any future spikes could arise from both buying and selling, so they won’t necessarily be a bullish signal for Chainlink like this latest one turned out to be.

LINK Price

At the time of writing, Chainlink is trading around $0.74, up more than 3% in the past week.

Chainlink Price Chart

Buy LINK Now? Chainlink Touted As ‘Safest Bet’ For This Mega Trend

Real-world assets (RWAs) are emerging as one of the next mega trends in the crypto space, and according to a recent study by K33 Research, Chainlink could profit in a big way from this trend. In a recent study, the research firm projected that LINK would be the “safest bet” to capitalize on this impending boom. This sentiment reflects the broader industry outlook, especially given BlackRock CEO Larry Fink’s earlier comments in May where he noted the potential of tokenization in securities.

“The next generation for markets, the next generation for securities, will be tokenization of securities,” remarked Larry Fink during a New York Times DealBook event. He further elucidated that tokenization, which is the creation of a digital representation of an asset on a blockchain, would facilitate “instantaneous settlement” and notably reduce transactional fees.

What Makes Chainlink The Go-To Choice?

The growing interest in the tokenization of RWAs, which includes traditional financial instruments like private equity, credit, and bonds, has paved the way for the increasing valuation of LINK. Tokenization is no longer a buzzword but a mechanism to optimize financial transactions by reducing costs, streamlining operations, and enhancing transparency and accessibility.

David Zimmerman, an analyst at K33 Research, mentioned, “If we wish to have exposure to the RWA narrative and avoid being sidelined when it takes off, LINK is the safest bet.”

Global financial institutions and emerging cryptocurrency platforms are gearing up to leverage this trend. A testament to this is JPMorgan’s recent announcement about its first live blockchain-based collateral settlement transaction, which involved industry giants BlackRock and Barclays.

Chainlink, as a project, has strategically positioned itself in this domain, acting as a bridge between blockchains and the external world. The project’s unique system of oracles and an expansive list of partnerships emphasize its pivotal role.

“Chainlink, with its system of oracles and wide partnerships, is well-positioned to connect blockchains with real-world data, making it a strong player in the RWA narrative,” stated renowned crypto analyst Scott Melker, echoing Zimmerman’s insights.

Zimmerman further opined that while Chainlink might not record the highest gains in this RWA movement, its robust infrastructure and pivotal role in the ecosystem make it one of the most well-placed projects to harness the potential benefits.

Despite the undeniable potential and traction that RWAs have gained, Zimmerman highlighted potential challenges in realizing their full potential. Yet, the prevailing narrative’s allure is so compelling that we might witness “an isolated RWA crypto bubble” even before its tangible real-world impacts become ubiquitous.

Zimmerman’s advice to potential investors is to be patient. The recommendation is to wait for the token to hit the long-term support level of around $5.70 before diving into long positions.

LINK Price Remains Trapped In Trend Channel

The Chainlink price has been trading within a descending trend channel since June last year. Even the recent hype around the partnership with Swift and the SmartCon was not enough to push LINK out of the trend channel. In total, LINK has been rejected at the upper trendline six times, last on October 1.

A bullish sign at the moment is that Chainlink is holding above the 50% Fibonacci retracement at $7.19 despite the sharp correction in the broader crypto market. If this holds over the next few days, LINK could attempt a retest towards the upper resistance line.

If the support breaks, K33 Research’s scenario could come true and Chainlink could fall below the $6 price again. Thus, the support is instrumental in determining whether Chainlink is currently a buy or sell.

Chainlink LINK price

Chainlink To Go “Parabolic” After Breaking 28-Month Downtrend?

Chainlink (LINK) is trading at $7.60, still unable to escape the range between $5 and $8 it has spent over a year in. Its recent attempt at a rally, however, has triggered an important “parabolic”signal following a length, 28-month long downtrend.

Chainlink Taps Parabolic SAR After 28-Month Downtrend

Chainlink earned itself a reputation as a “blue chip” cryptocurrency during the last bear market. While Bitcoin, Ethereum, and other altcoins remained relatively bearish until the end of 2020, LINKUSD defied all odds and expectations by rising nearly 10,000% leading up to the same timeframe.

From October 2020 when the rest of the crypto market broke out, Chainlink still did another 600% before reaching a peak at over $50 in May 2021. But since then, it has been almost all downhill and a lot of sideways.

After that price peak, a rejection all the way down to $15 in the same month set the downtrend in motion. At that moment, it also tagged the Parabolic SAR, signaling that the uptrend had “stopped and reversed.”

The cryptocurrency first spent 12 months in an aggressive downtrend, followed by over 16 months of painful sideways. In total, the coin lost 90% of its value from top to the current local bottom. But what’s next now that the Parabolic SAR has been touched once again?

LINKUSD_2023-10-06_11-45-03

Is LINKUSD Ready For A 1,000% Rally? How About Three Of Them?

The Parabolic SAR is a technical analysis indicator created by J. Welles Wilder, Jr., and is used to tell a trader when a trend as potentially “stopped and reversed.” It is commonly used in conjunction with Wilder’s other tools, such as the Relative Strength Index, and Average Directional Index.

Much like the tool nailed the exact trend change at the top, it might once again be accurately signally a positive trend change after 28 months of downward Parabolic SAR movement. Previous uptrend according to the 1M LINKUSD Parabolic SAR were parabolic indeed.

Across the three times where the Parabolic SAR flipped bullish, LINKUSD gained 1,000% each time. Another 1,000% rally would take Chainlink to over $80 per token. The last primary bull market in Chainlink produced not one, but three of these 1,000% rallies. A 3,000 uptrend could take the coin to over $230 each.

Coincidentally, the LMACD is also crossing bullish for the first time in 28 months, adding plenty of confluence. With the Parabolic SAR now below price, will the cryptocurrency go on another parabolic uptrend?

This chart initially appeared in Issue #22 of CoinChartist (VIP) alongside 30 other exclusive crypto charts. Subscribe for free.

Chainlink Creator Expects Mass Crypto Adoption To Send Market Cap To $10 Trillion

In a recent interview, Chainlink’s co-founder, Sergey Nazarov, said the collapse of the banking industry will drive crypto mass adoption.

Chainlink’s Co-Founder Predicts Crypto And Blockchain Prospects Over The Next Decade

Sergey Nazarov believes that the collapse of the banking industry will favor crypto adoption and growth in the next decade.

Nazarov believes the crypto industry and its technological innovations might maintain the same slow growth pace. However, the industry player cited two possible crypto and blockchain adoption scenarios in the next ten years.

First, the Chainlink co-founder proposed a fast-case scenario where the collapse of the traditional finance system puts individuals in pain. This pain will force individuals to “acknowledge the relevance” of cryptographic financial systems. 

Further, Nazarov noted that the continued collapse of banks like Silicon Valley Bank could fast-track crypto adoption. 

Secondly, based on the first theory, the collapse of traditional finance systems will lead to political tension and international problems. Nazarov believes investors will favor crypto for financial operations if the pain of suffering losses becomes unbearable. 

Therefore, Nazarov insists that even in the slow case, the crypto market is likely on its way to a $10 trillion market cap. 

LINKUSD price chart

Chainlink’s Adoption By ANZ Banking Group Supports Nazarov’s Growth Theory

According to a new industry report, ANZ Bank has adopted Chainlink’s CCIP for cross-chain tokenized asset settlement. CCIP solution helps to transfer data and tokenized assets across blockchains in a decentralized and secure way, according to the crypto founder. 

Notably, ANZ Bank is one of the world’s largest banks, with over $1 trillion in total assets managed. Sergey Nazarov noted that Chainlink’s adoption by ANZ shows how large companies are now adopting Chainlink’s CCIP. 

Also, the co-founder stated that building on a global internet needs secure connectivity between private bank chains and public chains. 

The CCIP is an upgrade on the Chainlink Network that functions as a global Internet of Contracts. This upgrade aims to create the world’s largest liquidity layer across various regions and markets. 

Remarkably, Nazarov stated that CCIP can create a higher level of cross-chain security. It achieves this extra security with multiple layers of decentralization and advanced risk management techniques. 

Moreover, most cryptocurrencies offer users fast and secure cross-border transactions cheaply. However, some critics still insist that cryptocurrencies are unreliable based on their volatility and crisis in the sector. 

With innovations like the CCIP of Chainlink, more banks may integrate crypto and blockchain-based solutions. This drives crypto to mainstream adoption, increasing the market cap to $10 trillion, as Nazarov predicts.

Meanwhile, the collapse of banks such as Silicon Valley Bank (SVB) in 2023 has strained the global finance economy. If another banking crisis occurs, cryptocurrencies might become the preferred option for most investors based on their rising utility.

Chainlink Signal That Preceded Crashes Of 34% Is Back

An on-chain signal that preceded crashes of at least 34% for Chainlink in the past has once again formed for the cryptocurrency.

Chainlink 30-Day MVRV Ratio Recently Hit The 20% Mark

As explained by an analyst in a post on X, the last two times the 30-day MVRV ratio broke above the 19% level, the price of LINK registered a sharp decline. The “Market Value to Realized Value (MVRV) ratio” is an indicator that measures the ratio between the Chainlink market cap and the realized cap.

The “realized cap” here refers to the total amount of capital that holders of the cryptocurrency have invested into it. As the MVRV ratio compares the spot valuation (the market cap) with the amount that the investors bought the asset with, its value can provide hints about whether the holders as a whole are in profits or not.

When the metric has a value greater than 1, it means that the market cap is more than the realized cap, and hence, the average investor is in profit right now. The more the holders get into profit, however, the more likely they become to sell, so high values of the MVRV ratio can suggest the asset is becoming overpriced and a correction may be due.

On the other hand, values under the threshold suggest the cryptocurrency may be undervalued currently as the overall market is holding some net unrealized losses.

Now, here is a chart that shows the trend in the 30-day version of the Chainlink MVRV ratio, which looks at the profitability of only the investors who bought within the past month:

Chainlink MVRV Ratio

In the above graph, the value of the 30-day MVRV ratio is represented as a percentage relative to the break-even level. As is visible, this indicator has observed some sharp uptrend recently as Chainlink has enjoyed its rally.

During this latest rapid growth, the metric had managed to hit a peak of 20%, which means that the market cap had become 20% more than the realized cap of the 30-day investors.

The analyst has pointed out an interesting trend that LINK has followed during the past couple of years. It would appear that whenever the 30-day MVRV ratio has broken above the 19% mark, the cryptocurrency has followed up with a steep drawdown.

This has happened two times in the period of the chart and coincidentally, Chainlink’s decline was about 34.5% in both of these instances (although the time the drawdown was spread out over was different in the two cases).

Since the 30-day MVRV has once again surged above this apparently significant level, it’s possible that LINK may also register a similar drop in the coming days or weeks.

LINK Price

Chainlink has observed some sharp uptrend over the past month, as its price is currently trading just under the $8 level, having gone up almost 34% in the period. If the MVRV ratio is anything to go by, though, this impressive run may finally be coming to an end.

Chainlink Price Chart

LINK Price Primed For Meteoric Rise: Analyst Predicts 130% Rally To $18

The LINK price is no stranger to bullish rallies, and in September alone, the token has gone from a low of $5.8 to a peak of $7.9. Even now, bullish momentum among enthusiasts has not waned, especially with a 130% price increase prediction from a crypto analyst.

LINK Price Prediction Ahead Of October

In the analysis posted to TradingView, pseudonymous analyst Babenski explains the reasoning behind the $18 surge presented in their chart. First, it points to the $5.8 low that was recorded back in mid-September which is identified as the accumulation range.

This is not out of the ordinary given the massive buying that took place when the LINK price fell to $5.8. This accumulation was the reason behind the support that was generated shortly after, which served as the lift-off point for the rally toward $8.

Despite already seeing a nice 35% jump from its September lows, the analyst sees further upside. Putting the peak of the rally at $18 means that the LINK price could rise another 130% if it plays out as expected.

LINK price chart from Tradingview.com crypto analyst

The first roadblock is a retracement that was placed just above the $8 level, and LINK is already seeing a similar retracement after almost touching $8. Going by the analyst’s chart, the price could decline a bit further before picking up once more and then shooting straight to $18.

There is no timeframe added for when the LINK price would reach this price. But with September drawing to a close, October-November is more likely.

LINK Whales Take Initiative

The accumulation trend pointed out above has been mainly mounted by the LINK whales. Crypto analyst @ali_charts shared a chart on X (formerly Twitter) that showed that whales holding between 10,000 and 1,000 coins have been the main buyers.

According to Ali, these whales bought up more than 7.5 million tokens in a matter of weeks which translated to about $53 million spent buying LINK. As the LINK price has risen, these holders are seeing profit on their purchase, which could explain the downward correction in the LINK price in the last day.

Nevertheless, the digital asset remains bullish, especially with the whales still holding more than 206 million coins. This suggests that they are not tempted to sell into the present rally and could be holding on for higher prices.

LINK has been an impressive performer so far this week. It is up 15% on the 7-day chart, making it the best performer of the top 20 cryptocurrencies by market cap.

Chainlink (LINK) Brushes Off Market Downtrend, Scores 11% In Last Week

Chainlink has remained bullish despite the bearish pressure in the broader crypto market. The crypto closed bullish at $7.4 yesterday, September 26, with over 7% increase. 

LINK remains bullish, with an 11% seven-day price increase and over 2% gain in the last 24 hours. But while the token’s price continues to increase, data shows the trading volume has declined 17% in the last 24 hours. What could be the reason behind this contradiction?

Chainlink Price Continues To Surge

In an X post on September 24, Chainlink network announced it had recorded multiple integrations across six blockchains. These include Arbitrum, Ethereum, Optimism, Avalanche, Polygon, and BNB Chain.

Also, yesterday, September 26, gaming platform BetSwirl announced that it integrated Chainlink’s CCIP across Ethereum, Polygon, Avalanche, and Arbitrum. According to the post, this CCIP integration will help “BetSwirl enable seamless, secure, and reliable cross-chain token transfers”

Related Reading: XRP Price Analysis: 4-Month Chart Dynamics Decoded By Crypto Analyst

This increased adoption across multiple chains expanded Chainlink’s user base, a plausible factor behind LINK’s resilience amid the prevailing bearish market.

Although LINK briefly slipped off the $7.5 level to $7.3 yesterday, it has since recovered momentum. Given the ongoing movement, the crypto asset could break the $7.8 resistance and record higher highs soon.

Meanwhile, Chainlink (LINK) is number 3 among the top weekly gainers after CRV and PEPE. It has also secured a position on the top daily gainers’ chart.

Although the price strides are bullish, the trading volume, down 17%, raises concern about whether LINK can sustain the rally. It indicates reduced trading activity, a possible sign that buyers have reached saturation and paused to weigh their next move. 

This setup bodes badly for LINK as it could signal the entrance of sellers, which will exert downward pressure on the token’s price.

LINKUSD price chart

Price Surge Drops Chainlink (LINK) Supply On Crypto Exchanges

According to Santiment’s report on September 24, Chainlink remains one of the best-performing cryptocurrencies in September. It outlined that, unlike most assets, LINK’s price often records an initial boost when holders move their tokens from exchanges.

Santiment noted that the asset’s price increased 23% in two weeks as the exchange supply flowed back to cold wallets. Also, the analytics platform reported that LINK exchange supply increased by 17.2%, reaching a 2023 high on September 14.

However, on September 24, 10 days later, the token’s exchange supply dropped to 16.4%. This observation is a plausible reason behind Chainlink’s declining trading volume. 

Meanwhile, as of the time of writing, LINK trades at $7.64, with a 2.88% price increase in the last 24 hours. The token trades above the simple moving averages of $6.494 and $6.719 and two key support levels. 

LINK is approaching the overbought area, forming a bullish candlestick as buyers vie to conquer the $7.823 resistance.

LINK Price Extends Increase, Will Chainlink Bulls Be Able to Hit $8.5 Milestone?

Chainlink’s LINK price is moving higher above the $7.25 resistance. The price is now consolidating gains and might aim for more upsides above $7.50.

  • Chainlink price is showing positive signs above $7.25 against the US dollar.
  • The price is trading above the $7.30 level and the 100 simple moving average (4 hours).
  • There is a key bullish trend line forming with support near $7.25 on the 4-hour chart of the LINK/USD pair (data source from Kraken).
  • The price could restart its increase unless there is a close below the $6.95 support.

Chainlink (LINK) Price Eyes More Upsides

In the last LINK price prediction, we discussed the chances of more gains above the $7.00 level against the US Dollar. The price did remain stable and extended gains above the $7.25 level.

The price even broke the $7.50 level. Chainlink traded as high as $7.56 and outperformed Bitcoin and Ethereum. Recently, there was a minor downside correction below $7.40. The price tested the 23.6% Fib retracement level of the upward move from the $6.60 swing low to the $7.56 high.

LINK is now trading above the $6.50 level and the 100 simple moving average (4 hours). There is also a key bullish trend line forming with support near $7.25 on the 4-hour chart of the LINK/USD pair.

Chainlink (LINK) Price

Source: LINKUSD on TradingView.com

If there is a fresh increase, the price might face resistance near $7.45. The first major resistance is near the $7.50 zone. A clear break above $7.50 may possibly start a steady increase toward the $8.00 and $8.20 levels. The next major resistance is near the $8.50 level, above which the price could test $8.80.

Are Dips Limited?

If Chainlink’s price fails to climb above the $7.50 resistance level, there could be a downside extension. Initial support on the downside is near the $7.25 level.

The next major support is near the $6.95 level or the 61.8% Fib retracement level of the upward move from the $6.60 swing low to the $7.56 high, below which the price might test the $6.80 level. Any more losses could lead LINK toward the $6.60 level in the near term.

Technical Indicators

4 hours MACD – The MACD for LINK/USD is losing momentum in the bullish zone.

4 hours RSI (Relative Strength Index) – The RSI for LINK/USD is now above the 50 level.

Major Support Levels – $7.25 and $6.95.

Major Resistance Levels – $7.50 and $8.50.

Chainlink (LINK) Spikes 6% On The Weekly Chart As Market Sees Correction

The crypto market cap has declined over 1% in the last 24 hours, transmitting losses across the market. Top coins like Bitcoin and Ethereum have taken the hit, losing 3% and 4% of their past week’s gains, respectively. 

However, Chainlink (LINK) resisted the prevailing bearish market forces amid this onslaught, holding 6.51% gains on the weekly chart. Also, the token has recorded a 1.68% price increase in the last 24 hours. 

Amid the upturn, LINK has broken past the $7 price mark; could it ride the prevailing bullish waves to record new highs? Let’s find out.  

ChainLink’s Daily Active Addresses Hits A 2-Month High 

LINK’s price uptick comes amid a significant increase in active unique addresses on the network. Data from leading on-chain analytics firm Santiment shows that Chainlink’s unique addresses exceeded 3,900 for the first time since July 21. 

Furthermore, this uptick indicates increased network activity and engagement, reflecting the rising community interest and involvement. Moreover, increasing unique active addresses is often synonymous with increased usage and adoption of the network’s native token, LINK. And this could be seen in the increase in LINK’s market value over the past seven days. 

In addition, an update on Chainlink adoption shows four of the network’s services integrated across six different chains. These chains include Arbitrum, Avax, BNB Chain, Etherem, Optimism, and Polygon. 

Again, these integrations further reflect a wider usage of the LINK token and increased participation in the Chainlink ecosystem. It shows that more people are adopting Chainlink, exerting a higher buying pressure on LINK, a plausible explanation for the ongoing price uptick.

LINKUSD price chart

Chainlink (LINK) Breaks The $7 Resistance; What’s Next?

The daily LINKUSD chart below suggests that LINK is gearing up to hit $8 as it conquers critical barriers while buy pressure remains high.

After posting notable gains over the past eight days, LINK trades above two key support levels, $5.72 and $6.595. The token’s price oscillated between these key price levels from mid-August to September 18. 

Meanwhile, all this time, LINK traded below two critical points, the 200-day and 50-day moving averages ($6.488 and $6.706), before a sharp spike pushed it above $6.8. It maintained the momentum through the past few days, breaking the $7.00 barrier, and now targets the $7.8 resistance level.

LINK now trades above the 50 and 200-day price levels, indicating a strong bullish momentum in the market. If the ongoing buy frenzy continues, LINK could reclaim the year-high of $8.898, recorded on November 7, 2022. And if the buying strength continues to increase, the token could even set a new record high in the coming days.

However, while LINK has regained over 21% of its past month’s gains in the ongoing rally, the token remains 9% down from its year-high, and he bulls must increase momentum for the token to reclaim this level.

Featured image from Pixabay and chart from TradingView.com

LINK Price Prediction: Chainlink Recovery Stalls But Not Likely Over

Chainlink’s LINK price recovered above the $6.50 resistance. The price is now correcting gains, but it might find bids near $6.40 and could start a fresh increase.

  • Chainlink price is showing positive signs above $6.5 against the US dollar.
  • The price is trading above the $6.50 level and the 100 simple moving average (4 hours).
  • There is a connecting bullish trend line forming with support near $6.40 on the 4-hour chart of the LINK/USD pair (data source from Kraken).
  • The price could restart its increase unless there is a close below the $6.40 support.

Chainlink (LINK) Price Turns Green

After a steady decline, LINK price found support near the $5.75 zone against the US Dollar. A low was formed near $5.74 and the price recently started a fresh increase, like Bitcoin and Ethereum.

The price recovered above the $6.00 and $6.20 resistance levels. The bulls were able to pump the price above the $6.50 level and the 100 simple moving average (4 hours). Finally, the bears appeared near the $7.00 zone. A high is formed near $7.03 and the price is now correcting gains.

It traded below the 23.6% Fib retracement level of the upward move from the $5.74 swing low to the $7.03 high. LINK is still trading above the $6.50 level and the 100 simple moving average (4 hours). There is also a connecting bullish trend line forming with support near $6.40 on the 4-hour chart of the LINK/USD pair. The trend line is near the 50% Fib retracement level of the upward move from the $5.74 swing low to the $7.03 high.

LINK Price Prediction

Source: LINKUSD on TradingView.com

If there is a fresh increase, the price might face resistance near $6.80. The first major resistance is near the $7.00 zone. A clear break above $7.00 may possibly start a steady increase toward the $7.25 and $7.32 levels. The next major resistance is near the $7.50 level, above which the price could revisit $7.85.

More Losses?

If Chainlink’s price fails to climb above the $6.80 resistance level, there could be a downside extension. Initial support on the downside is near the $6.50 level.

The next major support is near the $6.40 level, below which the price might test the $5.90 level. Any more losses could lead LINK toward the $5.75 level in the near term.

Technical Indicators

4 hours MACD – The MACD for LINK/USD is losing momentum in the bullish zone.

4 hours RSI (Relative Strength Index) – The RSI for LINK/USD is now above the 50 level.

Major Support Levels – $6.50 and $6.40.

Major Resistance Levels – $6.80 and $7.00.

Chainlink (LINK) Notches 9% In One Day As Market Rebounds, What’s Next?

Oracle service provider Chainlink native token LINK has surged today as the crypto market records a significant uptick. The cryptocurrency is up by 9.02%, trading at $6.80 with a trading volume of $198 million, representing an over 179% increase in the last 24 hours.

One of the factors likely to affect LINK’s price growth in the coming days is the massive movement of tokens from the network’s wallet to exchanges. On September 16, four wallets associated with Chainlink transferred 18.75 million LINK tokens across various platforms, amounting to $119 million. 

These wallets were originally intended for holding tokens that were not yet in circulation. But recently, around 15.7 million LINK tokens (approximately $100 million) left these wallets headed straight to Binance. Furthermore, 3.05 million LINK tokens (roughly $19 million) left the wallets in a multi-signature wallet identified as 0xD50f.

Following these significant on-chain activities and potential implications, investors are eager to see how LINK price will react.

LINK Breaks Above $6.3 Resistance Level

LINK is in an uptrend, forming a bullish engulfing pattern to break above the $6.3 resistance level. Although LINK is still below its 200-day Simple Moving Average (SMA), today’s green candle has broken above the 50-day SMA, showing increased pressure from buyers. 

The buyers at the $6.1 support level have forced the crypto coin to rally after the brief retracement between September 16-17. Also, the Relative Strength Index (RSI) displays a value of 58.00, rising from the neutral zone and approaching the overbought region of 70. 

LINK has overcome the $6.3 resistance level today. Therefore, the buyers will likely sustain the rally in the coming days. Furthermore, the Moving Average Convergence/Divergence displays a strong buy signal confirmed by its green Histogram bars. 

The cryptocurrency will likely record more price gains in the coming days if the buyers continue to accumulate the tokens. However, the unlock and transfer of 21 million LINK tokens on September 16 could lead to a brief retracement in the long term when the buyers relent.

LINKUSD price chart

Whales Increase Holdings After Swift Test

Since August 31, when Chainlink entered into a partnership with Swift and other companies, LINK has exhibited positive market moves. The interbank communication system Swift and Chainlink, successfully transferred tokenized value across various private and public blockchains in an experiment. 

The positive development boosted investors’ confidence in buying more LINK tokens, potentially pushing the token’s value up. On September 7, Santiment noticed that Chainlink’s top-tier holders, those with 10,000-100,000 LINK tokens, were actively increasing their holdings.

The number of wallets holding 10,000 to 100,000 LINK tokens increased to 3,127, the highest since December 3, 2022. These wallets collected $9.6 million worth of LINK in just three days, 0.154% of the total supply. Additionally, Santiment’s report showed that 98 new wallets in this category were created.

On September 9, a crypto expert, Ali, revealed that these whales bought more than 4 million LINK coins, amounting to $24 million in just 10 days.

These accumulations show heightened investor interest in Chainlink and will likely drive demand, thereby increasing the token’s price in the coming days.