Chainlink Price Prediction For September: Buy LINK Now?

Chainlink (LINK) has been a standout in the crypto market recently, registering an 11% increase over the past six days, even as the broader crypto market sentiment remains subdued.

Will Uptober Start Early For Chainlink?

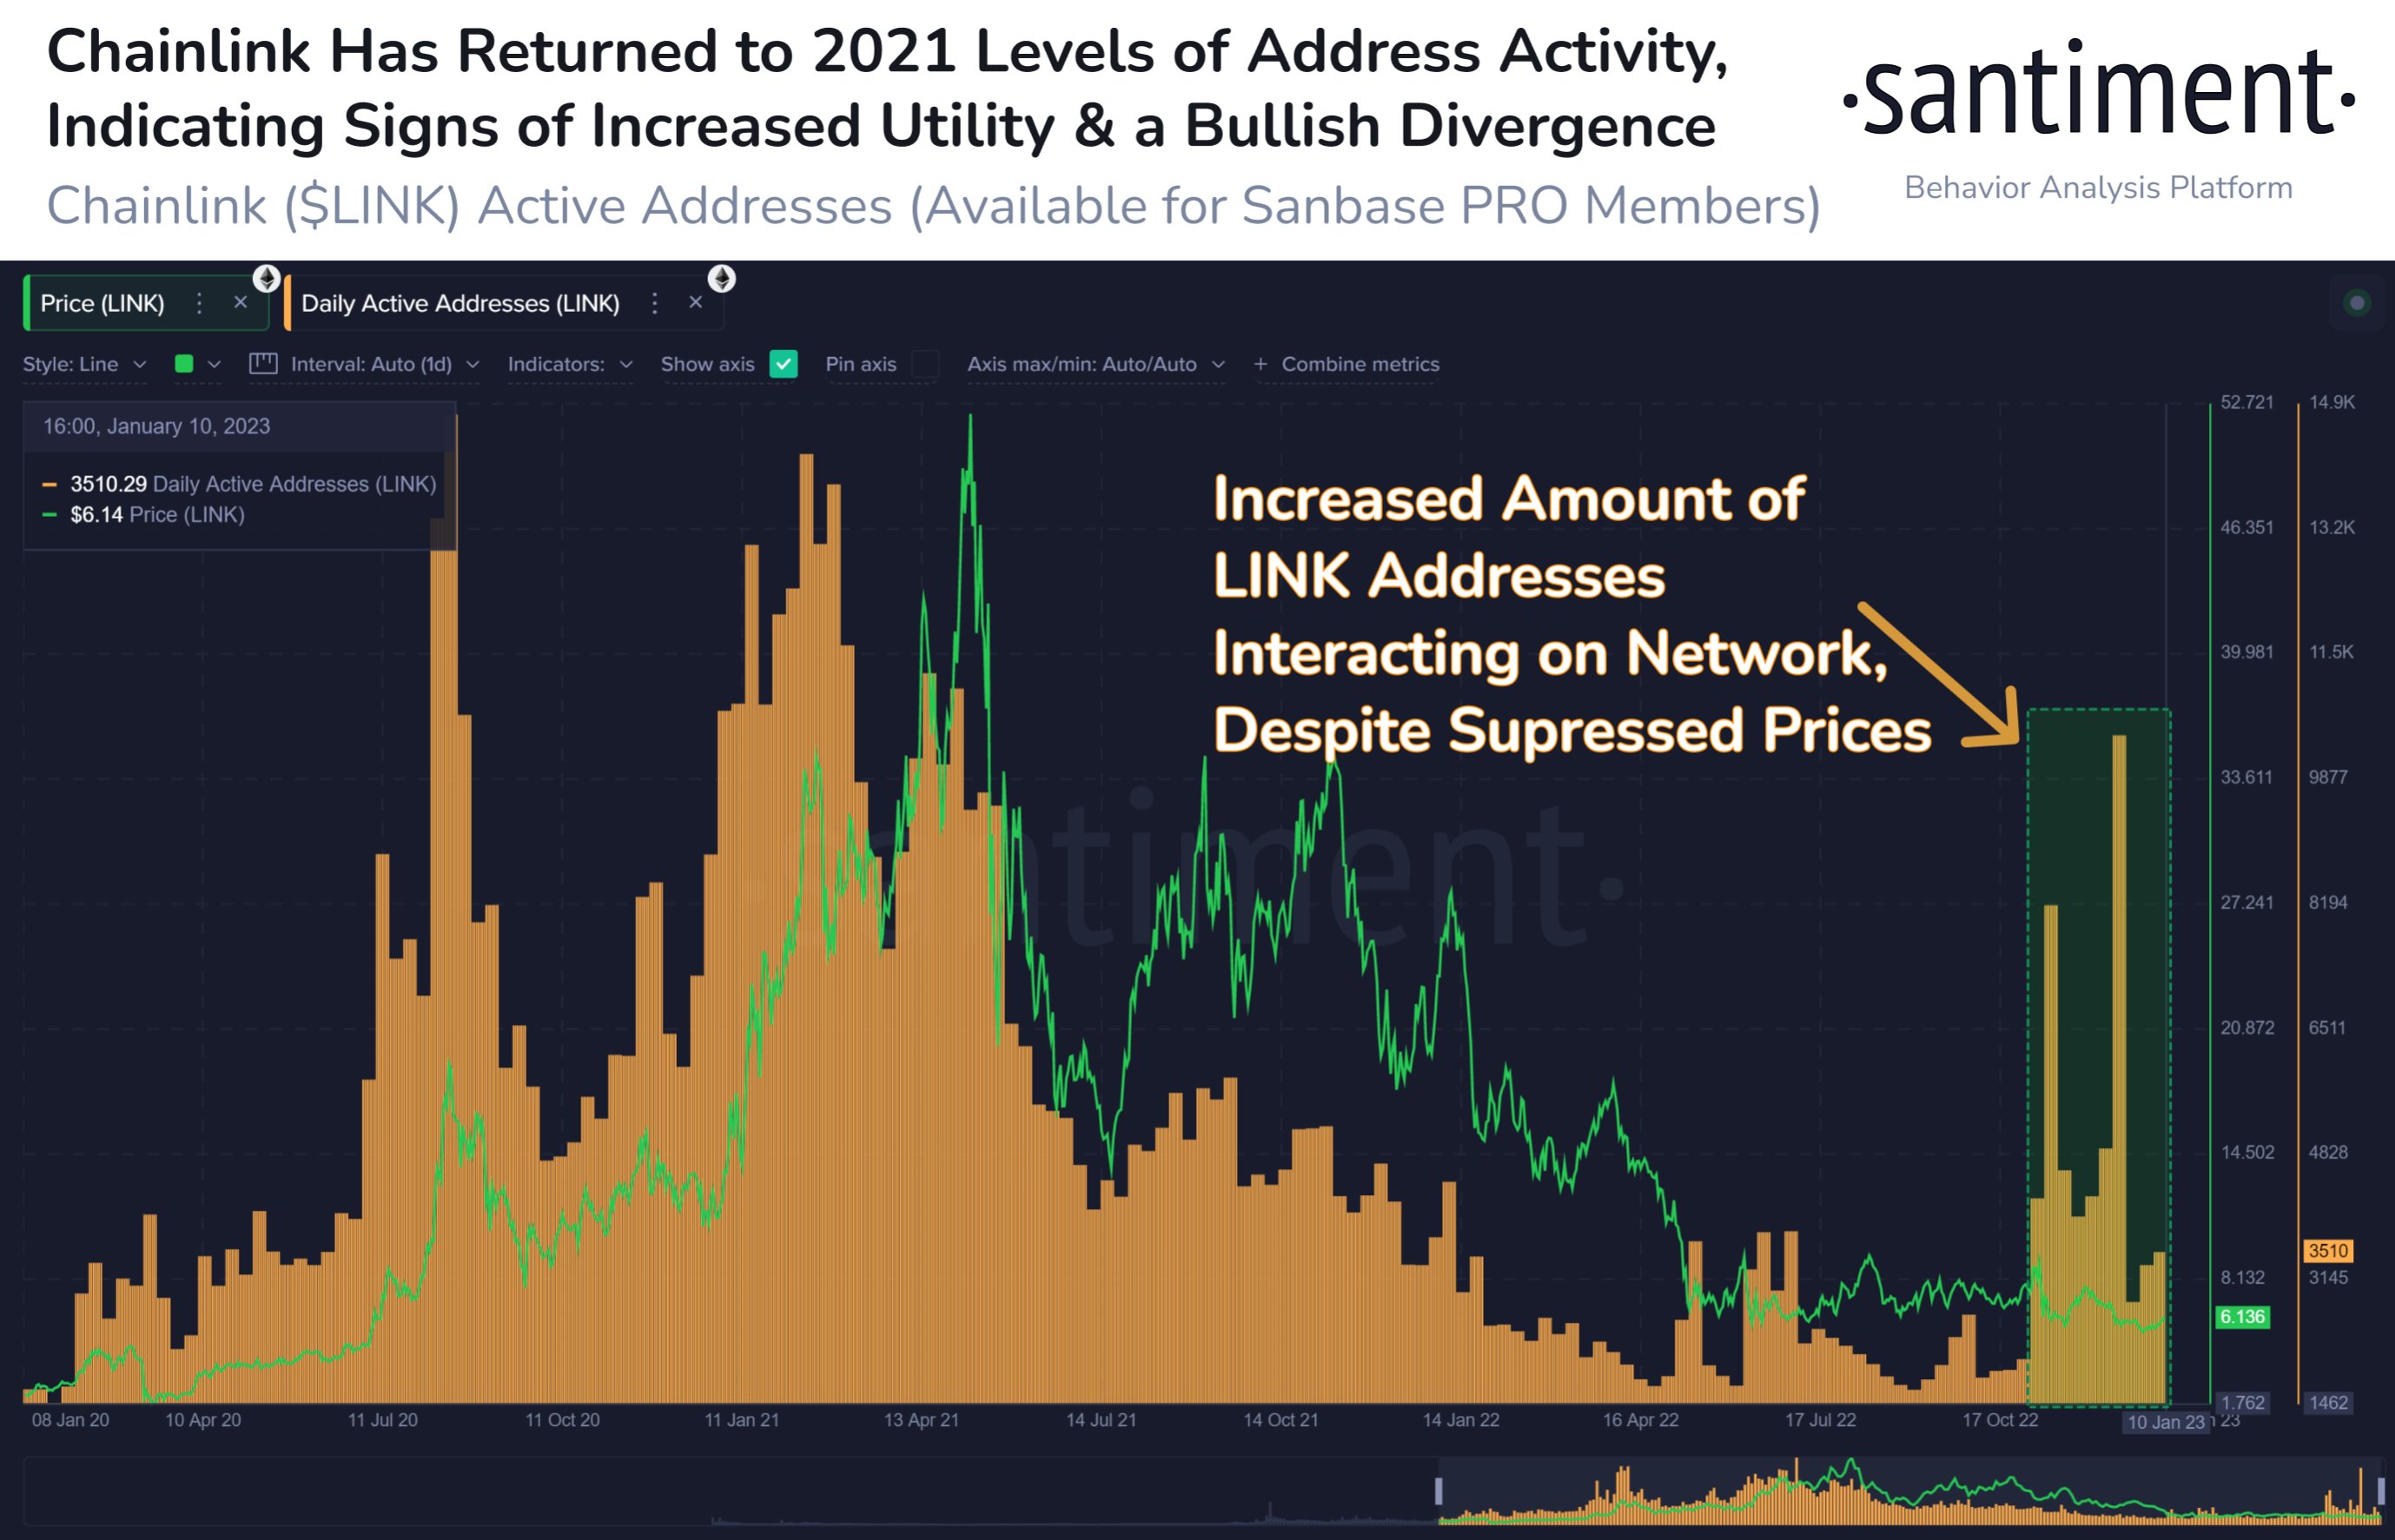
A significant factor that might be driving this price action is the behavior of LINK’s major holders. On-Chain analysis firm, Santiment, highlighted this in a recent tweet, stating: “Chainlink’s key shark tier that holds between 10K-100K LINK has been on an accumulation spree.”

Diving deeper into the data, there are now 3,127 wallets holding between 10,000-100,000 LINK, marking the highest level since December 3, 2022. These wallets have added a staggering $9.6 million worth of LINK in just three days. Since September 3rd, there’s been a 3.2% rise in the number of wallets in this category, with 98 new wallets emerging. This group has accumulated 0.154% of the entire LINK supply in the same period.

However, Chainlink’s journey hasn’t been entirely smooth. The token has been ensnared in a sideways range for an exhausting 485 days, which is over 15 months. The LINK/BTC pair has been on a downward trajectory for more than three years.

Chainlink’s much-anticipated release of the Cross-Chain Interoperability Protocol (CCIP) was met with significant hype. Yet, despite its potential to revolutionize cross-chain communication, its release didn’t provide the expected boost to LINK’s price.

Also the news that a tokenization experiment by interbank messaging system Swift and Chainlink successfully transferred value across multiple blockchains could not move price substantially. In June Chainlink and Swift announced that they would be collaborating with dozens of financial institutions such as BNP Paribas, BNY Mellon, The Depository Trust & Clearing Corporation and Lloyds Banking Group and others.

However, the upcoming Chainlink’s SmartCon in October from October 2nd to 3rd might be the catalyst the token needs. Rumors are rife about a potential major announcement between Swift and Chainlink Labs, which could connect web3 infrastructure to the banks involved in previous tests.

If history is any indication, Chainlink could experience a surge in price leading up to the event, driven by the euphoria and speculation. “Uptober” could come early for the Chainlink price.

LINK Technical Analysis

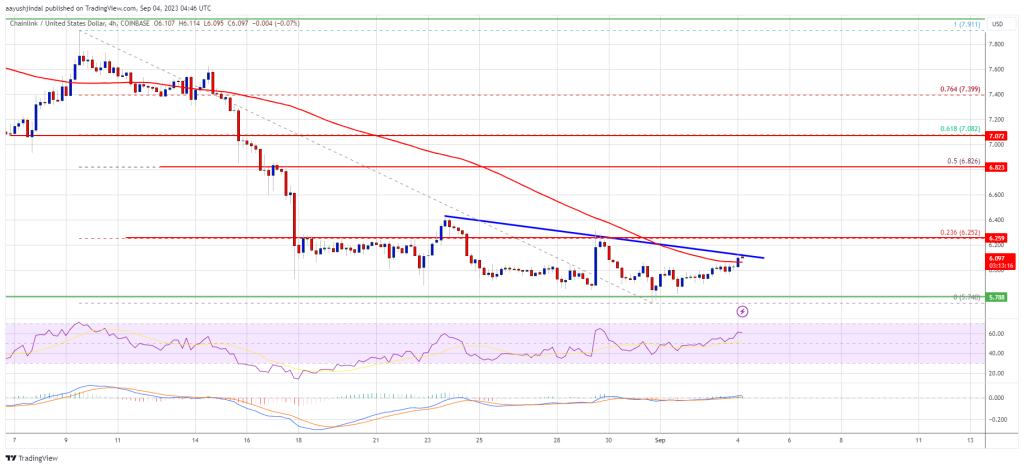
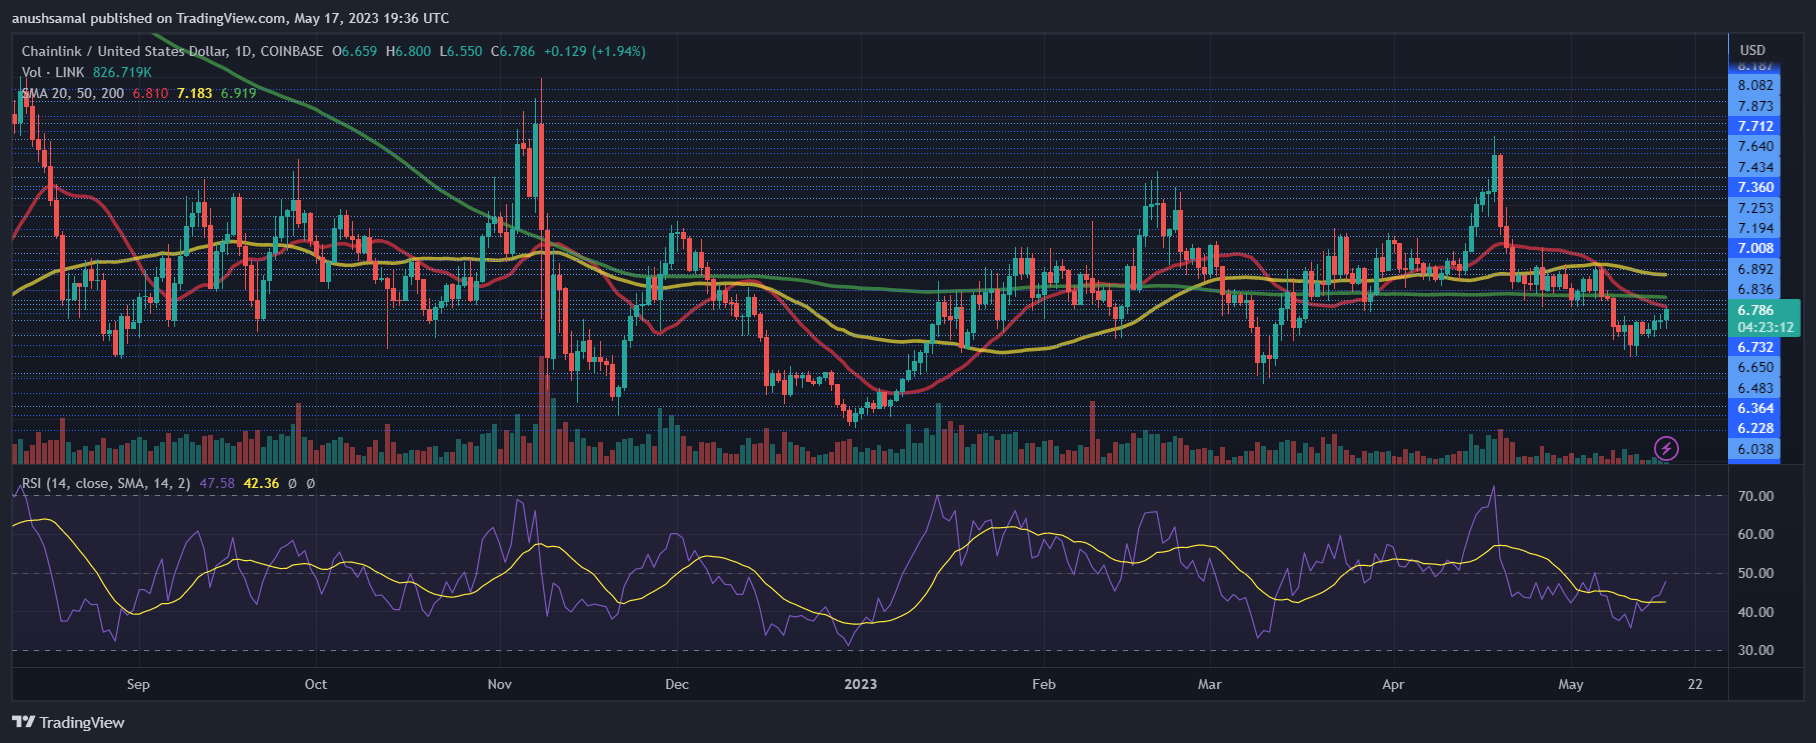
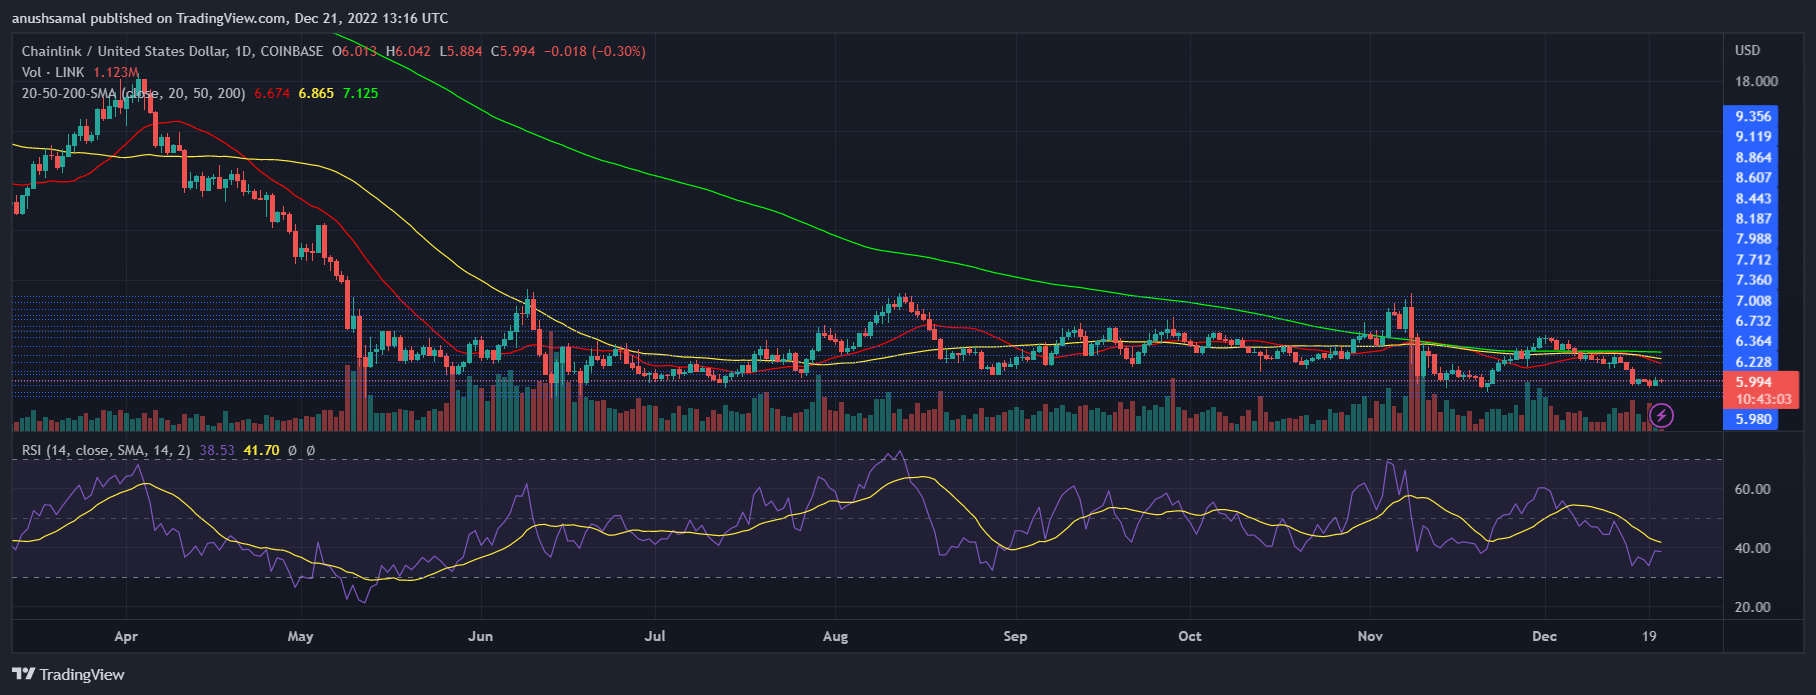
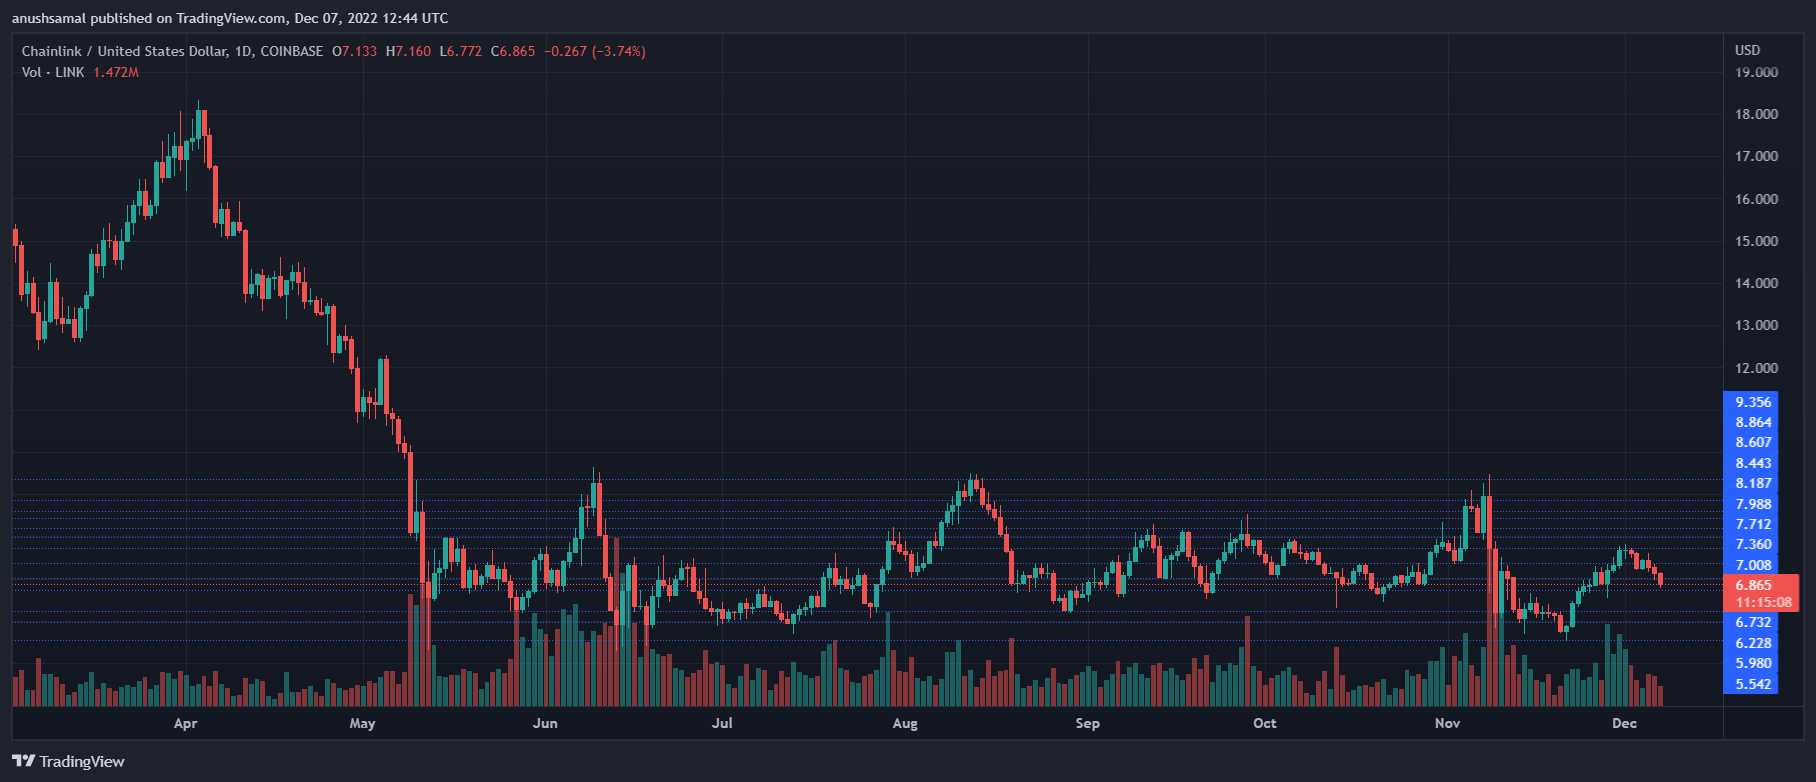
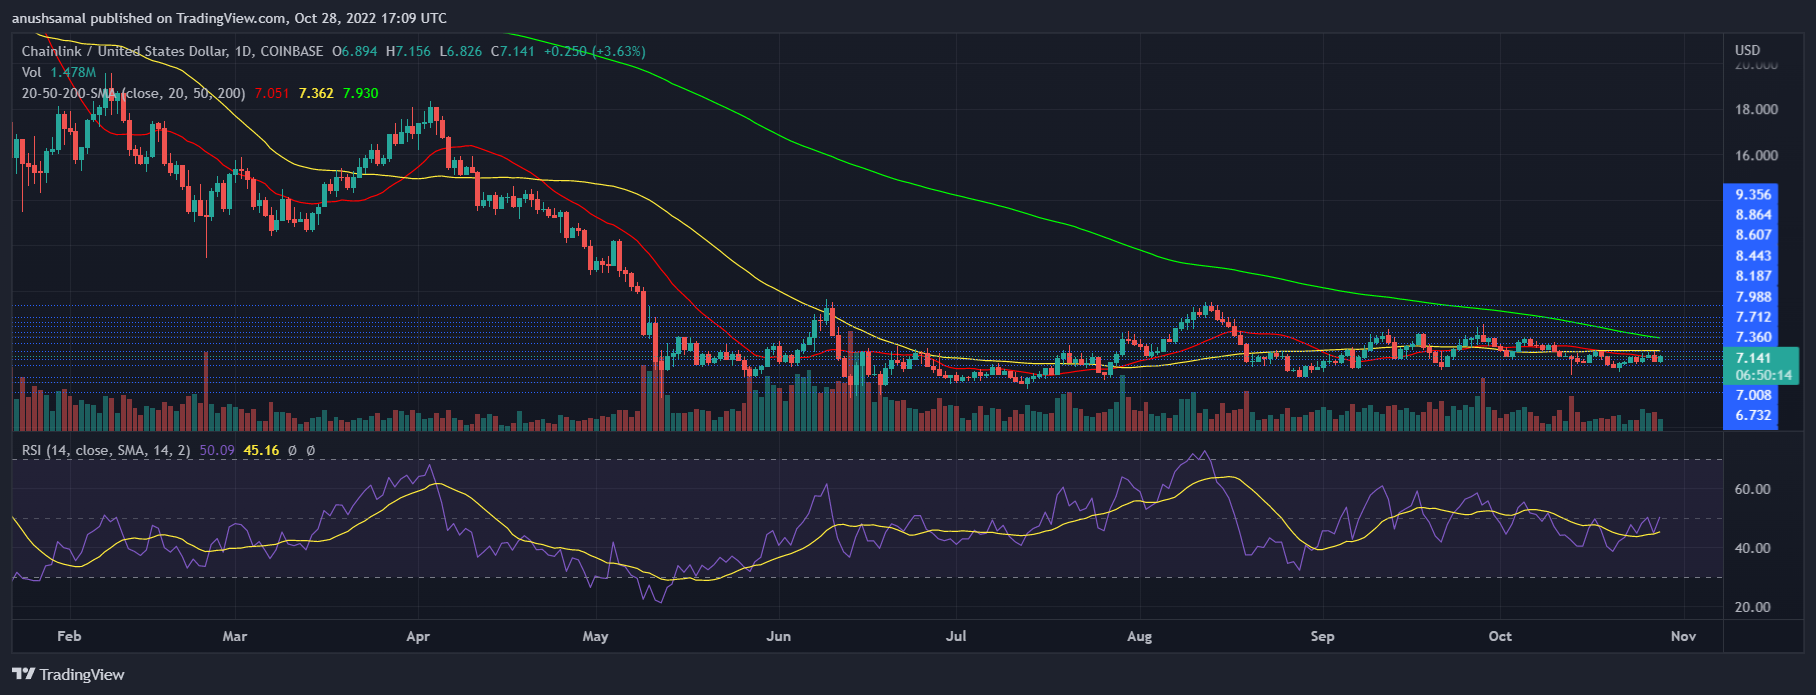
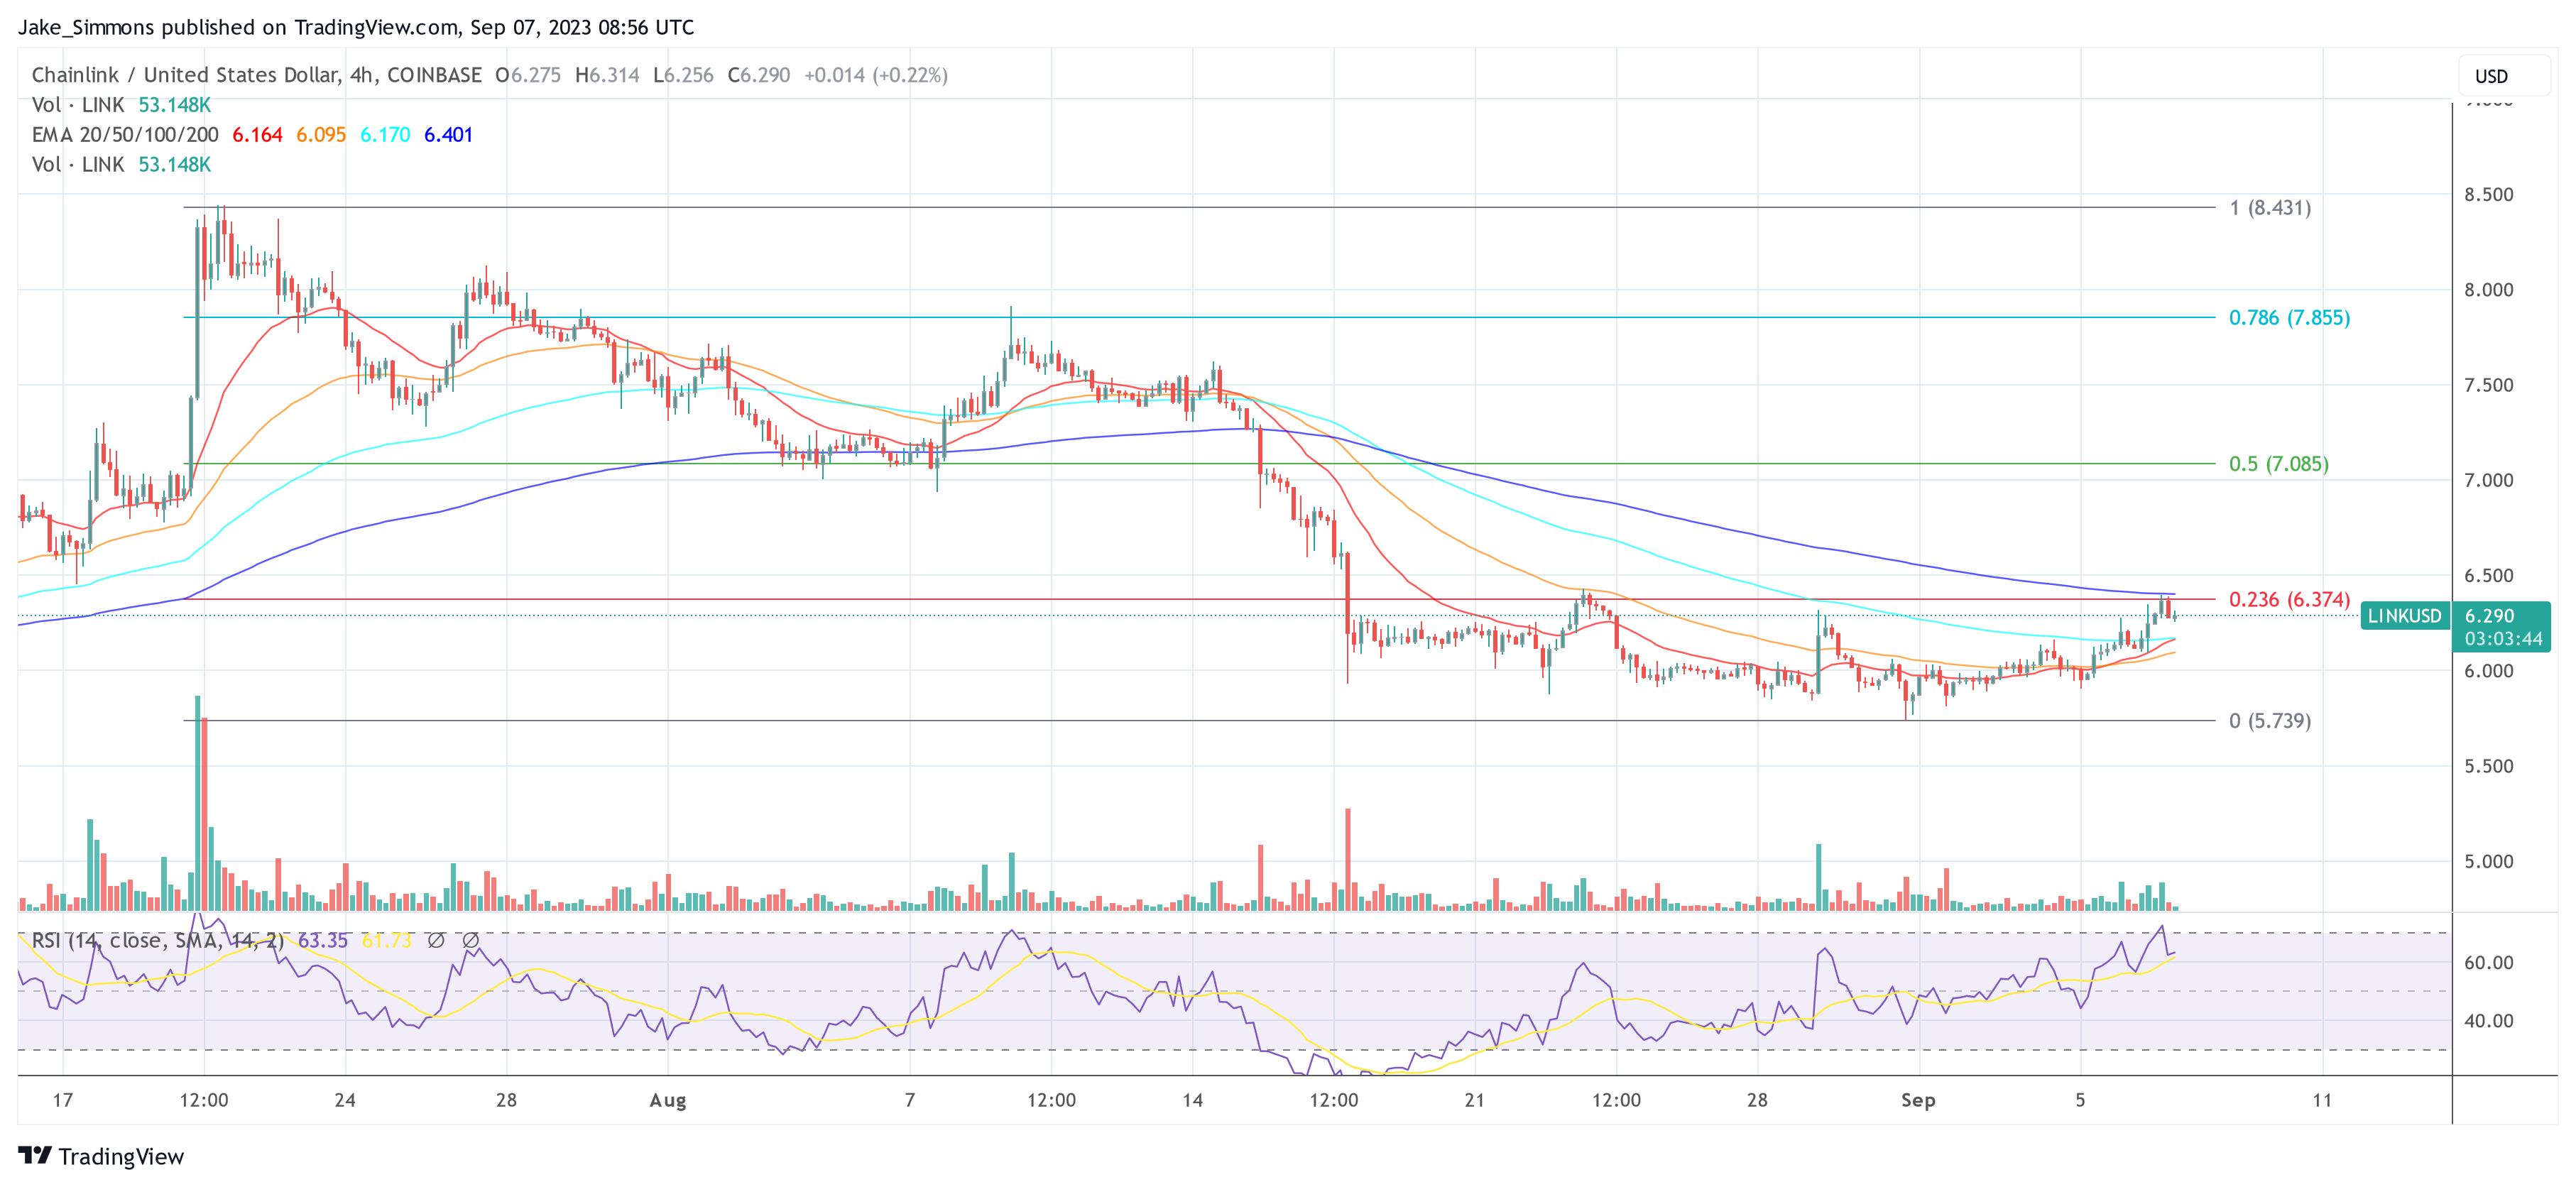
The recent 11% surge in LINK’s price suggests that the market might already be reacting to the upcoming hype. However, the 4-hour chart indicates a rejection at the 23.6% Fibonacci retracement level at $6.37, which aligns closely with the 200 EMA at $6.40. For LINK to sustain its upward trajectory, it’s imperative to breach this level, with the next significant target being the 50% Fibonacci retracement level at $7.08.

Chainlink LINK price

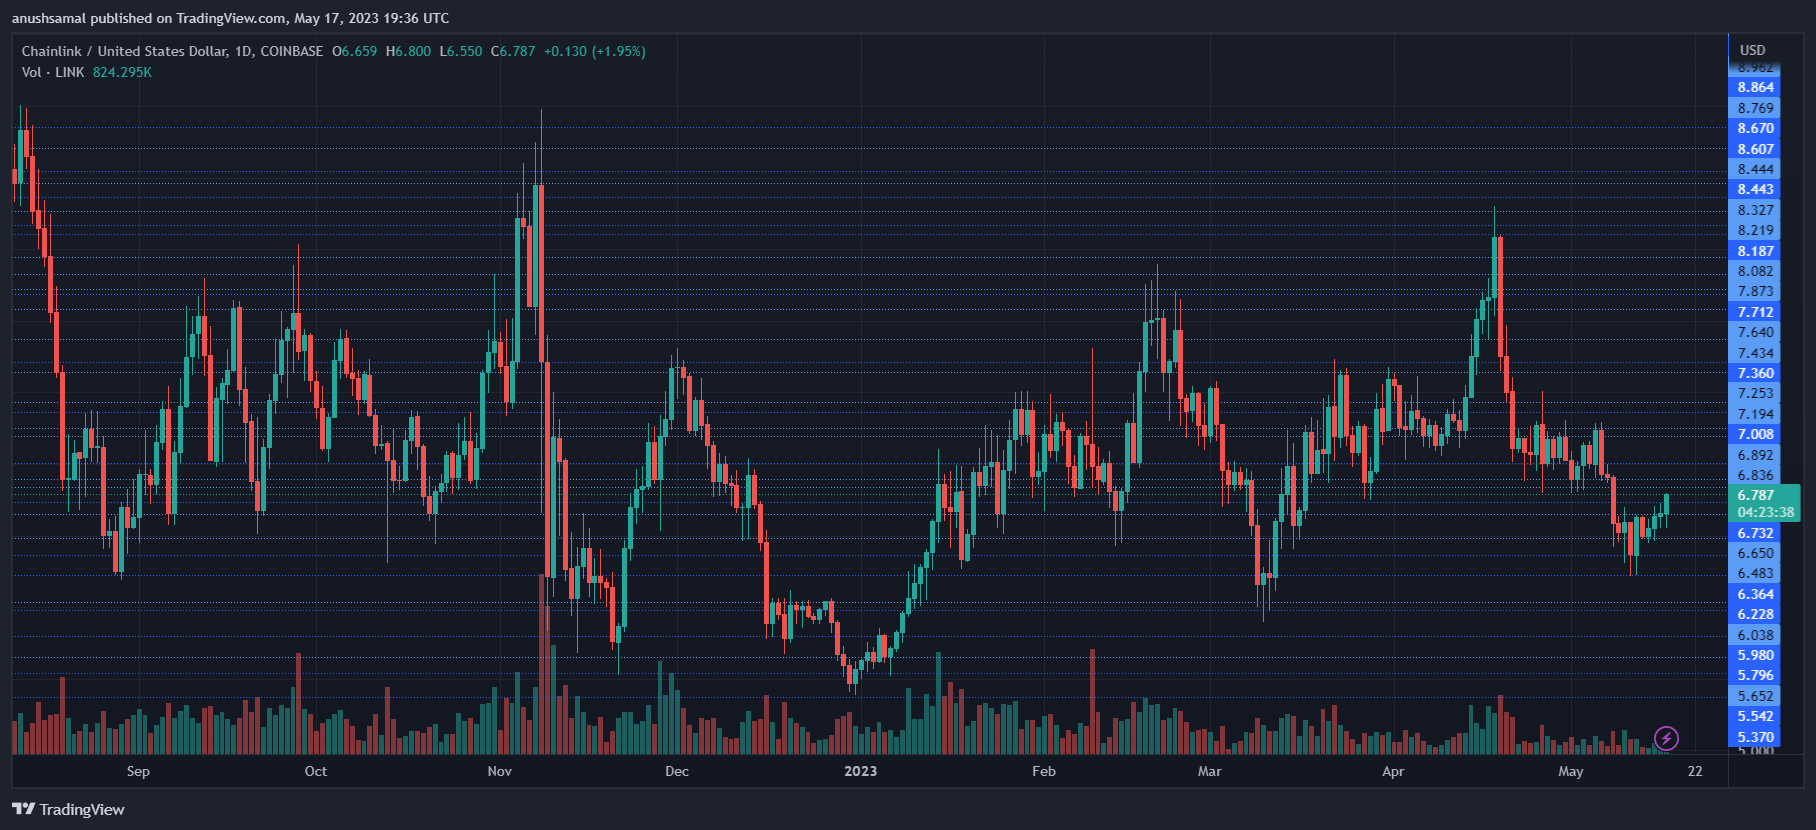
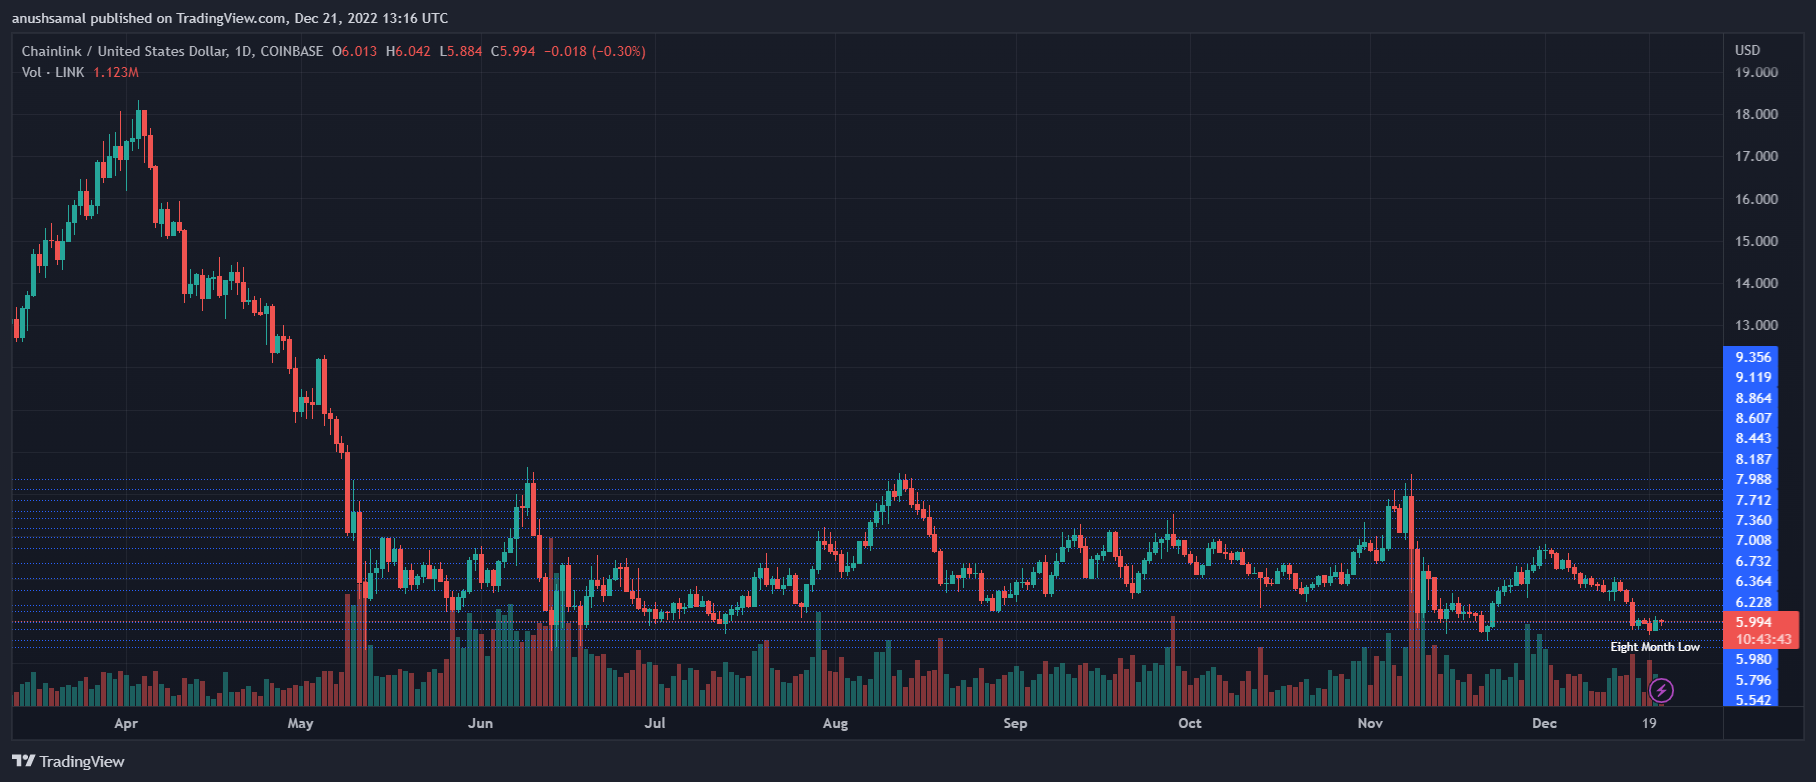
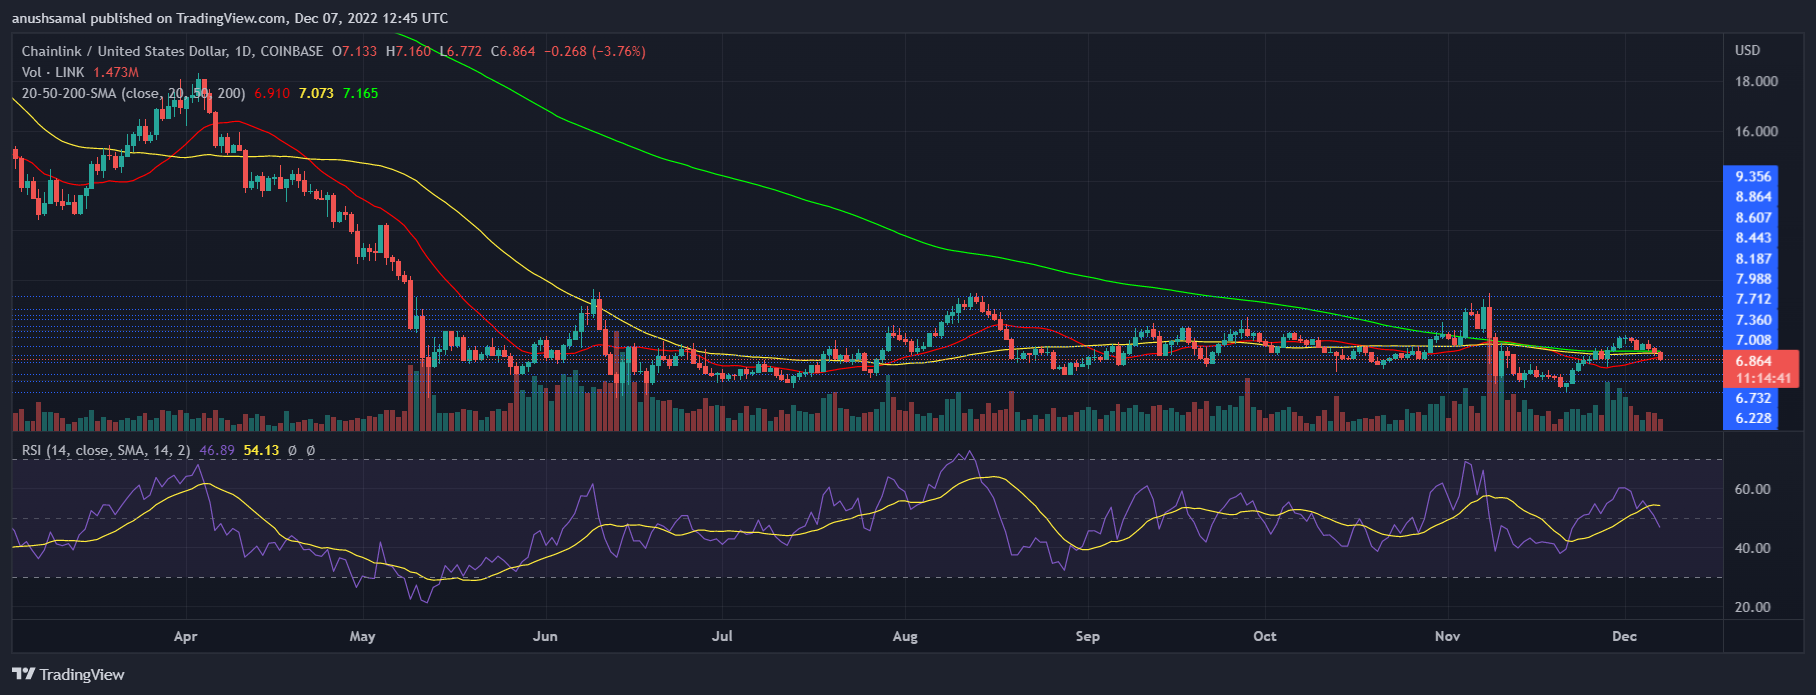
The 1-week chart paints a picture of LINK’s prolonged downtrend. The recent hold above the 23.6% Fibonacci retracement level at $5.92 is a positive sign for the bulls, potentially paving the way for another try on the upper trendline of the downtrend channel.

Chainlink LINK price

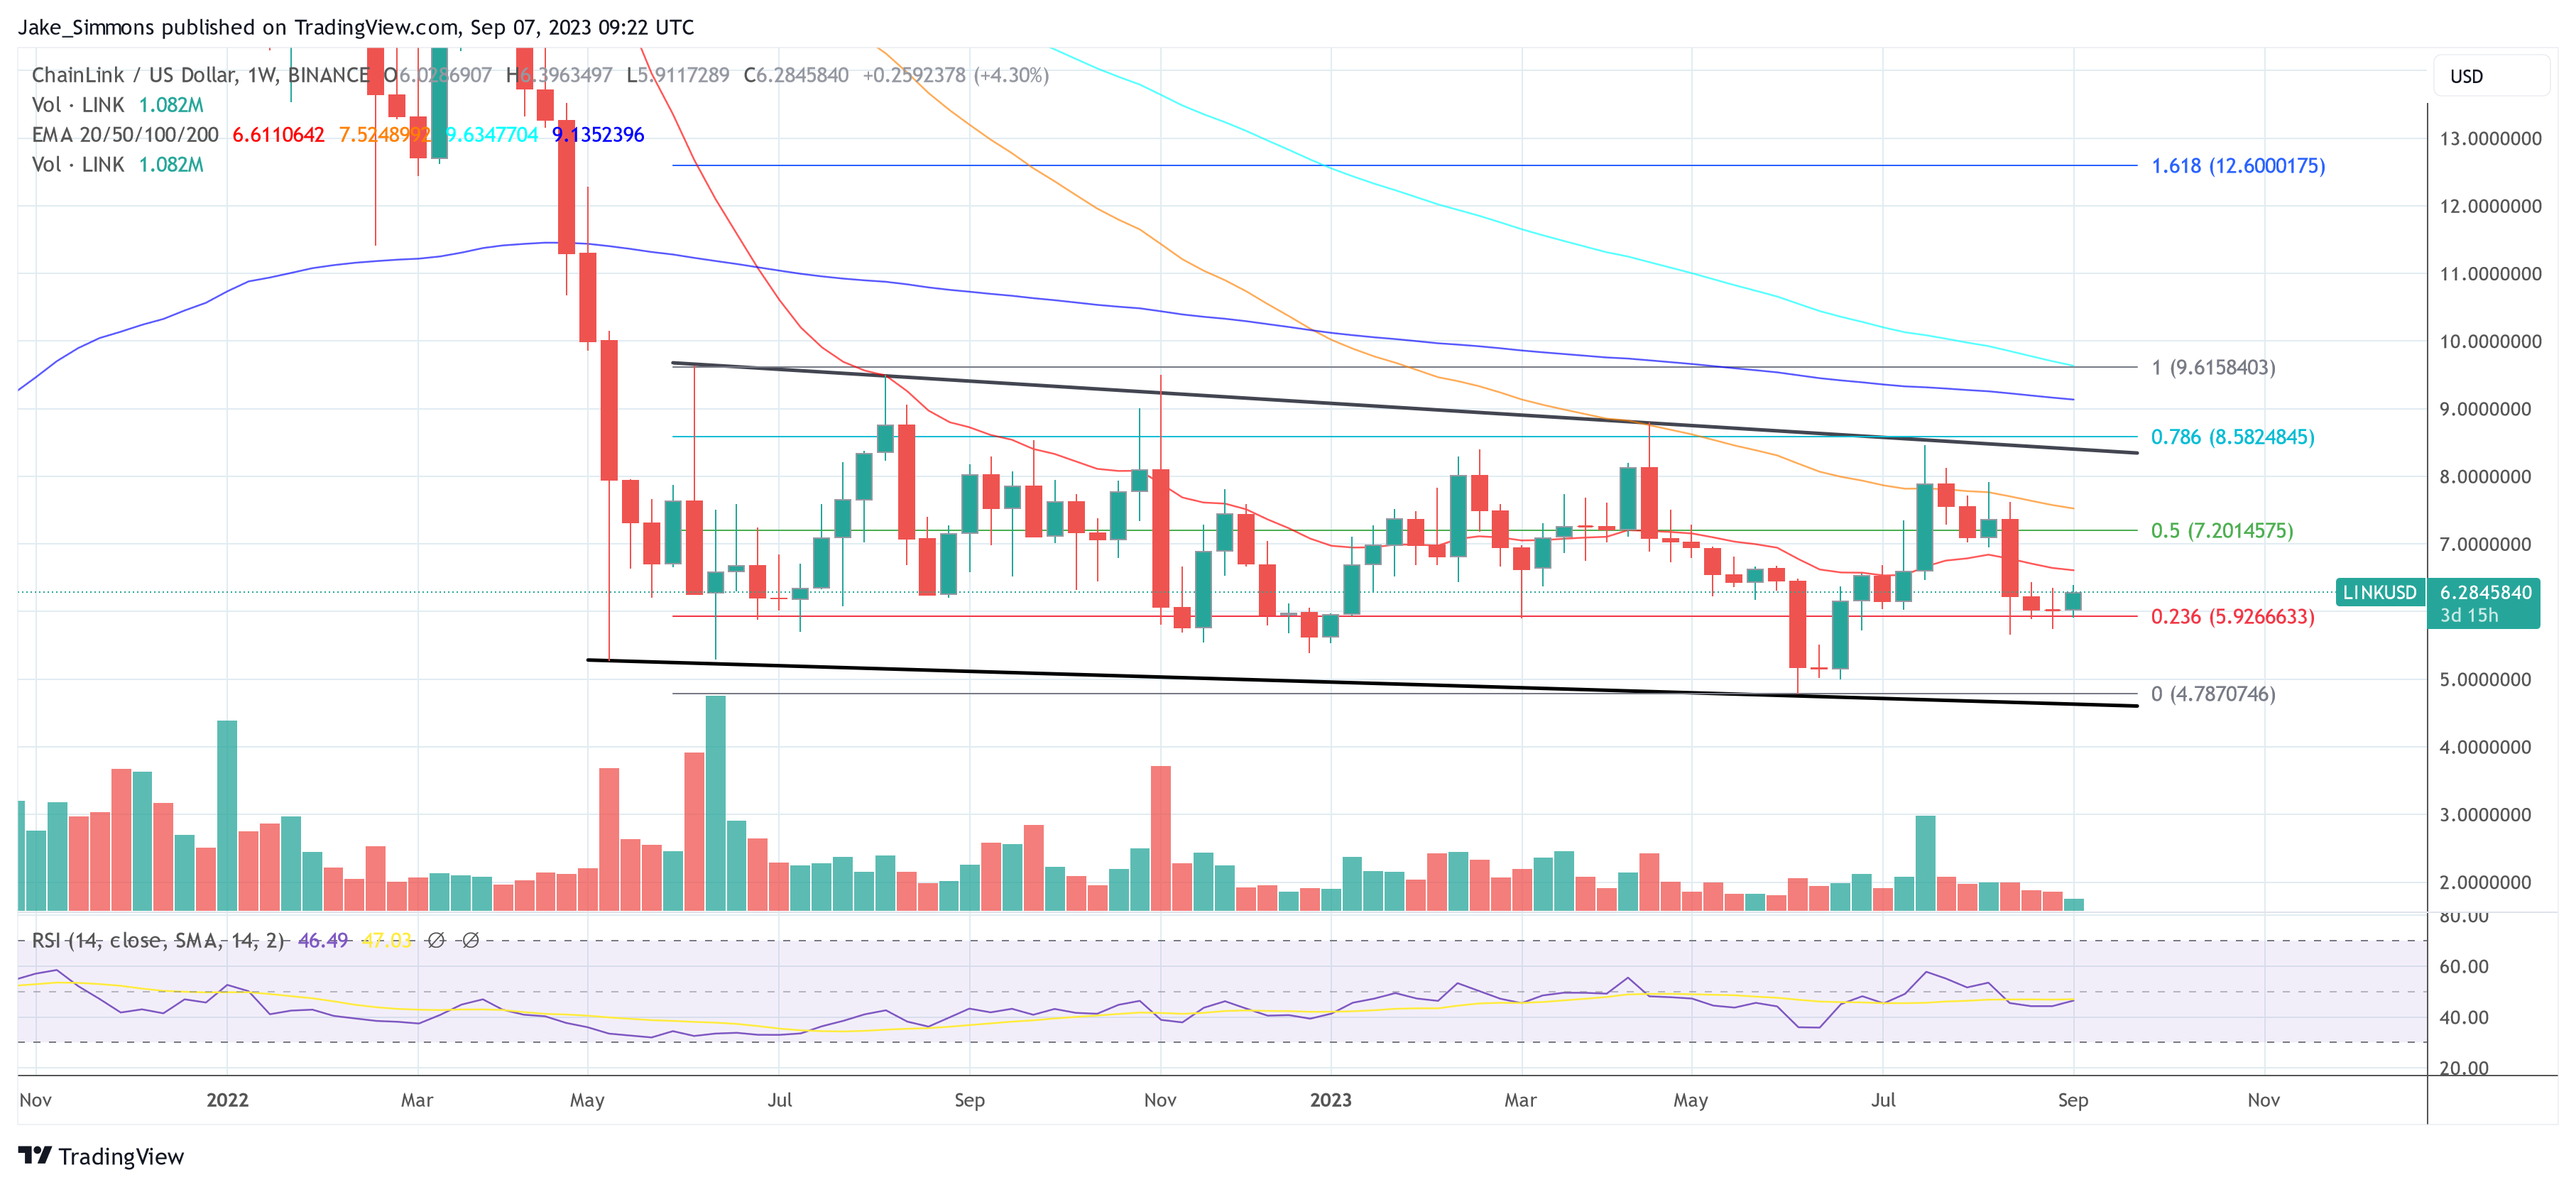
However, several difficult challenges lie ahead. The 50% Fibonacci retracement level at $7.20 is the first major resistance. If LINK can push past this, a breakout from the 15-month downtrend channel becomes possible. For this to happen, Chainlink would need to break above the $8.30-$8.40 area as it currently stands, and would then encounter the 78.6% Fibonacci retracement level at $8.58. Large selling pressure can be expected at this point.

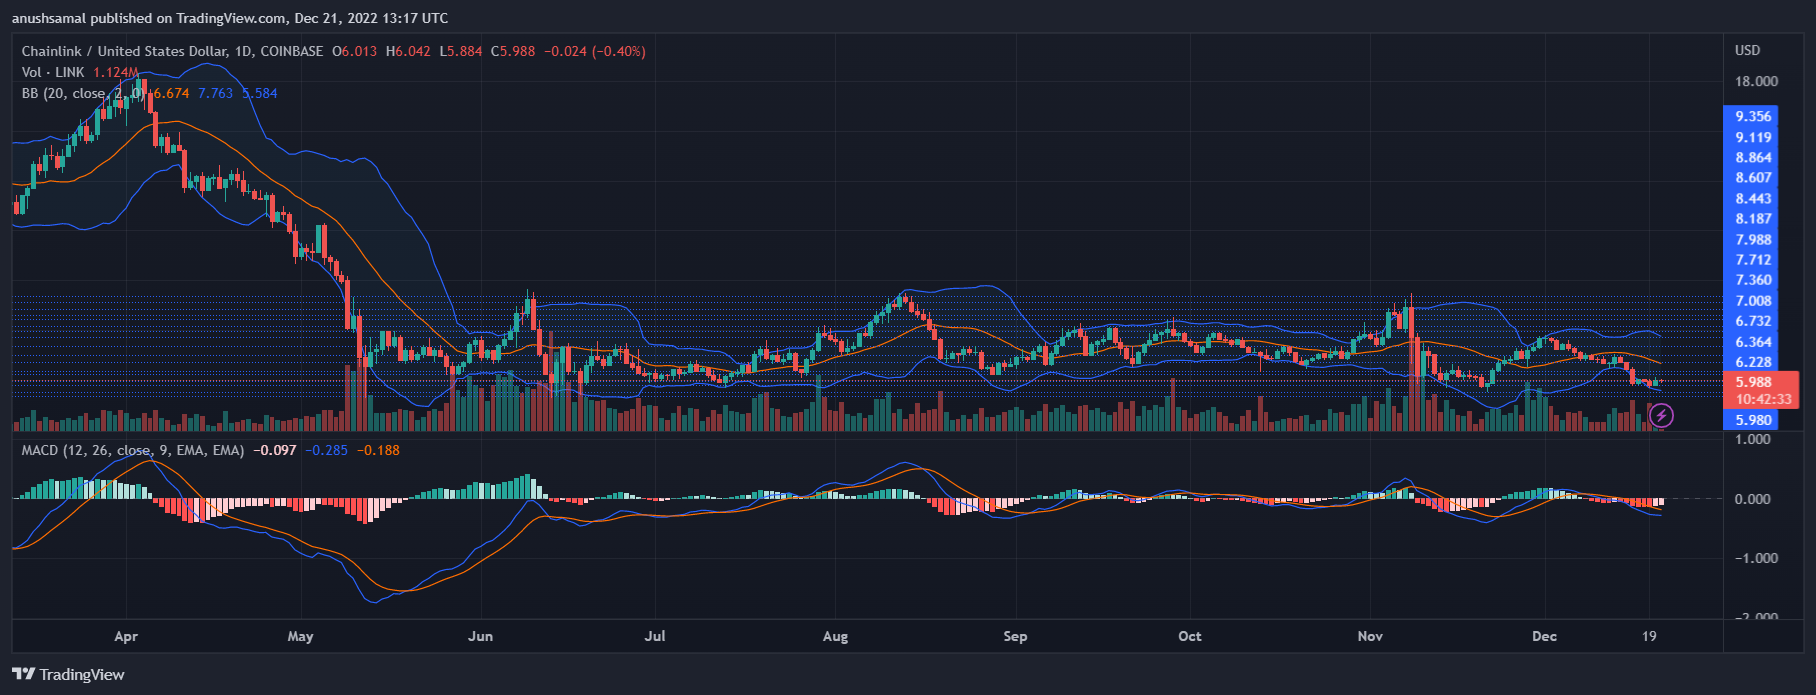
Should LINK falter at this juncture, a return to the downtrend channel is likely. Conversely, if the $8.58 mark is surpassed, it would signal a significant win for the bulls, potentially setting LINK on a path to challenge its 15-month high at $9.61.

LINK Price Prediction: Chainlink Needs To Clear $6.25 For Hopes of a Fresh Rally

Chainlink’s LINK price is holding the $5.75 support zone. The price could start a fresh increase if it clears the $6.25 resistance zone.

  • Chainlink token price is showing positive signs above $6.0 against the US dollar.
  • The price is trading above the $6.05 level and the 100 simple moving average (4 hours).
  • There is a key bearish trend line forming with resistance near $6.10 on the 4-hour chart of the LINK/USD pair (data source from Kraken).
  • The price could gain bullish momentum above the $6.25 resistance zone.

Chainlink (LINK) Price Eyes Fresh Recovery

After a major decline, LINK price found support near the $5.75 zone against the US Dollar. A low was formed near $5.74 and the price is now attempting a recovery wave, like Bitcoin and Ethereum.

There was a decent move above the $5.85 and $6.00 levels. LINK is now trading above the $6.05 level and the 100 simple moving average (4 hours). However, there are many hurdles on the upside starting with $6.10. Besides, there is a key bearish trend line forming with resistance near $6.10 on the 4-hour chart of the LINK/USD pair.

The current price action suggests that the price is struggling near the trend line and $6.10. The first major resistance is near the $6.25 zone. It is close to the 23.6% Fib retracement level of the downward move from the $7.91 swing high to the $5.74 low.

LINK Price Prediction

Source: LINKUSD on TradingView.com

A clear break above $6.25 may possibly start a fresh increase toward the $6.65 and $6.80 levels. The next major resistance is near the $7.10 level, above which the price could revisit $7.50.

Another Decline Losses?

If Chainlink’s price fails to climb above the $6.25 resistance level, there could be a downside extension. Initial support on the downside is near the $6.00 level.

The next major support is near the $5.75 level, below which the price might test the $5.60 level. Any more losses could lead the price toward the $5.35 level in the near term.

Technical Indicators

4 hours MACD – The MACD for LINK/USD is losing momentum in the bearish zone.

4 hours RSI (Relative Strength Index) – The RSI for LINK/USD is now above the 50 level.

Major Support Levels – $6.00 and $5.75.

Major Resistance Levels – $6.25 and $6.80.

LINK Price Prediction: Chainlink Hints At Potential Rally To $8

Chainlink’s LINK price is holding the $7.30 support zone. The price could start a fresh increase if it clears the $7.50 resistance zone.

  • Chainlink token price is showing positive signs above $7.30 against the US dollar.
  • The price is trading above the $7.40 level and the 100 simple moving average (4 hours).
  • There is a key declining channel forming with resistance near $7.50 on the 4-hour chart of the LINK/USD pair (data source from Kraken).
  • The price could gain bullish momentum above the $7.50 resistance zone.

Chainlink (LINK) Price Eyes Fresh Increase

After a strong increase, LINK price faced sellers near the $7.90 zone against the US Dollar. A high was formed near $7.91 and the price started a downside correction, unlike Bitcoin and Ethereum.

There was a move below the $7.60 and $7.50 levels. The price declined below the 50% Fib retracement level of the upward move from the $6.932 swing low to the $7.915 high. The price also spiked below the $7.40 level. However, the bulls are active near the $7.30 support.

LINK is trading above the 61.8% Fib retracement level of the upward move from the $6.932 swing low to the $7.915 high. It is also above the $7.40 level and the 100 simple moving average (4 hours).

LINK Price Prediction

Source: LINKUSD on TradingView.com

It is now facing resistance near the $7.50 level. There is also a key declining channel forming with resistance near $7.50 on the 4-hour chart of the LINK/USD pair. The first major resistance is near the $7.685 zone. A clear break above $7.685 may possibly start a fresh increase toward the $7.90 and $8.00 levels. The next major resistance is near the $8.20 level, above which the price could revisit $8.50.

More Losses?

If Chainlink’s price fails to climb above the $7.50 resistance level, there could be a downside extension. Initial support on the downside is near the $7.30 level.

The next major support is near the $7.15 level, below which the price might test the $7.00 level. Any more losses could lead the price toward the $6.85 level in the near term.

Technical Indicators

4 hours MACD – The MACD for LINK/USD is losing momentum in the bearish zone.

4 hours RSI (Relative Strength Index) – The RSI for LINK/USD is now near the 50 level.

Major Support Levels – $7.30 and $7.15.

Major Resistance Levels – $7.50 and $7.685.

LINK Price Prediction: Chainlink Turns Attractive On Dips

Chainlink’s LINK price is showing positive signs pace above $7.20. The price could rise further if it stays above the $7.30 support zone.

  • Chainlink token price is showing positive signs and rising from $7.00 against the US dollar.
  • The price is trading above the $7.30 level and the 100 simple moving average (4 hours).
  • There was a break above a major bearish trend line with resistance near $7.35 on the 4-hour chart of the LINK/USD pair (data source from Kraken).
  • The price could gain bullish momentum above the $7.35 resistance zone.

Chainlink (LINK) Price Eyes More Gains

After a short-term downside correction, LINK price found support near the $6.95 level against the US Dollar. A low was formed near $6.933 and the price started a fresh increase, unlike Bitcoin and Ethereum.

There was a clear move above the $7.10 and $7.20 resistance levels. Besides, there was a break above a major bearish trend line with resistance near $7.35 on the 4-hour chart of the LINK/USD pair. Finally, the pair traded close to the $8.00 zone.

A high is formed near $7.914 and the price is now correcting gains. There was a move below the 23.6% Fib retracement level of the upward move from the $6.933 swing low to the $7.914 high.

LINK Price Prediction

Source: LINKUSD on TradingView.com

LINK price is now trading above the $7.30 level and the 100 simple moving average (4 hours). It is now facing resistance near the $7.80 level. The first major resistance is near the $7.95 zone. A clear break above $7.95 may possibly start a fresh increase toward the $8.20 and $8.255 levels. The next major resistance is near the $8.50 level, above which the price could revisit $8.80.

Dips Supported?

If Chainlink’s price fails to climb above the $7.95 resistance level, there could be a downside correction. Initial support on the downside is near the $7.50 level and the 100 simple moving average (4 hours).

The next major support is near the $7.30 level and 61.8% Fib retracement level of the upward move from the $6.933 swing low to the $7.914 high, below which the price might test the $7.10 level. Any more losses could lead the price toward the $7.00 level in the near term.

Technical Indicators

4 hours MACD – The MACD for LINK/USD is losing momentum in the bullish zone.

4 hours RSI (Relative Strength Index) – The RSI for LINK/USD is now above the 50 level.

Major Support Levels – $7.50 and $7.30.

Major Resistance Levels – $7.80 and $7.95.

Chainlink Price Consolidation Persists: Will Bulls Front A Recovery Soon?

The Chainlink price has been trading within a narrow range recently, leading to decreased investor interest. However, in the past 24 hours, the altcoin managed to experience a 1.5% increase, indicating sideways movement.

On the weekly chart, LINK showed a 4% upward movement. Despite these gains, the technical analysis indicates that the bears still control the price action. Both demand and accumulation levels remain low, although there has been a slight increase in buying activity on the daily chart. Nonetheless, sellers still dominate the market.

The decline in Bitcoin’s price below $27,000 has caused uncertainty among altcoins, preventing them from making decisive moves on their respective charts. Following a period of consolidation, a price breakout is possible.

While the technical outlook suggests bearish strength, there are also signals of a potential reversal. However, for LINK to initiate a price recovery, it will depend on broader market strength, as indicated by the decline in the LINK market capitalization, reflecting weak buying power.

Chainlink Price Analysis: One-Day

Chainlink

At the time of writing, the price of LINK was $6.78, as it attempted to break its sideways trading pattern while remaining below its resistance level of $6.90. A successful breakthrough above $6.90 could potentially trigger a rally toward $7.20.

Conversely, if the price falls from its current level, it may decline to $6.30. A breach of the $6.30 support line could push the price below $6.

On the other hand, as long as LINK remains above the local support line at $6.60, it has the potential to continue its recovery on the chart. The volume of Chainlink traded in the previous session was positive, indicating buyers were starting to reemerge in the market.

Technical Analysis

Chainlink

Following sustained selling pressure, LINK is now trying to attract buyers back into the market. The Relative Strength Index (RSI) has been trending upward, nearing the halfway point. However, at the present moment, sellers still outnumber buyers.

Additionally, LINK is attempting to trade above the 20-Simple Moving Average (SMA) line, indicating a renewed demand in the market. Despite the coin’s recovery attempts, sellers still drive the overall price momentum.

Chainlink

A buy signal emerged as the price and buying strength of LINK aimed for recovery. The Moving Average Convergence Divergence (MACD), a tool that reflects price momentum and potential trend reversals, formed a green signal bar aligned with a buy signal.

This indicated a potential for positive price movement. Additionally, the Bollinger Bands were wide and parallel, suggesting that the coin would likely attempt a breakout from its previous consolidated price action.

Chainlink Pushes Above $7, Will The Short-Term Recovery Hold?

The price of Chainlink had been in a period of consolidation over the past few sessions. However, the bulls were recently able to break above an important resistance level. Despite this recent bullish action, the daily chart showed a 6% depreciation and on the weekly chart, LINK had a 9% loss.

The technical outlook looked bleak with fading demand and low accumulation. Nevertheless, if LINK can remain above the $7 mark, another rebound may be possible. As Bitcoin displayed mild bullish sentiment after reclaiming the $28,000 mark, most altcoins exhibited similar behaviors.

If BTC retraces in the next trading sessions, LINK is expected to move closer to its immediate support level. Maintaining buying strength is crucial for the asset to stay above its local price floor. The market capitalization of LINK had fallen, indicating that sellers were more active.

Chainlink Price Analysis: One-Day Chart

Chainlink

At the time of writing, Chainlink was trading at $7.02, with its immediate resistance at $7.40. If the altcoin manages to surpass this resistance, it will encounter a tough price ceiling of $7.70, and reaching that level may revive the bulls.

Conversely, failing to stay above the $7 mark will pull Chainlink down to $6.80. If this happens, LINK may decline by up to 15%, nearing the $5.80 mark. The last session saw a decrease in the amount of LINK traded, and indicators suggested that buying strength was weakening.

Technical Analysis

Chainlink

Chainlink had experienced a sharp drop in buyers’ interest after encountering significant resistance at $7.70. However, demand for the altcoin could partially return if it moves above the $7.00 price mark. The Relative Strength Index was below the half-line, hovering around 40, indicating that sellers had taken control of the market.

Additionally, LINK had fallen below the 20-Simple Moving Average line, signaling that sellers were driving the price momentum at press time. If demand picks up, LINK could rise above the 50-SMA line (yellow), providing some relief to the bulls.

Chainlink

In line with the other technical indicators, LINK displayed sell signals, indicating a bearish turn in price. The Moving Average Convergence Divergence (MACD) demonstrates an asset’s price momentum and trend reversals as well. The MACD formed red histograms below the half-line, signaling a sell signal for the asset.

The Parabolic SAR reads the price direction and changes in the same. The indicator formed dotted lines above the price candlesticks, suggesting a downtrend in the price.

For LINK to maintain its price above the $7 mark, buying strength needs to resurface over the immediate trading sessions, and broader market strength has to remain consistent.

Chainlink Bullish Signal: LINK Address Activity Returns To 2021 Levels

Data shows Chainlink address activity has returned to 2021 levels recently, a sign that could turn out to be bullish for the asset’s value.

Chainlink Daily Active Addresses At High Levels Recently

According to data from the on-chain analytics firm Santiment, this increase in LINK activity first started around two months ago. The relevant indicator here is the “daily active addresses,” which tells us the total number of addresses that were involved in a transaction on any given day.

The metric counts both senders and receivers in its calculation, and only accounts for unique addresses in the data, meaning that the wallets that participated in multiple transfers on the same day are only counted once. This helps remove duplicate transactions and other noise from the data, and provides a more accurate picture of the network activity.

When the value of this indicator is high, it means a large number of daily users are interacting in some way on the blockchain right now. Such a trend shows the market is active currently.

On the other hand, low values of the metric imply not many unique users are showing trading activity at the moment. This kind of trend can be a sign that the general interest around the crypto is low at the moment.

Now, here is a chart that shows the trend in the Chainlink daily active addresses over the last few years:

Chainlink Address Activity

As shown in the above graph, the Chainlink daily active addresses were at pretty low levels for most of 2022. This was because the investors weren’t finding the coin that interesting to trade during the bear market consolidation.

In the last couple of months or so, however, there has been a very noticeable rise in the unique users transacting on the network daily. In fact, these values of the indicator are similar to those seen during 2021, when the bull run was going on.

Usually, high network activity is bullish for the price in the long term as increased utility of the chain builds a more sustainable ground for the future. LINK has been rallying in the last week or so, which may suggest that this high activity from holders in the last two months may already be paying off for the crypto.

Also, while a high number of users are important for starting price moves like this, it’s also true that they are needed during such rallies to keep them going. If the Chainlink daily active addresses continue to be at the current high levels, then it may mean the current rally can keep up the momentum for a while longer.

LINK Price

At the time of writing, Chainlink is trading around $6.3, up 13% in the last week.

Chainlink Price Chart

Chainlink Turns Bearish As Price Dips To 8-Month Low

The Chainlink price has dropped to an eight-month low as the coin fell from the $6.30 price level. Since the Chainlink price has touched a multi-monthly low, the chances of the price turning around remain extremely likely. As Bitcoin slipped on its chart too, most altcoins have been depreciating on their respective charts as well.

The technical outlook of the coin was bearish as accumulation decreased due to an increase in liquidation. Broader market support is necessary for LINK to propel its price to a higher level. For instance, Bitcoin has been stuck between the $17,400 and the $18,000 price levels.

If BTC trades above the $17,400 level, multiple altcoins can potentially rally. Although the overall trend of the Chainlink price does not clearly indicate a breakout on the upside, the coin currently trades near a level that has previously triggered several rallies for the coin. Chainlink’s trading volume has decreased, indicating that bears have taken control of the market.

Chainlink Price Analysis: One-Day Chart

Chainlink Price

LINK was trading at $5.99 at the time of writing. Ever since Chainlink fell from the $6.30 price level, the altcoin has broken below multiple support lines. Presently, the altcoin has secured the $5.70 support line as its local price floor.

If demand for the altcoin registers a considerable increase, then the first barrier for LINK stood at $6.30, which marks a 40% rally in the price of the asset alone.

Moving above the $6.30 mark can push LINK into the $7 zone. On the other hand, losing the $5.70 support line will drag Chainlink to $5.40. The amount of LINK traded in the last session declined, indicating sellers were dominant in the market.

Technical Analysis

Chainlink Price

The altcoin has registered a significant fall in demand ever since the beginning of this month. The Relative Strength Index (RSI) also noted a multi-month low at the time of writing. The RSI was below the 40-mark and it registered a downtick; this could mean a further fall in price before LINK makes a comeback.

Related Reading: Breaking: One Of The Largest P2P Crypto Exchanges Removes Ethereum Due To ‘Integrity’

The Chainlink price also travelled below the 20-Simple Moving Average (SMA), representing that the sellers were driving the price momentum in the market. SMA, however, registered a golden cross, which is when the 20-SMA crossed over the 50-SMA line; this marks a bullish signal for the coin.

Chainlink Price

LINK also captured a sell signal on the daily chart. This was an indication to owners to sell the asset and buy later, as the altcoin’s price could fall further. The Moving Average Convergence Divergence (MACD) displayed red signal bars that are tied to the sell signal for the asset. The Bollinger Bands portray price volatility and fluctuation. The bands drew closer together, indicating that the price might fall further.

Over the last 24 hours, LINK has dipped by 2%. In the past week, the coin has lost close to 14% of its market value.

Will This New Development Push The Chainlink Price To $7?

The Chainlink price has not reflected positive changes despite a major development in the altcoin’s ecosystem. Over the last 24 hours, LINK has declined by over 4%. Even in the weekly window, the altcoin lost over 6% of its value.

LINK had charted considerable gains in the month of November. The bulls, however, could not sustain the price action as the coin moved southward at the beginning of December.

Chainlink’s price has dropped below the $7 mark. For the coin to turn bullish, it must break past the aforementioned price zone. Investor interest has yet to echo on the daily chart. Chainlink is a blockchain oracle network that has launched its staking feature. This shall help to enhance the economic security of the platform’s services as a whole.

This development is supposed to be a vital part of its “Chainlink Economics 2.0” effort, which is aimed at promoting better security and ensuring sustainable growth within the ecosystem. The technical outlook has displayed a fall in accumulation, and at the current price, LINK is trading at an 87% discount from its all-time high secured in 2021.

Chainlink Price Analysis: One-Day Chart

Chainlink Price

Chainlink was priced at $6.86 on the one-day chart | Source: LINKUSD on TradingView

LINK was trading at $6.86 at the time of this writing. Although the altcoin was trading close to the crucial price resistance mark, it had to get past one important price ceiling to claim $7. Immediate resistance stood at $6.90. After breaking through the $7 mark, Chainlink may encounter a major barrier at $7.36, indicating a significant retracement.

If LINK falls below the present price level, it could land at the $6.22 mark and then at $5.90. The amount of LINK traded in the last session witnessed a dip, which meant that sellers were still in charge and that price sentiment was bearish.

Technical Analysis

Chainlink Price

Chainlink depicted fall in buying pressure on the one-day chart | Source: LINKUSD on TradingView

LINK had managed to secure more buying pressure this month, but with constant volatility and price swings, the bulls have finally worn out. The Relative Strength Index dipped below the half-line, indicating falling buyer interest.

Reflecting the same sentiment, the Chainlink price peeped below the 20-Simple Moving Average line, which meant that sellers had started to drive the price momentum in the market. Buyers will be back for a considerable time period if Chainlink prices rise above $7.36.

Chainlink Price

Chainlink noted a fall in buy signal on the one-day chart | Source: LINKUSD on TradingView

Regarding declining buying strength, other technical indicators also presented similar readings. The buy signal on the daily chart started to fall. The Moving Average Convergence Divergence, which reads the price momentum and trend reversal, noted that the green histograms were shorter in size.

This is not good news for buyers, and buyers must refrain from accumulation at this point. Similarly, the Parabolic SAR, which depicts the price direction, formed a dotted line above the candlestick, signifying downward price action in the market.

Featured image from LeewayHertz, Chart: TradingView.com

Chainlink (LINK) Performs Poorly Amidst Market Uncertainty

Chainlink (LINK), the leading oracle network, normally performs on the day following the market downturn. LINK has experienced a 1.58% increase in the last 24 hours, trading at $6.22.  Overall, LINK has recorded over 12% loss in the weekly chart. The token had surged higher in the day, reaching a local high of $6.38 before retracting. 

The value of Chainlink (LINK) rose earlier today as the market reacted favorably to a combination of events. Brainard’s doveish statements on Monday, a dropping dollar, Zelensky’s peace negotiations commencing, and Biden-Xi meeting not escalating tensions. Choose whichever explanation or combination of reasons you choose for the abrupt risk-on shift in markets. Either way, it’s excellent news for LINK price action.

Chainlink Offers Its Proof-of-Reserve Product As FTX Crash Rocks The Crypto Market

Chainlink Labs’ proof-of-reserve product was offered on Nov. 10 to help solve future trust problems in the crypto exchange market. Chainlink Labs posed the question in a series of tweets: “Will crypto continue to repeat the mistakes of the traditional black-box financial industry? Or will a better system emerge?” In response, it offered its proof-of-reserve (PoR) solution. Chainlink stated it could validate centralized exchange asset reserves, off-chain bank account balances, cross-chain collateral, real-world asset reserves, and more.

Recently, the crypto market has been in freefall due to a liquidity problem at the second-largest crypto exchange, FTX. In response to these persistent challenges, the crypto community has been discussing solutions. One possibility is for users to need Proof-of-Reserve from every exchange they use.

Using a proof of reserve, customers may conduct an instantaneous audit of cryptocurrency exchanges’ reserves. Several exchanges have begun to adopt proof of reserve, and Binance CEO Changpeng Zhao has suggested that all exchanges should implement it soon. However, several marketplaces have claimed that developing a proof-of-reserves system will take weeks, if not longer. Chainlink Labs rebutted by saying their offering is an “out-of-the-box” answer that exchanges can start using right now.

LINKUSD

Chainlink’s price is currently trading at $6.32. | Source: LINKUSD price chart from TradingView.com

What The Charts Say About Chainlink

Since May, LINK has fluctuated in price between $9.45 and $5.62 (yellow), with a mid-price of $7.54. The range’s midpoint has provided strong support and resistance within this time. Bearish momentum was indicated by a Relative Strength Index (RSI) reading below 50 and a Chaikin Money Flow (CMF) reading below -0.05. Both indicators point to considerable outflows of money from the market.

Related Reading: KuCoin Token (KCS) Loses 12% Amidst Top Coins Bleeding

The fall of LINK from $9 to a swing low of $5.7 in November also severely impacted OBV. Yet, the OBV has shown a trend of higher lows since July. This was evidence that some LINK tokens had been accumulated over time.

The $6.3 support level has held firm over the previous six months. In recent months, the $6.3 and $5.9 price points were clearly visible as support levels in the lower time frames. Chainlink has yet to drop below the range of lows despite the severe market volatility of the previous week. As of writing, Chainlink still trades at the $6.3 level, a 1.36% decrease intraday.

Featured image from Pixabay and chart from TradingView.com

Chainlink (LINK) Loses Gains Due To Market Bloodbath, Is Rebound Possible?

The cryptocurrency market has been facing high volatility at the time. With Bitcoin recording over 13% loss on the day, altcoins took effect and plummeted heavily. Similarly, Chainlink lost its gains following the market trend. But, the token established itself as one of the top gainers on the same day and marked $9.34. Due to turns of events, LINK currently fluctuates a loss of 19.80% and trades at $7.36. This currency made its investors happy with a week-over-week increase of over 3%. 

Several key metrics favor LINK maintaining its run in the coming weeks. The token’s underlying blockchain has also bagged several partnerships during the week. Furthermore, LINK crossed a 3-month high today despite the market volatility. As such, the token looks poised to face a bullish rally head-on.

Massive LINK Wallet Activities Pushed Token’s Price Upward

The LINK price, as reported by Santiment in a recent tweet, reached a high of $9.20. The last time it reached this level was in the middle of August. The data agency’s team of specialists has settled on two possible explanations for the LINK price increase above $9. They assume that the intense activity of LINK wallets throughout last month was the primary driver of the price surge. Furthermore, investors have been “aggressively” longing LINK. This helped increase the altcoin’s price, causing a surge in funding rates.

And on November 3rd, Chainlink announced yet another significant partnership. This time with Seedify Fund, a premier incubator and launchpad for DLT games, NFTs, and metaverses. Chainlink’s goal in building this partnership is to facilitate the growth of the GameFi and NFT industries through its oracle services. 

Meanwhile, the coin’s supporters eagerly await the start of staking on Chainlink. As of the end of October, 459 wallets had more than 100,000 LINK, even though the specific date had yet to be disclosed. In fact, this is the highest level since 2017. In addition, Chainlink implemented fourteen integrations across four chains: BNBChain, Arbitrum, Ethereum, and Polygon.

LINKUSD

LINK’s price is currently trading above $7.52. | Source: LINKUSD price chart from TradingView.com

There Is Still the Potential for A 25% Correction

Since May, LINK has been consolidating its rebound gains inside the confines of an ascending triangle. Ascending triangles are continuation patterns. This means that after a period of consolidation, the price tends to move back in the direction of its previous trend. Before forming its ascending triangle, LINK was on a declining trend.

Based on seasoned investor Thomas Bulkowski’s ascending triangles analysis, LINK’s chances of continuing its downturn and reaching its profit goal are 44%. As seen below, the profit goal is calculated by adding the triangle’s maximum height to its breaking point.

Thus, by December 2022, the LINK price will have dropped to roughly $4.15, or nearly 50% less than its current value. However, independent market analyst Pentoshi forecasts LINK will hit $12 in the same time frame. According to him, the token has been trading above the same support that helped drive its price to a record high in May 2021. Pentoshi said, “While people are quiet on it now. I don’t think that will be the case 3-4 weeks from now.”

Featured image from Pixabay and chart from TradingView.com

Chainlink (LINK) Performs Well Amidst Market Uncertainty

November is starting to be an uncertain month for the crypto market. However, Chainlink (LINK) seems to be bullish as it has kept substantial gains from last week. The altcoin also performed well earlier today, establishing a local high of $7.96.

Chainlink’s price started a bullish trend after testing and confirming support at the $6.50 level. The price feed oracle token suffered a devastating October reversal, wiping away all of its September gains. However, it was able to recover around 6% before the month ended.

LINK is trading at a 1.49% gain as of writing. Its daily candle is also green and might just touch its local high before the end of today.

The DeFi Derivatives Market Has A New Oracle Solution from Chainlink

As the DeFi (decentralized finance) sector expands, Chainlink has responded by developing “ultra-low latency pull-based price oracles. The solution focuses on allowing and safeguarding this enormous on-chain market.” It forecasts that the DeFi derivatives market will expand more in the years to come. Therefore this growth will dramatically alter the way dApps create value.

According to a related blog post, “We anticipate that a testable version of this new pull-based Chainlink oracle solution will be ready by the end of the year.”

Over the years, Chainlink has been the de facto standard for receiving oracle-based price feeds. The protocol’s solutions are widely used by the crypto industry, particularly by smart contract infrastructures. Chainlink’s early entry into the DeFi derivatives market will offer it an advantage over its rivals. It might also boost the value of the network’s native token, LINK.

LINKUSD

LINK’s price is currently hovering at $7.85. | Source: LINKUSD price chart from TradingView.com

What LINK’s 4-Hour Chart Says About Its Future Movement

ChainLink price movement shows market volatility after closure. This means that the price of ChainLink is becoming more dynamic, with less tendency to swing wildly to either extreme. The $8 upper bound of the Bollinger band is the most formidable barrier for LINK to break over. Bollinger’s band’s lowest limit is $7.5, where LINK finds the most support.

LINK/USD looks to be making positive price movement over the Moving Average. The upward trend in the market appears to be continuing. But the LINK/USD exchange rate is trending higher, suggesting the market is expanding. There are signs that the market could go up.

The Relative Strength Index (RSI) for ChainLink at its current price of 55 indicates a rather steady market for cryptocurrencies. To put it another way, Chainlink is now trading above its central-neutral value. The Relative Strength Index also seems to trend higher, suggesting a rising market. The RSI value rises when purchasing activity is on the upswing.

Where Does Link Go From Here

It’s worth noting that LINK’s daily chart readings were contradictory, indicating both a rise and a fall. For instance, the Money Flow Index (MFI) rose and approached overbought.

The negative Chaikin Money Flow (CMF) also fell near neutral. On the other hand, the Exponential Moving Average (EMA) Ribbon showed a bullish crossover when the 20-day EMA switched places with the 55-day EMA. However, LINK’s Bollinger Bands indicated substantial volatility. So, the question of where the price of LINK will go in the next few days is one that only time can answer.

Featured image from Pixabay and chart from TradingView.com

Chainlink (LINK) Continues To Shine With Over 14% Gains

Chainlink, the blockchain oracle service provider, continues to keep impressive weekly gains. The token soared with the entire crypto market, bagging over 14% gains. The last week of October has been favorable for the entire crypto market. Just a few days back, the entire crypto market cap crossed the $1 trillion mark. This bullish move acted as a catalyst for most tokens to register substantial gains, including Chainlink. 

However, the daily chart has been bearish for most coins. Top coins like Bitcoin and Ethereum are facing measurable losses on the day. However, Chainlink has stood out of the crowd, refusing to drop to the red zone.

Chainlink Soars Thanks To Increased Whale Activity

Chainlink (LINK) made a significant rise this past weekend, surging all the way to $8. At the time of writing, LINK was trading at $7.84, giving the blockchain a market cap of $3.8 billion. Strong whale activity served as a backdrop to the LINK price spike over the weekend. On-chain information service Santiment reports that this past weekend saw the highest number of LINK whale transactions in four months. 

Santiment added: “Chainlink whales have gotten quite active this weekend as market prices have teased the $8 level a few times. Saturday saw 33 different $LINK transactions exceeding a value of $1 million. This was the highest whale activity day since June 27th.”

Over the last month, Chainlink (LINK) has been on the radar of investors and crypto traders. This is evident in the number of whale activities throughout the month of October. The price of $8 is a significant resistance for Chainlink at the moment (LINK). If LINK breaks out above that level, it might be the start of a significant upswing. Chainlink has been strongly consolidating in the $6–$8 level for quite some time now.

LINKUSD

LINK’s price is currently trading at $7.74. | Source: LINKUSD price chart from TradingView.com

Popular Analyst Sees Bullish Future For Chainlink 

The cryptocurrency market was down for much of the day. While Chainlink is currently down 3.86%, it’s still one of the best performers among top tokens with a large market cap. One of the most-followed crypto analysts, Pentoshi (anonymously on Twitter), has expressed his optimistic view toward the asset. According to him, Chainlink’s chart has received the most attention over longer time horizons.

He instead prefers to talk about the upcoming Chainlink’s staking event, which is slated for December. Pentoshi argues that this will be the catalyst needed to drive LINK’s price to $12.45. At press time, the price of Chainlink is $7.83. So to meet the analyst’s objective, it would need to rocket by more than 55% from its current levels.

The expert continues by pointing out that the Total Market Cap of Crypto Index has recently hit a low. This index measures the total value of all altcoins, excluding Bitcoin and Ethereum. According to Pentoshi, the index will make an upward rise that will take it from $387 billion to roughly $456 billion. This signals a bullish outlook for the majority of the altcoins.

Featured image from Pixabay and chart from TradingView.com

Chainlink Price Consolidates, How Long Will The Bulls Stick Around?

Chainlink price has been moving sideways over the past day. In the last 24 hours, the coin has only increased by 0.4%.

Broader market price sentiments have crept in and many major altcoins have followed suit. In the past week, Chainlink has gained close to 6%.

It continues to struggle within the $7 price zone. For the coin to see bullish force yet again, it is imperative that LINK travels above the $8 price level.

The technical outlook of LINK has also indicated that bullish strength has started to exit the market. Demand for the altcoin has fallen, which has caused sellers to increase in number.

Despite the recovery that Chainlink price registered in the past week, the coin has not experienced positive buying strength.

This emphasized that LINK has to move past its next resistance mark for demand to increase on the chart. If buying strength continues to remain low, Chainlink will soon visit its closest support level.

Currently, the altcoin is trading at an 86% low from its all-time high, which it secured in the month of May 2021.

Chainlink Price Analysis: One-Day Chart

Chainlink Price

Chainlink was priced at $7.14 on the one-day chart | Source: LINKUSD on TradingView

LINK was trading at $7.14 at the time of writing. The altcoin has been moving sideways over the last 24 hours. This could prove difficult for the bulls as demand for the coin continues to decline.

Chainlink has to break past its overhead resistance of $7.36 and $7.71 to reclaim the $8 level. Once LINK starts to trade at the $8 level, the bullish momentum can re-enter the market.

Continued consolidation will cause Chainlink to move down to its local support line of $7 and then to $6.72. The coin might start to oscillate between these two levels if that happens.

The amount of Chainlink traded in the past session declined, which meant that sellers were back in the market.

Technical Analysis

Chainlink Price

Chainlink registered fewer buyers on the one-day chart | Source: LINKUSD on TradingView

Buying strength of Chainlink has consistently remained low for this month. The coin barely registered an increase in buying strength in the last several weeks.

The Relative Strength Index was below the half-line despite an uptick, which meant that sellers were still greater in number as compared to buyers.

Chainlink price was below the 20-SMA line as demand for the coin fell, and sellers were driving the price momentum in the market.

Chainlink Price

Chainlink displayed buy signal on the one-day chart | Source: LINKUSD on TradingView

The other technical indicators, however, indicated that buyers could make a comeback. The chart displayed the buy signal for the altcoin.

Moving Average Convergence Divergence indicates the strength of the price momentum and the price direction of the altcoin.

The MACD underwent a bullish crossover and formed green histograms above the half-line, indicating that those were the buy signal for Chainlink.

If buyers act on it then the coin can have a chance to redeem its bullish price momentum. The Directional Movement Index also points at the price direction and the strength of the same.

DMI was negative as the -DI line was above the +DI line.

The Average Directional Index was below the 20-mark, which meant that the current price momentum lacked strength.

Featured Image From VOI, Charts From TradingView

Chainlink (LINK) Performs Well Amidst Market Turning To Red

Price fluctuations are a daily occurrence in the crypto markets now. Since the fight against inflation began, the overall financial markets have tanked. Nowadays, asset prices swing without warning, and the continuing crypto winter only heightened the volatility. 

The recent event expected to boost market recovery has been completed. Ethereum is now operating on a proof-of-stake mechanism as planned. But after the successful launch, crypto asset prices dipped, and losses spilled over to the next 24 hours. 

Related Reading: Valkyrie Crypto Trusts Gather Nearly $74 Million In Funding Amid Bear Market

Currently, almost all the assets are red in price movements. The leading crypto Bitcoin has lost 2.95% in 24 hours. Ethereum, the center of attention during this period, has also lost 1.70% in 24 hours and 15.73% in 7 days.

But not all hope is lost. Some cryptocurrencies are rallying impressively, and the top leader in this category is Chainlink LINK. 

Chainlink LINK Gains 9.03% Amid Market Pullback 

Chainlink LINK is one of the cryptocurrencies currently gaining each hour on September 16. As of the time of writing, the LINK price stands at $7.71, representing an 8.19% gain in 24 hours. The price movement on September 16 has been very encouraging. LINK recorded some dips in its 24 hours trading, but not the red lines. The coin saw an intraday high of $7.759 and an intraday low of $7.4948. The next low point during the day was a dip to $7.60 before regaining its upward momentum. 

If the price continues upwards, LINK might grow considerably higher before the market closes. This gain is a welcome development for the crypto as its 7 days price growth sits at 2.23%.

LINK’s price is currently trading above $7.5. | Source: LINKUSD price chart from TradingView.com
What Could Be Pushing Chainlink Post-Merge

Chainlink has proven useful in the crypto space. The network has eliminated the struggle with oracles in smart contracts. It created a decentralized pool of oracles to provide real-time, accurate information for on-chain transactions. Smart contracts using Chainlink oracles can operate with reliable information. 

A few months back, an analyst Austin Arnold, a crypto analyst, addressed some key factors capable of pushing a crypto project’s value. He aimed to help his 1.24 million YouTube subscribers pick the right crypto to invest in during the raging bearish trend. 

The analysts picked four popular projects, of which Chainlink LINK was the first. According to Arnold, five factors will drive LINK’s future growth after the crypto winter. 

The first is the right team with capable skills in controlling the network. Other factors include adequate funding, strategic partnerships, solutions for real-life problems in blockchains, and network positioning in verticals. 

Related Reading: Bitcoin Whale Selling Pressure Continues As BTC Dips Under $20k

Arnold pointed out that the Chainlink network has these five characteristics. He noted how the Oracle network had improved BNB Chain BNB and Polygon MATIC, showing developers’ adoption. 

Even during the crypto winter bloodbath in the market, Chainlink LINK maintained its price range between $6+ and $8+. It recorded a spike to $9.28 on June 10 but later dipped to $8.05. The lowest price LINK recorded between May to September 16 was $5.97 on July 13 before bouncing back to $6.18 the next day. 

Featured image from Pixabay and chart from TradingView.com

Chainlink Price Above $8, Can It Go Past Its Immediate Resistance?

Chainlink price has been trading in an upside channel over the past few trading sessions. The altcoin has managed to move past the $8 level, it is now eyeing the next important resistance mark. The technical outlook of the coin has turned positive as buying strength increased on the chart.

Over the last 24 hours, the coin moved up the chart by 2% and in the past week, LINK logged 14.7% appreciation. Chainlink price also managed to revisit the $8.80 mark however, the coin has experienced tough resistance at that price mark.

For Chainlink to move past the aforementioned price ceiling, buying strength has to remain high in the market. Once LINK topples over the $8.80 price ceiling, it could target $9, thereby, invalidating the bearish thesis completely. It is important to note that a small dip in demand for the altcoin can bring back the bears

Chainlink Price Analysis: Four-Hour Chart
Chainlink price was at $8.70 on the four hour chart | Source: LINKUSD on TradingView

LINK was priced at $8.72 at the time of writing. The altcoin retraced briefly after it touched the $8.80 price mark. The immediate price ceiling for LINK stood at $8.80 and a push above that level will propel Chainlink’s price to $10.

The local support level for LINK was at $8.16 and a fall below that will make the coin trade near the $7.60 price mark. The amount of Chainlink traded in the past session increased. This reading meant that bullish pressure had started to build in the market and that buying strength increased over the last trading sessions.

Technical Analysis
Chainlink depicted increased buying strength on the four hour chart | Source: LINKUSD on TradingView

The altcoin has depicted trading on an upside in an ascending trendline. Chainlink price formed higher highs and higher lows signifying positive price change.

If LINK doesn’t break past the immediate resistance mark, the coin can lose its current price momentum.

The altcoin had just visited the overbought zone after which it travelled south briefly. The Relative Strength Index was positive above the 60-mark depicting increased buying strength.

Chainlink price was above the 20-SMA line. A reading above the 20-SMA line indicates that buyers were driving the price momentum in the market.

Chainlink flashed buy signal on the four hour chart | Source: LINKUSD on TradingView

LINK has depicted an increased buy signal on the four-hour chart. Indicators also captured the increase in demand. Moving Average Convergence Divergence portrays the current price momentum and possible reversals in the same. MACD underwent a bullish crossover and formed green signal bars on the indicator.

These green signal bars are buying signals for the coin. If buyers continue to act on it, the Chainlink price could soon topple over $8.80. Parabolic SAR depicts the trend, the indicator, however, hasn’t painted a positive picture. It started to form a dotted line above the candlestick, this could be in the anticipation of a fall in price over the next trading sessions.

Featured image from Yahoo Finance, chart from TradingView.com

Chainlink Pictured Chance Of A Further Pullback To This Level

Chainlink was bearish on its chart at the time of writing. Over the last week, the coin witnessed significant decline on its chart. Despite the 2% overnight appreciation the technical outlook of Chainlink remained negative. Fall in the market movers prices has pushed many altcoins to travel south on their charts.

Prior to this, LINK was consolidating between $6.70 and $7.00 respectively. A fall in LINK’s price has caused it to travel below the $6.70 price mark. Technical outlook started to reflect a change in price direction as buying strength slightly grew in the market.

Despite the change on the technical outlook, LINK was still hovering in bearish territories. At the present moment, the altcoin’s price movement cannot be termed as an invalidation of the bearish thesis. For LINK to defeat the bears, the coin has to be above the $8.00 mark.

Along with that, buying strength has to consistently remain positive, a fall in that will drag the coin below the $6.00 support level. The global cryptocurrency market cap today is $1.03 Trillion with a 1.5% positive change in the last 24 hours.

Chainlink Price Analysis: Four Hour Chart
Chainlink was priced at $6.58 on the four hour chart | Source: LINKUSD on TradingView

LINK was trading at $6.58 at the time of writing. Before the decline on its chart, the coin was priced between the $6.70 and $7.00 levels respectively.

Immediate resistance for the altcoin was at $6.70 which had previously acted as a support level.

If LINK can manage to swoop past the aforementioned level, the next price ceiling would be at $7.34.

Nearby support level for the coin was at $6.22 but if the bears take over completely, LINK might fall as low as $5.54.

The amount of Chainlink traded over the last trading session saw an increase which meant that buying strength was recovering in the market.

Technical Analysis
Chainlink portrayed rise in buying pressure on the four hour chart | Source: LINKUSD on TradingView

The altcoin over the last 24 hours rose by 2% and buying strength also displayed some recovery. The Relative Strength Index moved up and beyond the half-line which indicated that buying strength was slowly rising on the chart.

This rise in the buying strength cannot be termed as a bullish move as the coin has to move past the $6.70 price level.

Price of LINK however shot past the 20-SMA line which is an indication of buyers driving the price momentum in the market.

As the demand resurfaced, LINK moved above the 20-SMA line. For bulls to take over completely, the coin has to remain above the 20-SMA line.

Related Reading | Cardano Moves In The Red With The Market, Can The Price Of ADA Stay Above $0.46?

Chainlink displayed sell signal on the four hour chart | Source: LINKUSD on TradingView

The altcoin despite rising on the chart minorly still displayed signs of being under bearish influence. The Moving Average Convergence Divergence portrays price momentum and reversals in the same.

MACD noted a bearish crossover and formed red signal bars.

These red signal bars were sell signal for the altcoin. Bollinger Bands which represents price volatility, had started to narrow down.

This reading meant that chance of price volatility and fluctuation was low at the time of writing.

Related Reading | BNB Basks In The Green As Price Glows 5.84% In Fields Of Red

Featured image from Libertex, chart from TradingView.com

Chainlink Hits $30 as Grayscale Adds 115,570 LINK to Its Reserves

Chainlink prices climbed higher on Thursday, rising by as much as 5.10 percent on the prospects of higher institutional adoption.

The LINK/USD exchange rate reached its previous week’s high of $30 before correcting lower during the early London session. Its uptrend majorly came as a part of a broader bullish trend across the altcoin market. Meanwhile, LINK received an additional upward boost from New York-based Grayscale Investments’s overnight buying spree.

Grayscale Goes Shopping

Data fetched by ByBt.com shows that the crypto investment firm bought 115,570 LINK tokens for its Grayscale Chainlink Trust from March 17 until April 1. That includes a 65,570 LINK purchase on Thursday, which coincided with a price pump in the Chainlink market.

Grayscale LINK holdings shoot up dramatically overnight. Source: ByBt.com

Technical indicators on the LINK/USD four-hour chart showed the pair trading inside an ascending rising wedge. The bids oscillated between two diverging bullish lines, providing traders ample opportunities to generate interim profits on each bounce from the lower trendline and pullback from the upper trendline.

Chainlink hints bearish reversal on ascending broadening wedge formation. Source: LINKUSD on TradingView.com

Nevertheless, Ascending Rising Wedges are bearish reversal patterns. Central Charts notes that the bullish-looking structure leads to a downside breakout in 80 percent cases. Should it happen, the LINK price could fall to as low as $25.

A 37% Chainlink chaiBreakout Theory

An analysis shared by Akash Girimath on FXStreet.com shows Chainlink in an extemely bullish state. The analyst noted that LINK/USD now trades inside a symmetrical triangle structure, which raises the pair’s possibilities of logging a 37 percent bullish breakout move should it break above the pattern’s upper trendline resistance.

“A bullish breakout above $30.3 could push LINK to $41.6, but a breakdown of the lower trend line at $25 might result in a sell-off to $15.7,” noted Mr. Girimath.

Chainlink symmetrical triangle outlook, as presented by Akash Girimath. Source: LINKUSDT on TradingView.com

Other cryptocurrency analysts also presented a bullish outlook for Chainlink, with Michaël van de Poppe, a Netherlands-based stock trader, highlighting LINK’s growing strength against its top rival bitcoin. An asset’s value against the dollar tends to rise faster if it grows against bitcoin, as well.

Chainlink trade outlook against bitcoin, as explained by Michaël van de Poppe. Source: LINKBTC on TradingView.com

“LINK is most likely bottomed out in the BTC pair,” said Mr. Poppe.

More bullish tailwinds from on-chain data fetched by Santiment, a cryptocurrency sentiment tracking service. The platform noted that the number of rich Chainlink wallets hodling anywhere between 100 and 100,000 LINK tokens rose throoughout March, pointing to a higher buying sentiment.

“Chainlink knocked on the door of $30 for the first time in 11 days, climbing to $29.99 on Binance and still within close range. We’re keeping an eye on mid and large holders owning between 100 to 100k LINK, as they’ve accumulated greatly in March.”

Photo by Julian Hochgesang on Unsplash