Litecoin Eliminates Pre-Halving Gains As Volume Drops, Is A Fall To $50 Coming?

In the months leading up to the Litecoin halving in August, the price of the blockchain’s native LTC token was continuously on the rise. This renewed interest in investors who rushed back into the token and eventually pushed its price above $100. That is until the actual halving event rolled around, turning it into a “buy the rumor, sell the news” scenario. Since then, it has been a downward spiral for the token and the pain may not be over.

Litecoin Volume Slumps Post-Halving

Litecoin volume since the halving was completed has been less than expected. While investors expected rising demand for the LTC token with the diminished supply rate, the opposite has been the case. Instead, the daily trading volume of the cryptocurrency continued to slump.

In the last day, the Litceoin daily trading volume fell another 23%. This brought its daily volume to $255 million, a significantly low figure compared to the $500 million daily volumes that the cryptocurrency was recording leading up to the halving.

Litecoin volume

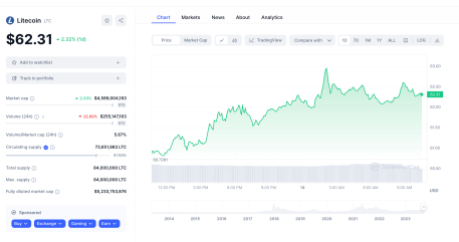
Just like the trading volume, the price of LTC has also plunged significantly. From its pre-halving peak of $112, the altcoin has fallen over 50% to its current level just above $60. This means that the asset has lost all of its gains accumulated between June and July 2023, just one month after the halving was completed.

So rather than being a bullish event as initially expected, the halving has proven to be more bearish than most. It also did not help that it took place during the bear market and LTC has fallen rapidly alongside larger assets such as Bitcoin and Ethereum.

Litecoin price chart from Tradingview.com (Volume)

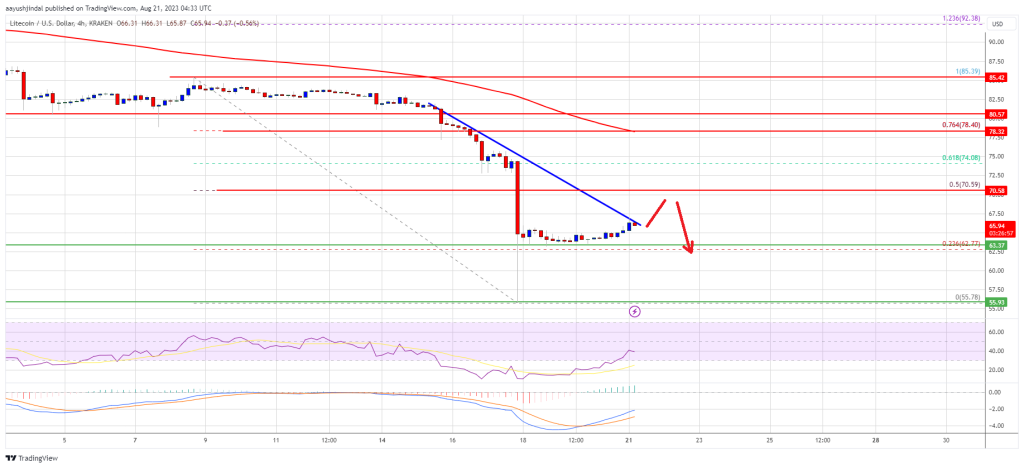
Will LTC Fall Continue To $50?

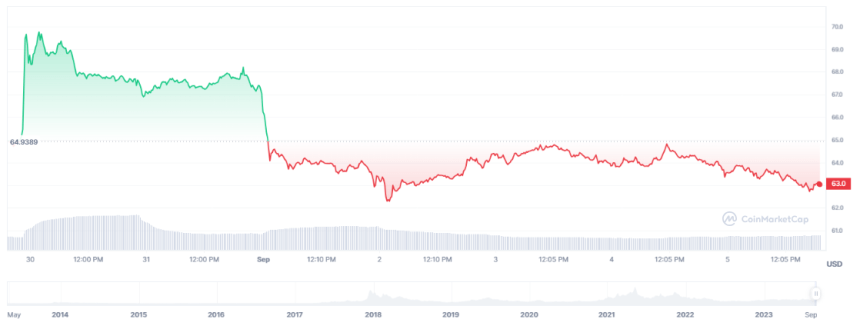
At the current rate, the forecast does not look too good for the LTC price. Litecoin has understandably seen a 3% increase in the past day as Bitcoin recovered above $26,000. But this does not look sustainable by its current metric.

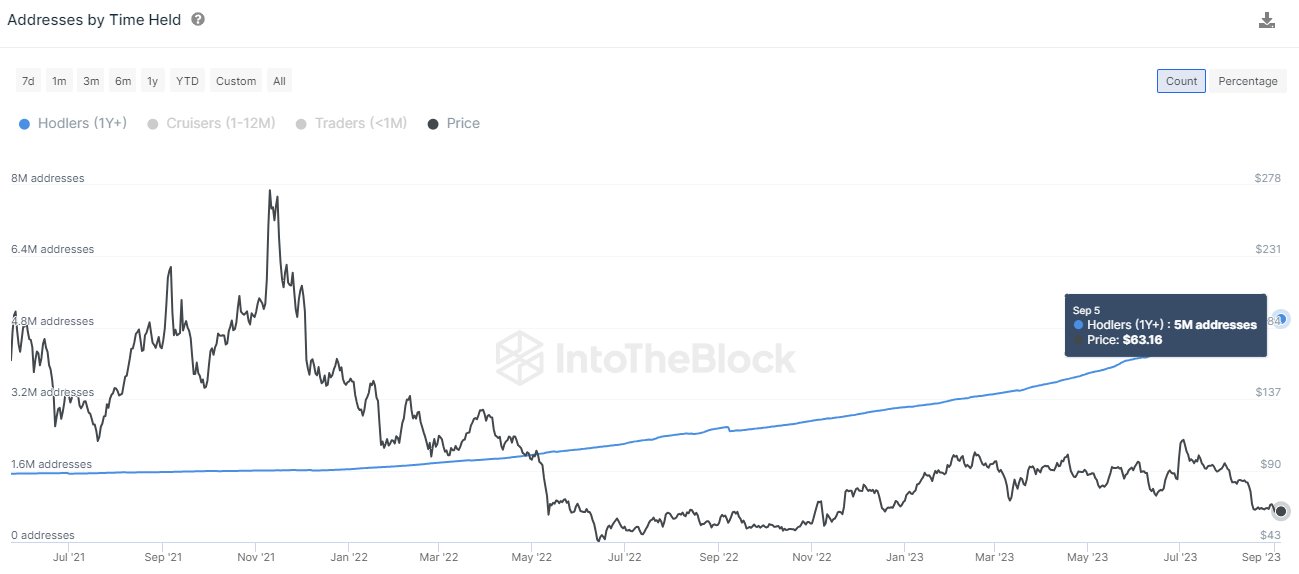
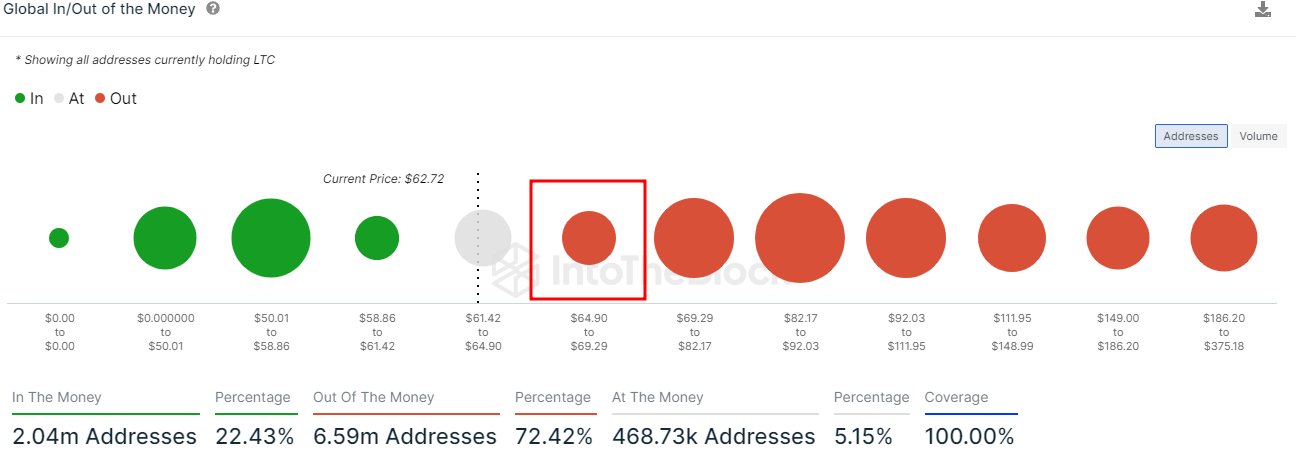
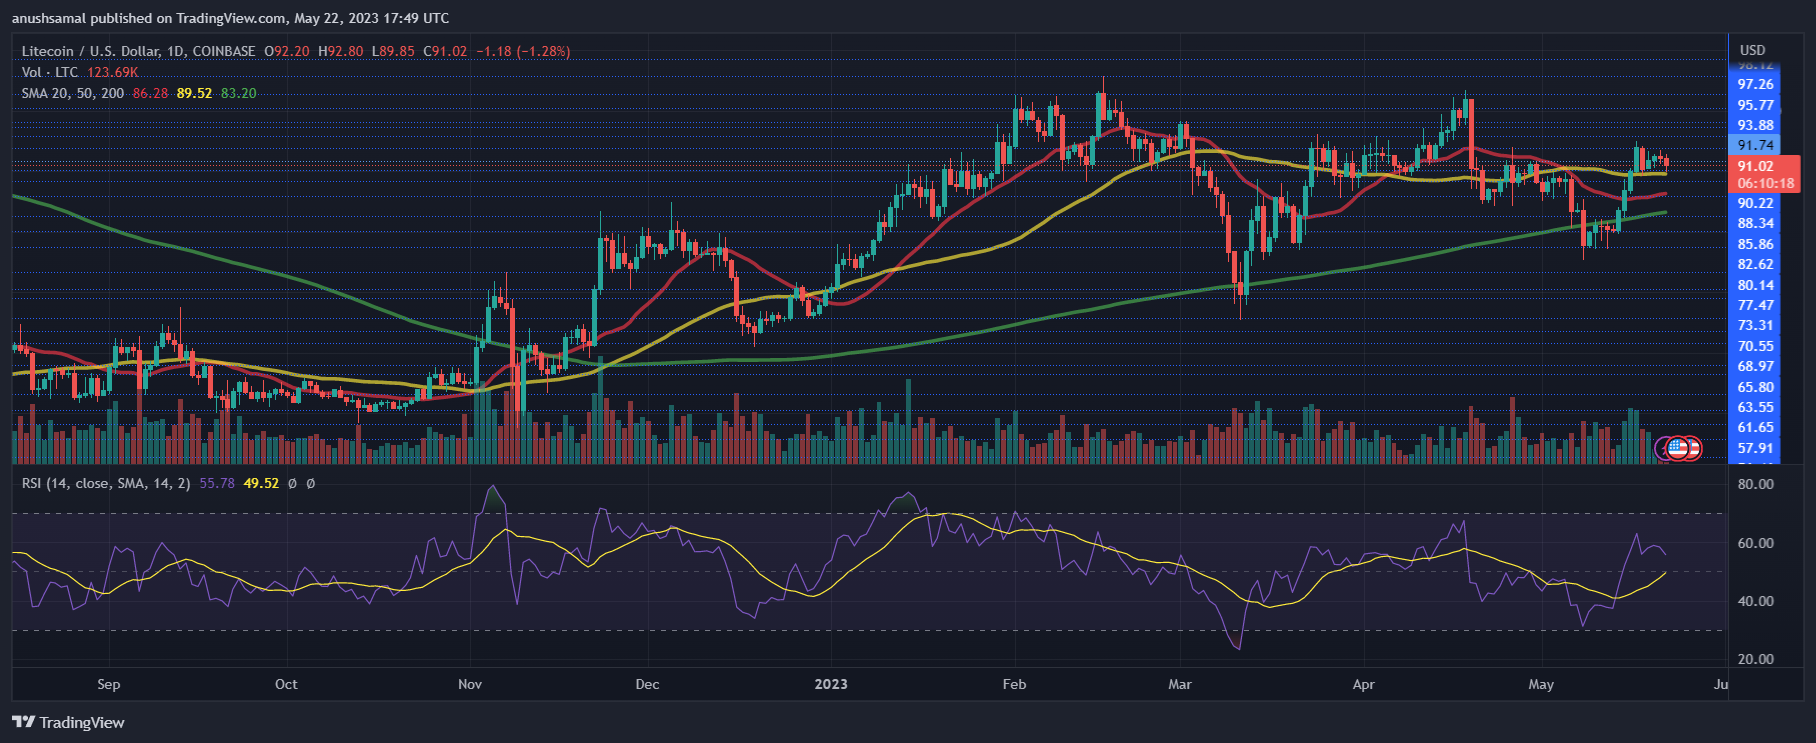
The first indicator of this is that falling daily trading volume means that interest in the asset is waning. As investors move to other assets they believe provide better prospects, this will affect the LTC price and could trigger further downside from here. Add to this that the coin’s price is below its 50-day and 100-day moving averages and it spells a recipe for disaster.

If LTC bulls are unable to hold support above $60 and it falls once again as it did on September 11, then $50 becomes a very possible landing point. Such a decline would put it back at November 2022 levels and signal a prolonged bear trend for the digital asset.

At the time of writing, LTC price is still sitting above $62 but the tug-of-war for control between bulls and bears continues to rage on.

Litecoin Breaks Another Record: HODLers On Network Now Exceed 5 Million

On-chain data shows Litecoin has reached another milestone as the total number of HODLers on the network now exceeds five million.

Litecoin Long-Term Holders Have Continued To Rise In Number Recently

According to data from the market intelligence platform IntoTheBlock, LTC has seen its long-term holder count hit a new record this week. The firm defines “long-term holders” (LTHs) or HODLers as investors holding onto their coins since at least one year ago. Note that this cutoff for the LTHs differs from what some other analytics platforms use, usually around five to six months.

The chart below shows how the number of addresses owned by these LTH HODLers has changed over the past few years.

Litecoin HODLers

As displayed in the above graph, the Litecoin HODLer count has significantly increased during this period. Since the start of last year, in particular, the indicator has seen exponential growth.

Following this sharp rise, the number of addresses carrying coins since at least one year ago has now broken the five million mark, a new record for the cryptocurrency.

Interestingly, while the LTHs have grown in number during this period, the cryptocurrency price has mostly struggled. This shows that despite the poor price action, there has been growing confidence among a subset of holders who believe that the asset would be a profitable investment in the long term.

This is naturally a positive development for the cryptocurrency, as more LTHs mean more supply that’s locked inside the wallets of these resolute hands, which in turn implies a lesser possibility of selling occurring in the market.

LTC Price Has Continued To Struggle Recently

Since Litecoin finished its plunge in mid-August, its price has only moved sideways. When writing, the cryptocurrency is trading at around $63.

Litecoin Price Chart

While the Litecoin HODLers only going up in number through this slide since July is a constructive sign for the asset, it may not mean much in the short term.

Where the LTC price could go next from here depends on several factors, one of which could be on-chain resistance and support levels. IntoTheBlock has shared the concentration of the investors at the different LTC cost basis price ranges.

Litecoin Profit/Loss

The “cost basis” here refers to the price at which the investors bought their coins. In the above data, the dot for the $64.9 to $69.29 range, for instance, represents the percentage of Litecoin investors who bought at prices lying inside this range.

Generally, when the price surges to cost basis levels with a high amount of investor concentration, there is a chance that the asset could feel some resistance. This is because these investors, previously in losses, come into the green with the surge, which may entice them to sell and exit the market.

The range ahead of the current one looks to be not that concentrated with holders, which may mean that Litecoin wouldn’t find too much resistance if a surge toward the $69 mark has to happen. However, there are notable percentages of holders in the following few price ranges, making a further surge difficult.

Litecoin Price Momentum: Will It Sustain Above The $63 Mark?

Litecoin (LTC) has found itself in a tight consolidation phase, firmly locked within the $60 to $70 range since mid-August. Despite several attempts to break above the $70 resistance level, bulls seem to be running low on aggressiveness.

As of the latest data from CoinGecko, LTC is trading at $62.99, reflecting a 1.8% decline over the past 24 hours and a seven-day slump of 3.1%.

In recent weeks, LTC bulls have diligently defended the August 2022 range-high of $63, preventing a drop below this crucial support level. However, their efforts to push the price beyond $70 have proved futile. 

Litecoin Bulls Defend Key Levels But Face Technical Challenges

A closer look at the technical indicators reveals that the H12 bearish order book and the 50-day Exponential Moving Average (EMA) are posing significant challenges for the bulls.

Analysts believe that Litecoin could continue its consolidation above the $63 range-high in the coming hours or days. Still, the prevailing bearish pressure could hinder any substantial upward movement in the near term.

LTC’s Struggle Amid Growing On-Chain Activity

Surprisingly, despite Litecoin’s price consolidation, its on-chain data has shown increased activity in its ecosystem. According to a separate report, over the past four months, the share of Litecoin in global cryptocurrency payments has surged by an impressive 21%. 

This suggests that despite the stagnant price, Litecoin remains a popular choice for transactions.

Sell Limit Orders And Bearish Sentiments

To complicate matters further for LTC, order flow tracking platform Mobchart cited in an analysis significant sell limit orders at $66 (3.11k LTC) and $70 (3.26k LTC) on Binance Exchange’s spot market. 

These levels are strategically positioned between the H4 50-EMA and the H12 bearish order book, effectively forming a formidable barrier for Litecoin’s price to overcome. This adds to the growing challenges faced by LTC bulls in their quest to push the price higher.

Moreover, sentiment around Litecoin has been increasingly bearish in recent times, as indicated by a separate report revealing that LTC bears have strengthened by 19% in the past week. This surge in bearish sentiment has likely contributed to the current downward pressure on LTC’s price.

Litecoin (LTC) remains trapped within the $60 to $70 range, with technical indicators and significant sell orders acting as obstacles to any substantial price movement.

Despite on-chain activity showing promise, growing bearish sentiments continue to weigh on LTC’s price, making it a challenging period for Litecoin investors and enthusiasts.

(This site’s content should not be construed as investment advice. Investing involves risk. When you invest, your capital is subject to risk).

Featured image from CMC Markets

Litecoin Price Prediction: LTC Faces Uphill Task Near $70

Litecoin price declined heavily below $80 and $70 against the US Dollar. LTC is attempting a recovery wave but upsides might be limited above $70.

  • Litecoin is correcting losses from the $56 support zone against the US Dollar.
  • The price is now trading below $70 and the 100 simple moving average (4 hours).
  • There is a key bearish trend line forming with resistance near $66.00 on the 4-hour chart of the LTC/USD pair (data feed from Kraken).
  • The price could recover above $66 but the bears might remain active near $70.

Litecoin Price Starts Recovery

This past week, there was a sharp decline in Bitcoin, Ethereum, Litecoin, and other altcoins against the US Dollar. LTC price formed a top near $85 before it started a fresh decline.

There was a sharp decline below $80 and $70. The price even declined below $60. It traded as low as $55.78 and recently started an upside correction. There was a minor increase above the $60 resistance level. The price climbed above the 23.6% Fib retracement level of the downward move from the $85.39 swing high to the $55.78 low.

Litecoin is now trading below $70 and the 100 simple moving average (4 hours). There is also a key bearish trend line forming with resistance near $66.00 on the 4-hour chart of the LTC/USD pair.

On the upside, immediate resistance is near the $66 zone. The next major resistance is near the $70 level. It is close to the 50% Fib retracement level of the downward move from the $85.39 swing high to the $55.78 low. If there is a clear break above the $70 resistance, the price could start another strong increase.

Litecoin Price Prediction

Source: LTCUSD on TradingView.com

In the stated case, the price is likely to continue higher toward the $75 and $78 levels. Any more gains might send LTC’s price toward the $85 resistance zone.

Fresh Decline in LTC?

If Litecoin price fails to clear the $70 resistance level, there could be a fresh decline. Initial support on the downside is near the $63.50 level.

The next major support is forming near the $60 level, below which there is a risk of a move toward the $56.00 support. Any further losses may perhaps send the price toward the $52 support.

Technical indicators:

4-hour MACD – The MACD is now gaining pace in the bullish zone.

4-hour RSI (Relative Strength Index) – The RSI for LTC/USD is still below the 50 level.

Major Support Levels – $63.50 followed by $60.00.

Major Resistance Levels – $66.00 and $70.00.

Litecoin Hash Rate Steady Despite Dismal Price Action: Will This Change?

One week after the highly anticipated Litecoin halving event on August 2, on-chain data reveals that the network’s hash rate, a key measure of computing power channeled to the network, is steady but erratic.

As of August 9, trackers indicate that the Litecoin network’s hash rate is hovering around 760 TH/s, a notable decrease from the all-time peak of 816 TH/s recorded in late July 2023.

Litecoin Prices Steady But Lower, Rally Incoming?

Litecoin prices, on the other hand, are firm but down in the previous week of trading. CoinMarketCap data on August 9 shows that LTC is changing hands at $83, down 5% over the past week. What’s clear is that prices are moving tightly inside a consolidation range.

LTC price on August 9 days after Litecoin halving| Source: LTCUSDT on Binance, TradingView

Despite this dip, LTC is relatively resilient, up 17% from June 2023 lows. However, from a top-down preview, the coin is down 26% from the 2023 highs. In the medium term, LTC remains bullish since bears have failed to unwind gains posted from mid-June to mid-July 2023. Whether bulls will maintain control after halving, however, is also unclear.

If past performance guides, there is a glimmer of hope for bulls. The previous Litecoin halving in August 2019 was several months before LTC ripped to $400 in 2021. Even so, before this spike, LTC prices nearly halved from $66 to $35 in December 2019.

Unlike previous halvings, the crypto space has matured, and regulatory clarity has improved, particularly concerning Bitcoin—the foundational protocol from which Litecoin emerged. For instance, while most US regulators consider Bitcoin a commodity, the Securities and Exchange Commission (SEC) is cautious toward other altcoins.

Tracking On-Chain Metrics To Gauge Interest

Considering the above challenges and regulatory uncertainty, the interconnection between hash rate and spot prices is actively monitored. Litecoin relies on decentralized miners for security and transaction confirmation. 

The network’s security is evaluated via the hash rate metric, which risks crashing since miners must allocate more resources after the network halved rewards to 6.25 LTC. A potential price decline could trigger a corresponding reduction in hash rate, forcing the network to adjust the difficulty. 

How this evolves remains to be seen, and the network remains stable at spot rates. Besides the hash rate near all-time highs, the network’s activity seems unaffected. According to IntoTheBlock data, the network’s average growth is steady despite sentiment on LTC being generally negative.

Litecoin Long-Term Holders Smartly Exited Before Halving, Data Shows

Data shows that Litecoin long-term holders exited the asset before the halving, while short-term holders were left to panic on the halving day. The “halving” here refers to an event where the block rewards of Litecoin are permanently cut in half.

Litecoin Long-Term Holders Sold During Price Surge Before The Halving

According to data from the market intelligence platform IntoTheBlock, the long-term holders had been well-prepared for the “sell the news” halving event. The “long-term holders” (LTHs) generally include all investors who have been holding onto their coins since at least six months ago.

Related Reading: These Bitcoin Metrics Are At Important Retests, Will Bullish Trend Prevail?

This group includes some of the most resolute investors in the Litecoin market, who don’t easily react to whatever is going in on in the wider sector, as they usually hold through FUD or profit-taking opportunities without participating in any significant selling.

Because of how rare movements from these investors can be, the few times that they do sell can be the ones to watch out for, as they may spell trouble for the market.

A way to gauge whether the LTHs are participating in selling or not is through the “holding time of transacted coins” metric, which tells us about the average amount of time that coins being transferred on the blockchain had been dormant prior to this movement.

When the value of this metric is high, it means that the age of coins being sold on the network is high, which can naturally be a sign that the LTHs are active right now. On the other hand, low values usually indicate that the short-term holders (STHs) are the ones selling currently.

Now, here is a chart that shows the trend in the Litecoin holding time of transacted coins over the past few months:

Litecoin Long-Term Holders

As you can see in the above graph, the Litecoin holding time of transacted coins spiked back in June, when the price of the cryptocurrency had been observing a sharp rally.

During the largest of these spikes, the indicator’s value had exceeded 1 year, implying that some of the most experienced investors in the market had broken their silence.

This rally had occurred as the market had started getting hyped about the halving, which was only a month and a half away at that point.

This event takes place every four years, with the latest one having occurred just earlier this month. Unlike what some may have hoped for, the event didn’t prove to be bullish for LTC, as the aforementioned rally didn’t last for too long and the cryptocurrency only declined in the remaining leadup to the halving, until finally it actually sharply plunged on the day of the event itself.

It would appear that the experienced LTHs had already predicted something like this may happen, so they had taken the wise decision of selling while the opportunity was there.

In the post-halving selloff, the indicator’s value has remained low, implying that it’s only the short-term holders who have been panic selling after they saw that a bullish trend couldn’t return to Litecoin with the event.

LTC Price

At the time of writing, Litecoin is trading around $84, down 8% in the last week.

Litecoin Price Chart

Litecoin Hashrate Taps New All-Time High, Will LTC Price Follow Suit?

The Litecoin hashrate has been going up steadily over the last year. This was mainly driven by the anticipation leading up to the Litecoin halving that was slated to take place in August. Now that the halving event has come and gone, the hashrate has risen to a new all-time high, but the question is, whether the price of LTC will follow suit.

Litecoin Hashrate Taps New ATH Of 1.03 PH/s

The steady rise in the Litecoin hashrate is a testament to the growing interest in the network. The hashrate points to the fact that there are more miners on the blockchain trying to guess the correct answers to each block. And this translates to better security overall for the Litecoin network.

Interestingly, this increase in hashrate has seen the network hit not only a new all-time high but a significant milestone. According to data from CoinWarz, the Litecoin hashrate rose as high as 1.03 pentahashes per second (PH/s) on August 4.

This means that for the first time, LTC’s hashrate has left the terahashes per second (TH/s) territory and crossed into the pentahashes per second (PH/s) territory. Although it is still a long way from Bitcoin’s exahashes per second (EH/s), it is a testament to how much the Litecoin network has grown.

The Litecoin hashrate has since retraced back into the TH/s territory, now sitting at 739.88 TH/s as of Monday, August 7. But a look over the last year’s hashrate chart shows that even this is a high level for the blockchain’s hashrate.

Litecoin hashrate

Will LTC’s Price Follow The Hashrate?

Since the Litecoin hashrate hit its new all-time high, the price of LTC has been more volatile than normal. This is not out of the ordinary though as the altcoin has been following the general market trend and LTC’s is a testament to that trend.

So far though, it doesn’t seem like LTC has made any effort to break out of this trend. If anything, it has suffered more declines than recoveries, even dipping to as low as $$80.65 on August 4. This decline shows that the new hashrate ATH has not moved investors to invest more in the coin.

For now, something that could lead to an uptrend for Litecoin’s price is if Bitcoin begins another rally and the crypto market starts to see improved sentiment. Otherwise, LTC will likely continue to toe the $82 line for the better part of the week.

At the time of writing, LTC price is trading at $82.80, down 0.47% in the last day and 11.67% in the last week.

Litecoin (LTC) price chart from Tradingview.com

Litecoin Completes Halving, But Price Plunges 6%

Litecoin has completed its much-anticipated halving event today, but it seems the investors have reacted by participating in a selloff.

Litecoin Has Completed Its Third Halving, Block Rewards Now Down To 6.25 LTC

The “halving” event is where LTC’s block rewards are permanently cut in half. This event is periodic, occurring approximately every four years or roughly every 840,000 blocks miners hash.

Today’s halving was Litecoin’s third, meaning its block rewards have been cut three times since its genesis. In the first halving, the cryptocurrency saw its block rewards go from an initial 50 LTC to 25 LTC, and with the second, the tips dropped further to 12.5 LTC.

With the latest halving event, miners’ rewards for solving blocks have been cut down further to 6.25 LTC. The reason that halvings even exist is because they serve as a measure for controlling the asset’s inflation.

These block rewards that miners receive are the only way to introduce fresh tokens into the circulating supply, so cutting them down repeatedly makes sure that the cryptocurrency’s supply goes up slower and slower.

Eventually, when the halvings would keep on happening, the block rewards would approach zero. This would occur approximately in 2142. After this point, the asset’s supply will hit the maximum cap, and the miners will have to rely on transaction fees to pay off their running costs.

As halvings are important events, it’s natural that there has been a lot of discussion around this latest event as it has approached. During the start of July, the asset had observed a sharp rally towards the $114 mark, as the market had perhaps become hopeful for the halving, which was only one month away.

This rally, however, ran out of steam soon enough, and since then, LTC has struggled to put together any significant bullish momentum.

Litecoin Price Chart

Today’s halving hasn’t been able to change anything in this matter, either, as Litecoin has only plummeted further instead. It would appear that the event has indeed been a buy the rumor, sell the news type of scenario.

Following the latest plummet, Litecoin has gone below the $87 level and is down almost 7% during the past 24 hours. These high losses mean that LTC has been the poorest-performing coin out of the top cryptocurrencies by market cap in this period.

While the price performance of the asset might have been poor, LTC supporters may take solace in the fact that the asset has come forward a lot in terms of other network-related metrics since the previous halving, as data from IntoTheBlock shows:

Litecoin Comparison

Interestingly, the price at which both halvings happened was approximately the same. The cryptocurrency seems to have done well in terms of userbase and utility-related growth.

This impressive rise in adoption may be because Litecoin offers cheap and fast transactions compared to some other networks like Bitcoin. LTC investors can only hope, however, that this growth may also show up in the price.

Sell The News? Litecoin Traders Capitulate Ahead Of Today’s Halving

On-chain data shows that Litecoin traders are showing signs of capitulation as the asset’s much-anticipated halving event is only a few hours away now.

Is Litecoin Halving A Buy The Rumor, Sell The News Event?

The “halving” here refers to a periodic event where Litecoin’s block rewards (that is, rewards that miners receive for mining blocks) are permanently cut down in half.

This event takes place approximately every four years and the next one, which would be the third, is scheduled to happen in around five hours if data from the mining platform NiceHash is to go by.

Litecoin Halving

This third halving event will reduce the cryptocurrency’s block rewards from 12.5 LTC to 6.25 LTC. Historically, these events have been important for the asset, as they mark points where the cryptocurrency’s production rate (which is nothing but the block rewards, as miners releasing these coins is the only way to mint new LTC) shrinks, and hence, the coin becomes more scarce.

As these halving events are so significant, the market naturally speculates around them, leading to the coin experiencing volatility. In a new tweet, the on-chain analytics firm Santiment has revealed how the traders have been behaving in anticipation of today’s Litecoin halving.

Litecoin On-Chain Metrics

In the above graph, Santiment has attached the data of two metrics related to LTC: “social dominance” and the “ratio of on-chain transaction volume in profit to loss.”

The former of these tells us what percentage of discussion on social media related to the 100 largest assets in the cryptocurrency sector is coming from Litecoin alone.

From the chart, it’s visible that this indicator has observed a large spike today, showing that investors are participating in a large number of discussions related to today’s halving.

The other indicator keeps track of the ratio between the profit-taking and loss-taking volumes on the network. As displayed in the graph, this metric has taken a plunge below the 1 mark recently.

The ratio being less than 1 implies that loss-taking is the dominant force on the market at the moment. The loss volume is not only more than the profit volume right now, but it’s actually outweighing it at a ratio of more than 2:1.

This extraordinary loss-taking may be coming from the investors who purchased coins ahead of the halving believing it to be a bullish event, but as Litecoin has only gone down lower recently, the holders have panicked and are selling at losses in an attempt to avoid going further underwater. The high social dominance of the asset may also likewise be because of FUD-related discussions blowing up.

Based on these signs, it’s possible that Litecoin may be going through a classic “buy the rumor, sell the news” event.

LTC Price

At the time of writing, Litecoin is trading around $91, up 1% in the last week.

Litecoin Price Chart

Litecoin Sharks Buy More Than 200,000 LTC Ahead Of Wednesday’s Halving

Over the last few months, Litecoin has emerged as one of the top trending cryptocurrencies due to its halving event happening in August. As this event drew closer, crypto investors began filling up their LTC bags in preparation for what is expected to be a very bullish event. And now, with less than two days left to go before the halving, sharks have made remarkable moves to position themselves for possible upside.

Litecoin Sharks Load Up Their Bags

A report shared by the on-chain tracking platform Santiment revealed how Litecoin investors are currently looking at the digital asset. The chart showed an impressive accumulation trend from dolphin and shark wallets, which have increased their holdings significantly in the last month.

Santiment’s report shows that these wallets holding between $9,500 and $950,000 worth of LTC have added over 200,00 coins to their balances since June 14. On this date, the total holdings of these wallets were sitting just slightly below 18 million. However, in the next two weeks, their balances grew above 18.1 million coins.

Litecoin sharks and Dolphins

There has also been a semi-constant uptrend among these investors. Although there were dips here and there in their holdings, they remained committed to the accumulation over this last two weeks, each time buying more coins than they sold.

What Is Driving The LTC Accumulation?

The current accumulation from the dolphin and shark wallets are not isolated and just like the whale acquisitions, they are being driven by the same thing. The Litecoin halving is expected to take place on Wednesday and since this event has been historically bullish, it has triggered active participation from investors looking to capitalize on it.

If the LTC halving plays out as expected, then it is possible that the price of the altcoin will climb above $100 once more. This would put the majority of the LTC accumulated by the dolphin and shark addresses over the last two weeks back in profit territory.

However, the days leading up to the event haven’t been as bullish as expected. Even though LTC’s price is still trading above $90, it has seen only single-digit daily gains over this time. Naturally, with less than two days to go, there should have already been some rapid increases for the cryptocurrency but there has been none.

This current trend suggests that the halving may already be priced into LTC’s price, especially given the fact that the crypto bear market has continued.

At the time of writing, LTC is changing hands at a price of $93.80, down 0.98%, according to data from Coinmarketcap.

Bullish Case For Litecoin Grows Stronger As LTC Halving Draws Close

Litecoin (LTC) is still trending low like the rest of the cryptocurrency market but one thing that separates the altcoin from the others is its obvious bullish case. Unlike the rest of the market, Litecoin looks set for another rally which will likely be propelled forward by the next halving.

Litecoin Halving Presents Bullish Scenario

Just like Bitcoin, the Litecoin halving happens every four years and cuts block rewards by 50%. The aim of this halving is to reduce the amount of new supply flowing into the market. And as demand rises, there is less supply to meet this demand, thus leading to scarcity and a surge in prices.

The next Litecoin halving is now around the corner with only about three months left to go. This halving, like the ones before it, carries the same promise of a rally for the digital asset. The last halving in 2019 saw LTC’s price bottom out around $62 and then rally to a local peak of $80 in the same month.

Litecoin halving

If this year’s halving stays true to this trend, then the digital asset should be seeing some upside in the coming months. This could result in LTC clearing the $100 level once more as investors prep for the next leg-up.

A 20% upside is attainable at this point, especially with the halving expected to happen in early August. So more than likely, the buyers will dominate the market for the next two months, leading to rising prices for Litecoin.

LTC Outlook For 2023

Presently, the crypto market is seeing muted momentum as investors remain indecisive. For Litecoin, the upcoming halving remains a bullish event but the prospects for the months following the halving event do not look good given historical performances.

Litecoin price chart from TradingView.com

After each halving, LTC has seen a reversal in sentiment following the initial surge and the subsequent crashes have been more brutal than the uptrends. For example in 2019, LTC’s price crashed almost 50% in the month of September, one month after the halving was completed. This was because the bull market was yet to begin and the cryptocurrency fell back into lockstep with the rest of the market again.

Going by this historical performance, it would seem the best time to take profits would be toward the end of August after the asset has rallied around 30%. The window of opportunity closes with the month of September which has historically been a bearish month for cryptocurrencies.

At the time of writing, LTC is trading at $87.11, up 3.22% in the last day.

Litecoin’s MVRV Has Surged, Why This Is Bearish

On-chain data shows the Litecoin MVRV has been at relatively high levels recently, something that could be bearish for the cryptocurrency.

Both 30-Day & 365-Day Litecoin MVRV Ratios Are High Currently

According to data from the on-chain analytics firm Santiment, LTC traders are well above water at the moment. The “MVRV ratio” is an indicator that measures the ratio between the two main capitalization models for Litecoin: the market cap and the realized cap.

The market cap here is the usual cap that calculates the total value of the asset by simply taking the value of each coin in the circulating supply the same as the current spot price.

The realized cap, however, is a more special model as it assumes that the actual value of any coin in circulation is the price at which it was last transacted on the blockchain.

Since this model aims to estimate a sort of “true value” for Litecoin, its comparison with the market cap (that is, the spot price) in the MVRV can tell us whether the asset’s price is fair or not right now.

When the MVRV has a value greater than 1, it means the market cap is above the realized cap currently. During such times, the average investor is in a state of profit, so the incentive to sell for them increases. As such, the cryptocurrency could be considered overpriced in these conditions.

On the other hand,  the indicator having a value lower than this threshold implies the average holder is in a loss, and hence, the asset may be undervalued currently.

Now, here is a chart that shows the trend in the 30-day and 365-day moving averages (MAs) of the Litecoin MVRV ratio over the last few months:

Litecoin MVRV ratio

As displayed in the above graph, both the 30-day and 365-day MAs of Litecoin MVRV have risen above the baseline with the recent surge in the price beyond the $90 level. This may mean that the cryptocurrency could have become slightly overpriced.

Prior to this surge, when LTC had been visiting some lows, the 30-day version of the indicator had temporarily entered into the undervalued region. Coinciding with these values of the metric, the price formed its bottom and eventually built up towards the current surge.

Back in April, the MVRV MAs showed a similar behavior as right now, as they touched relatively high values when the asset had rallied above the $100 mark. The rally stopped before long in those overvalued conditions, and the asset took a plunge.

If a similar pattern as back then also follows with the current overpriced values of the indicator, then Litecoin may go on to observe a correction in the near future.

In the long term, however, the outlook of the asset could still remain bullish, as the much-awaited halving event, where the cryptocurrency’s block rewards will be permanently cut in half, will take place in August, which is just around the corner now.

LTC Price

At the time of writing, Litecoin is trading around $91, up 1% in the last week.

Litecoin Price Chart

Litecoin Price Prediction: LTC Could Surge 10% If It Clears This Resistance

Litecoin price is attempting an upside break above $93 against the US Dollar. LTC could rally if it clears the $93 and $95 resistance levels.

  • Litecoin is slowly moving higher toward $95 against the US Dollar.
  • The price is now trading above $90 and the 100 simple moving average (4 hours).
  • There is a key contracting triangle forming with resistance near $92.50 on the 4-hour chart of the LTC/USD pair (data feed from Kraken).
  • The price could rally toward the $100 and $105 levels.

Litecoin Price Eyes Upside Break

After a steady increase, Litecoin’s price struggled near the $95 resistance against the US Dollar. LTC price started a downside correction and traded below the $92 level.

The price tested the 23.6% Fib retracement level of the upward move from the $5.26 swing low to the $95.00 high. However, the bulls seem to be protecting a downside break, unlike Bitcoin and Ethereum. Litecoin is now consolidating above the $90 level.

It is trading above $90 and the 100 simple moving average (4 hours). There is also a key contracting triangle forming with resistance near $92.50 on the 4-hour chart of the LTC/USD pair.

Litecoin Price Prediction

Source: LTCUSD on TradingView.com

On the upside, immediate resistance is near the $93 zone. The next major resistance is near the $95 level. If there is a clear break above the $95 resistance, the price could start another strong increase. In the stated case, the price is likely to continue higher toward the $100 and $105 levels. Any more gains might send LTC’s price toward the $112 resistance zone.

Fresh Decline in LTC?

If Litecoin price fails to clear the $95 resistance level, there could be a fresh decline. Initial support on the downside is near the $91 level and the triangle lower trend line.

The next major support is forming near the $85 level or the 50% Fib retracement level of the upward move from the $5.26 swing low to the $95.00 high, below which there is a risk of a move toward the $80 support. Any further losses may perhaps send the price toward the $75 support.

Technical indicators:

4-hour MACD – The MACD is now gaining pace in the bullish zone.

4-hour RSI (Relative Strength Index) – The RSI for LTC/USD is above the 50 level.

Major Support Levels – $91.00 followed by $85.00.

Major Resistance Levels – $93.00 and $95.00.

Litecoin Surpasses $90, But This Level Remains Crucial For The Altcoin

Despite the prevailing selling pressure in the cryptocurrency market, Litecoin has emerged as a standout performer. While the past 24 hours have not witnessed significant movement in the LTC price, the weekly chart reveals an appreciation of nearly 4%.

A significant breakthrough occurred as Litecoin surpassed the crucial $90 price level, signaling a positive shift in its price. Technical analysis suggests that the bulls hold sway over the price action, with demand and accumulation indicators displaying positive signals on the daily chart.

Most altcoins, including Litecoin, have exhibited similar price patterns influenced by the fluctuations of Bitcoin. Therefore, sustaining the LTC price above the $90 mark will depend on the overall strength of the broader market. Should Bitcoin reclaim the $27,000 zone, it could pave the way for Litecoin to overcome its significant overhead resistance in subsequent trading sessions.

While buyers of LTC currently maintain a favorable position, it is important to note that a slight push from the bears could potentially drive the price below $90, prompting bearish activity. However, the increased market capitalization of Litecoin in the recent session suggests that buyers are currently in control.

Litecoin Price Analysis: One-Day Chart

Litecoin

At the time of writing, Litecoin (LTC) was valued at $91.02. The altcoin’s successful move above the $90 threshold has strengthened the bulls, who are now pushing prices even higher.

However, a formidable barrier stands at $92.8. Surmounting this resistance level could potentially propel LTC toward the $97 mark.

Conversely, declining the current price level would push the altcoin below $90. Should this occur, support might be found at around $86. The recent session’s trading volume of LTC was positive (green), indicating a growing demand for the coin.

Technical Analysis

Litecoin

Buyers have displayed consistent confidence in Litecoin (LTC) as the asset’s price has improved. This positive sentiment is reflected in the Relative Strength Index (RSI), positioned above the half-line and just below the 60 mark.

This indicates more buyers than sellers, reinforcing the optimistic outlook. Moreover, LTC’s price remains above the 20-Simple Moving Average (SMA) line, indicating that buyers are driving the market’s momentum.

Additionally, LTC has managed to stay above the 50-SMA (yellow) and the 200-SMA (green) lines, pointing towards increased demand for the asset.

Litecoin

Litecoin (LTC) demonstrated buy signals alongside other technical indicators, suggesting favorable market conditions. The Moving Average Convergence Divergence (MACD) revealed the formation of green signal bars, indicating positive momentum and a bullish trend.

Furthermore, the Bollinger Bands, a volatility indicator, displayed wide bands, indicating increased price volatility and fluctuation. This implies that LTC is unlikely to trade within a narrow price range, as there is potential for significant price swings.

Why Litecoin Is The Most Undervalued Asset in Crypto

Litecoin momentum is potentially changing, network usage is skyrocketing, and the cryptocurrency’s halving is ahead.

Yet the asset remains drastically undervalued relative to Bitcoin, Ethereum, and other factors. Here is a closer look at why Litecoin could be the most undervalued asset in crypto.

LTC Vs BTC Vs ETH Compared

Litecoin was once a top ten or higher cryptocurrency that has since fallen from that lofty pedestal. A nine-month-long up-only bull run and more than 10,000% ROI left the coin ranging for going on its fifth full year.

Unlike other top coins like Bitcoin and Ethereum, LTC never made dramatic new all-time highs in 2021. On some exchanges, the record high is still set for 2017. After the 2017 bull market peak, Litecoin has lagged behind the two largest coins by market cap.

But this is common in the final stages of a bull market, after which Litecoin wildly outperforms both BTC and ETH in a flash. That sort of situation could return, according to the charts below, starting with the below comparison of LTC versus Bitcoin and Ether.

litecoin LTCUSD_2023-05-16_07-26-44

Crypto Market Moment Ready To Change

Another sign that LTC is due to outperform the market can be found in the one-month LMACD crossing bullish. The signal is at least a two months ahead of Bitcoin and Ether and suggests a larger move in Litecoin first.

According to Investopedia, momentum “refers to the inertia of a price trend to continue either rising or falling for a particular length of time.” The LMACD is a momentum measuring tool, and it could be indicating that Litecoin’s inertia just made a major swing in the positive direction.

litecoin LTCUSD_2023-05-16_07-31-23

Litecoin Elliott Wave And The Final Advance

Litecoin technicals, according to Elliott Wave Principle, could also point to much higher prices. The current wave count and Fibonacci retracement levels are characteristic of an expanding diagonal pattern.

These patterns appear at the beginning or the end of a motive wave. Considering the larger wave count, this would suggest an ending expanding diagonal and perhaps the last major rally in Litecoin in some time.

LTCUSD_2023-05-16_07-37-24

LTC Fundamentals Support Soaring Higher

Finally, LTC transactions are currently skyrocketing. From a fundamental perspective, this is as bullish as it gets for any cryptocurrency. Litecoin is benefiting from an explosion of ordinals on the LTC-20 standard, congestion on Bitcoin and Ethereum, and more.

LTCUSD_2023-05-16_08-05-19

Essentially, the Litecoin ecosystem is booming again. When network usage skyrockets, LTCUSD spikes in price. We also have yet to mention Litecoin’s halving, which is less than 80 days away.