The latest on-chain data shows that Litecoin (LTC) whales have been increasingly active in the market in recent weeks. The question is — can they push the altcoin’s price comeback?
Litecoin Whale Activity Ignites
In a new post on the X platform, on-chain analytics firm Santiment revealed a sustained increase in whale activity on Litecoin. The relevant indicator here is the whale transaction count metric, which tracks the number of whale transactions (worth more than $100,000) executed on a blockchain network per day.
Whales refer to entities that hold a large amount of a particular cryptocurrency and have significant influence over the market due to the size of their holdings. Whale behavior and activity are often scrutinized and analyzed, as they can provide insight into market dynamics and potential price movements.
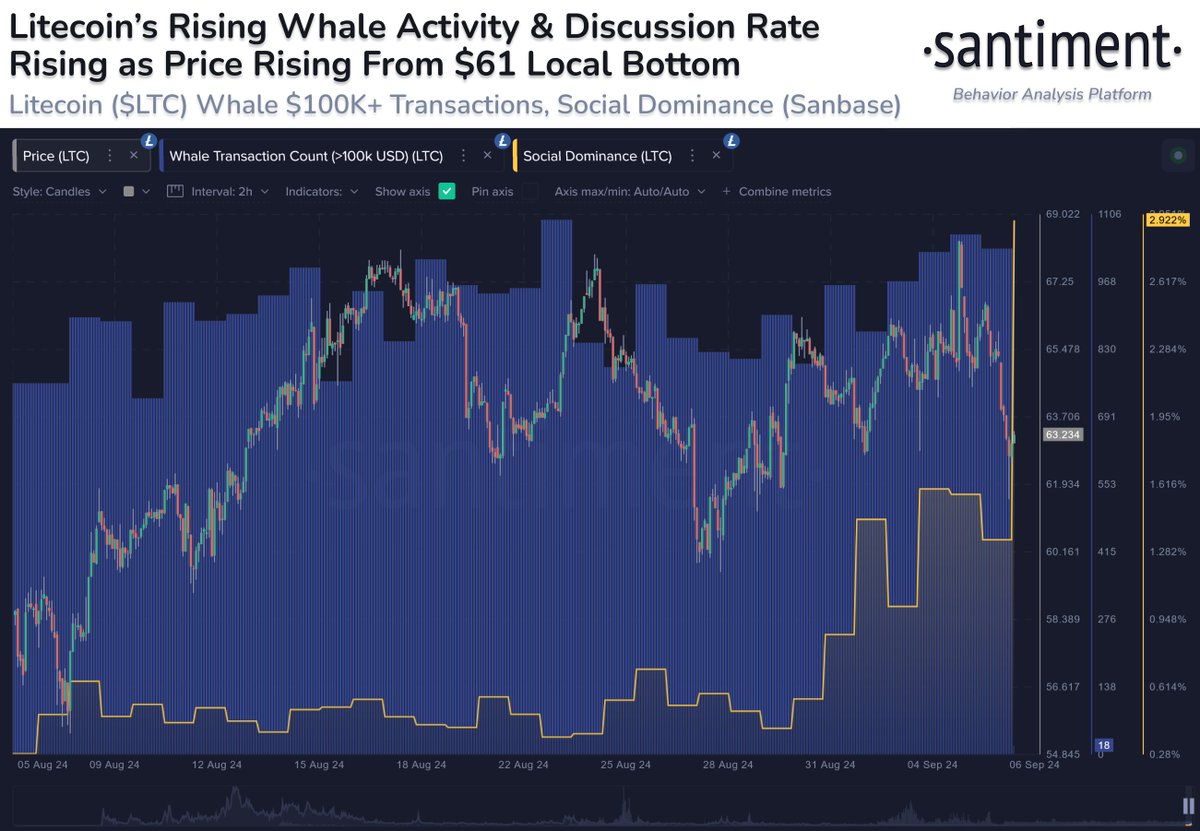
According to Santiment, the number of Litecoin transactions worth more than $100,000 has been on the rise since late August. Typically, an increase in this metric suggests that whale activity is increasing on the Litecoin network, which could be a bullish catalyst for the LTC price.
It is worth noting, though, that the increase in the whale transaction count could mean either accumulation or distribution. If LTC whales are loading their bags, it could indicate an impending price growth. On the flip side, a sell-off by the large holders could put Litecoin’s price at risk.
Moreover, the altcoin seems to be on the lips of most members of the crypto community, as its social dominance has also been climbing. The social dominance metric reflects the share of discussion in crypto media that pertains to a particular coin/token or phrase.
This metric relies on social volume, which measures the total number of social posts that contain a particular crypto subject. The social dominance for an asset compares its social volume to the combined social volume of the 100 largest assets by market capitalization.
The recent uptick in whale activity and social discussions could signal an imminent price breakout for Litecoin. “Whether or not you are a fan of LTC, this is worth keeping an eye on,” Santiment said in its post.
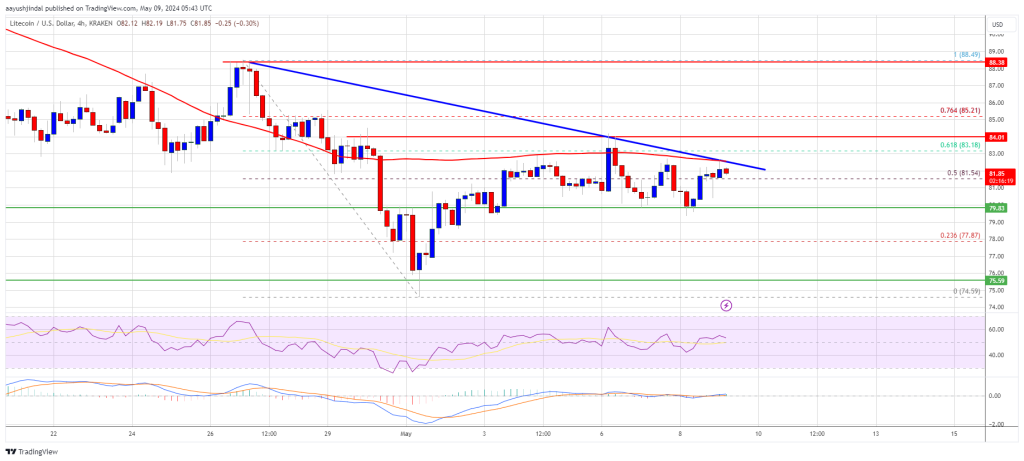
LTC Price At A Glance
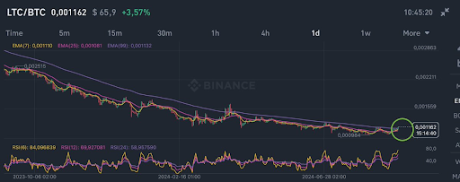
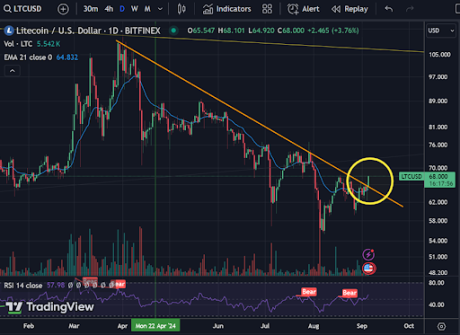
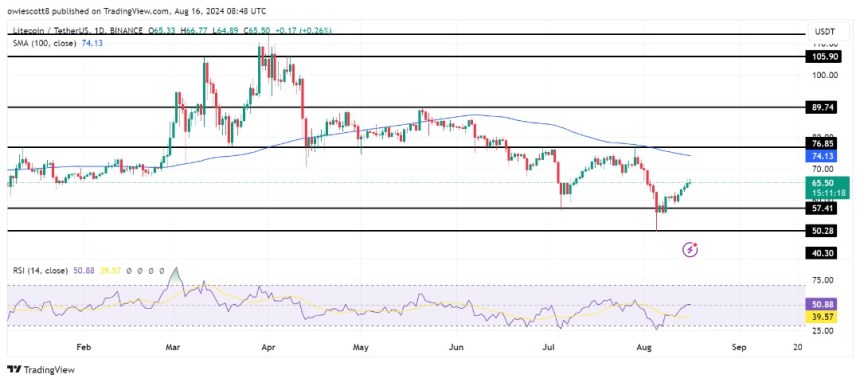
As of this writing, the price of Litecoin stands around $62, reflecting a 1.5% decline in the past 24 hours. According to data from CoinGecko, the altcoin is down by nearly 5% in the past week.
 Source:
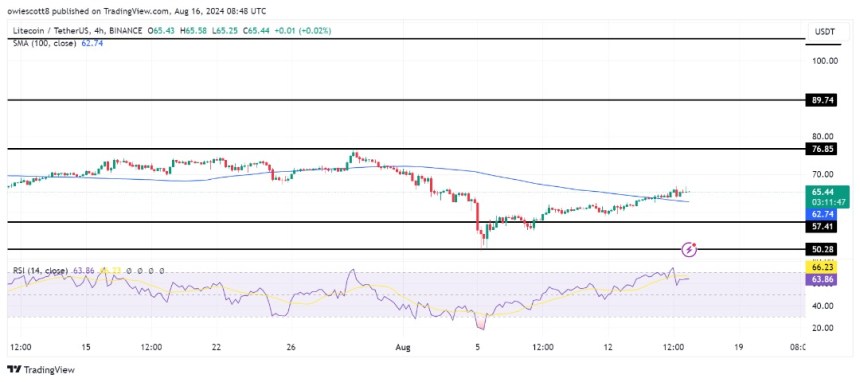


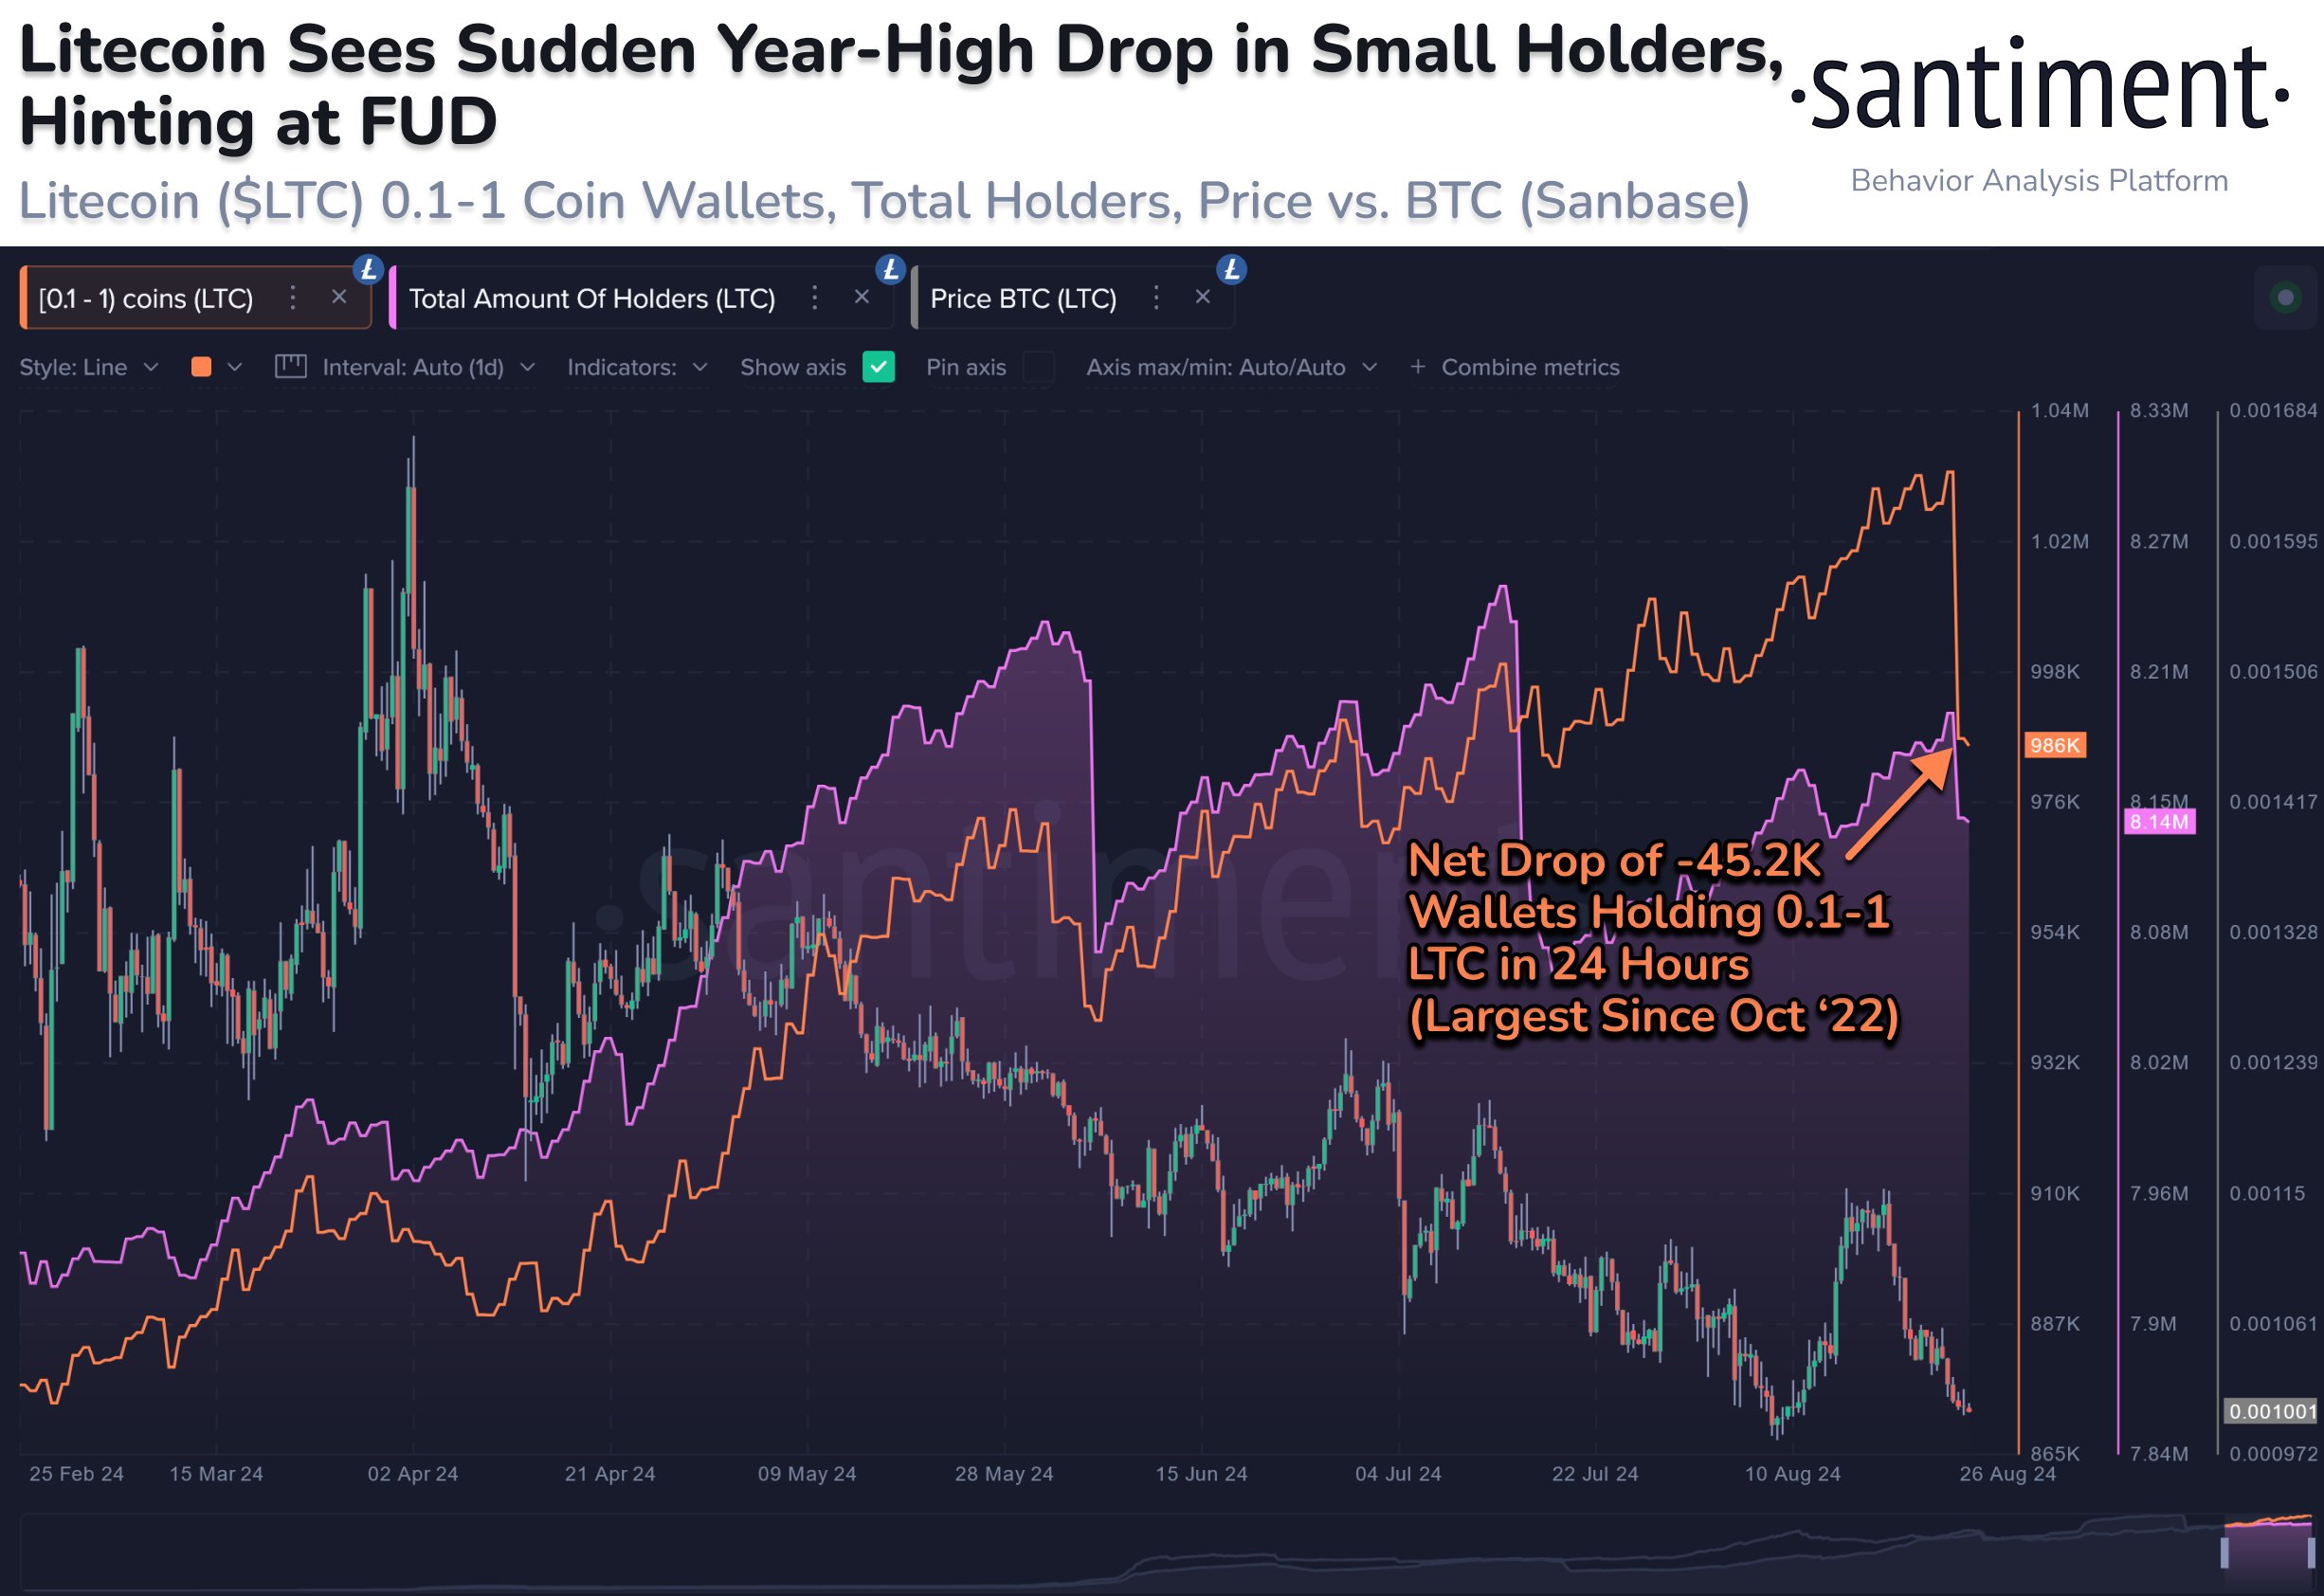
 The network now counts over 5 million long-term holders of
  This figure represents 62.5% of all Litecoin addresses with a balance.
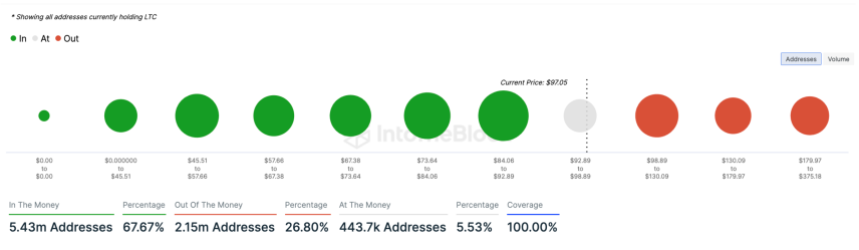
 SCOOP (with fixed ticker)
  : Hearing rumblings on the institutional level about possible interest in a Litecoin ETF. The logic is that because of