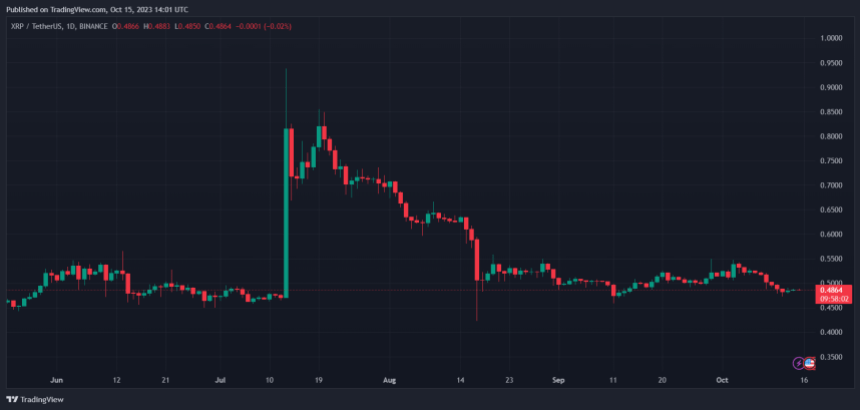
Crypto Analyst Says XRP Price Has Entered Markup Phase, Why This Is Important

The XRP price is still in an incredibly bullish position despite the recent pullback and the general sentiment in the community matches this bullishness. One crypto analyst explains the current trend as the altcoin having entered what is referred to as a “markup phase.”

XRP Price Leaves Accumulation To Markup Phase

Crypto analyst and trade The Signalyst took to TradingView to share an interesting phase that the XRP price had entered. Using a chart, the crypto analyst outlined where the altcoin’s price had been in the past, where it is now, and where it is headed using distinct terms.

The first phase outlined in the chart is the markdown phase which took place after the price surge following Ripple’s first victory over the United States Securities and Exchange Commission (SEC) in July. This markdown phase saw the price go from as high as $0.9 to as low as $0.45 when all was said and done.

What came after the markdown phase was complete was the accumulation phase. Here, the XRP price traded in a pretty tight range, offering an opportunity for investors to buy as many coins as possible. During this phase, the price never crossed above $0.55.

XRP price chart from Tradingview.com

Next came the markup phase which is where the XRP price is currently residing. This markup phase is when the price starts to recover. “After breaking above the 0.55 level mentioned in my previous idea, XRP exited the accumulation phase and entered the markup phase,” the analyst said.

This markup phase is important in the fact that it possesses the strength for the XRP price to continue to grow. However, like with any rally, it faces a good measure of resistance from bears who continue to try to pull the price down.

XRP price chart from Tradingview.com (Markup phase)

The most important level for bulls to break in this markup phase, according to the analyst, is $0.7345, from which the price has already been rejected once on Monday. The Signalyst believes that if this level is broken, then bulls can maintain control of the price. The chart suggests a rise as high as $0.8 following a break of this resistance; an event that would cement XRP’s bull rally.

“Meanwhile, XRP could still face rejection at the resistance, which can be confirmed on lower timeframes,” the analyst warned. “In this scenario, a correction towards the 0.55 support level would be anticipated.”

Despite the drawdown, the XRP price is still showing bullishness and a high level of interest from investors. Its daily trading volume is up 32% in the last day, breaking above $3.3 billion. Its price is currently sitting at $0.69, up 1.63% and 21% on the daily and weekly charts, respectively.
XRP Price Surge Imminent? Expert Eyes 1,500% Rally Signal From Past

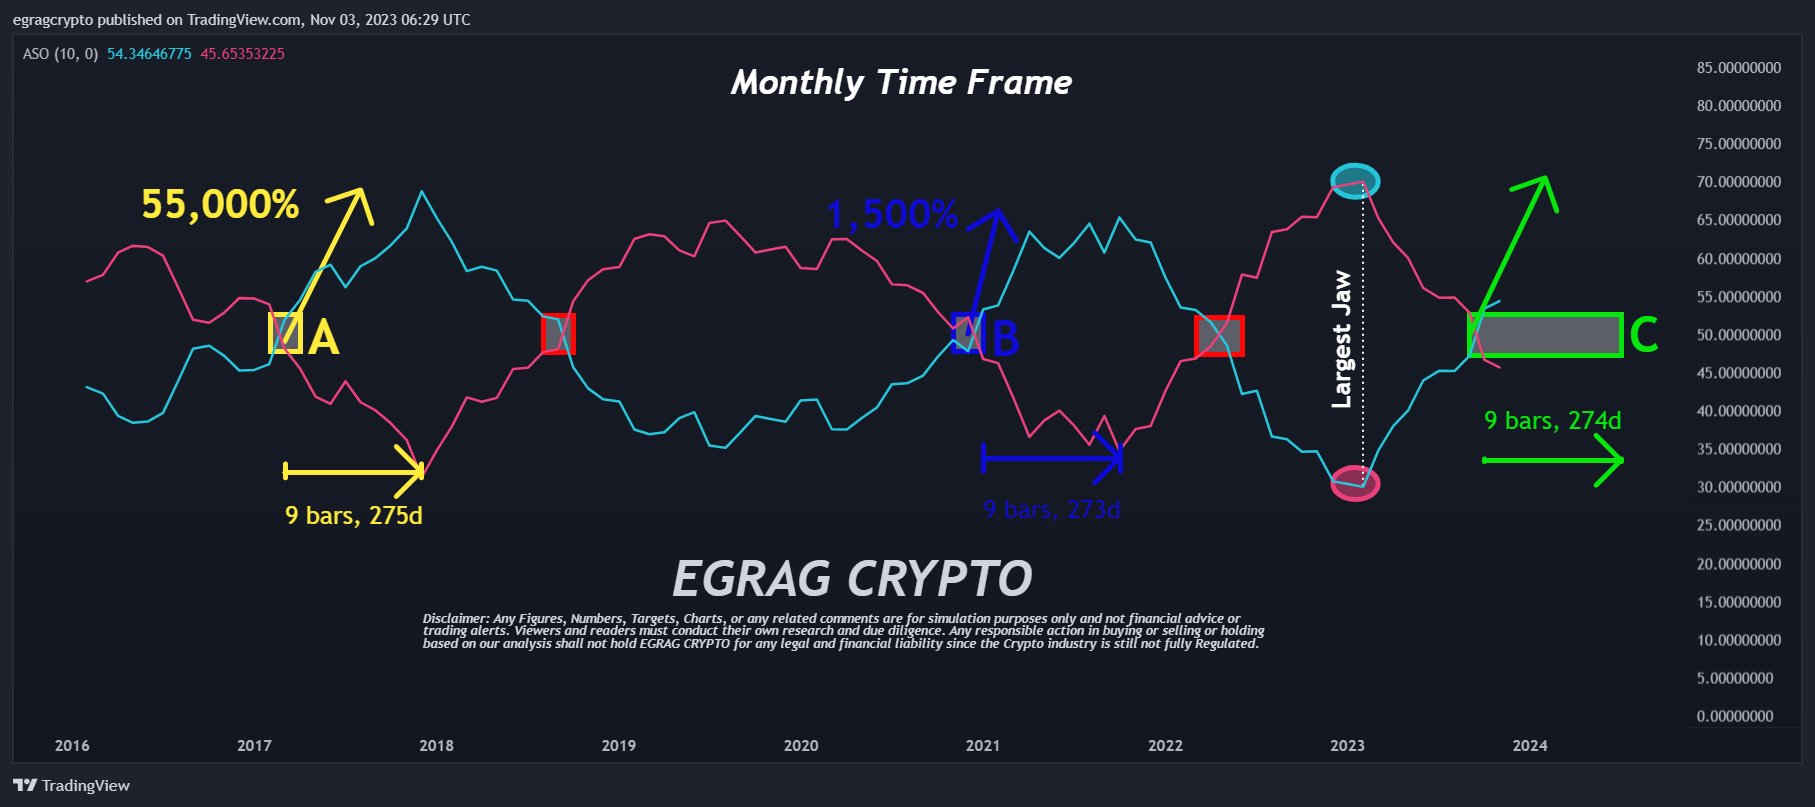
Crypto analyst Egrag recently delved into the XRP price charts and spotlighted signs that suggest a possible rally of more than 1,500% is on the horizon. The focus of this analysis is the ASO (Average Sentiment Oscillator), a metric that traders employ to determine market sentiment.

XRP Price Rally Of 1,500%+ Ahead?

Egrag’s monthly XRP/USD chart showcases the convergence of the blue line, symbolizing bulls, and the red line, representing bears. A month ago, Egrag had marked a yellow box on his chart, predicting the bullish crossover to take place between the end of 2023 or the onset of the latter half of 2024.

Today, Egrag noted, “XRP ASO Update: The journey is only heading UP! I’ve been eagerly awaiting the bullish crossover of the ASO since February 2023. And guess what? It’s finally here!” Should XRP mimic its historical patterns, and if Egrag’s predictions hold true, the XRP price might witness some considerable price movements in the coming months.

Historically, the cryptocurrency experienced this bullish crossover twice before. The 2017 event led to a staggering 55,000% increase in XRP’s price, while the one from late 2020 to April 2021 resulted in a 1,500% appreciation. Given the “largest jaw” ever observed on the chart, Egrag has sparked discussions suggesting that the forthcoming rally could even outpace its predecessors.

XRP price

By connecting the dots from the historical data and the recent crossover, Egrag further elaborated, “Looking at historical data, we can see that it typically takes around 275 days to reach the peak after this event.” If XRP follows its historical trends, as Egrag suggests, the XRP price might be gearing up for some substantial price action within the next 7-10 months.

Ending his tweet on a rallying note for the vast community of supporters, commonly referred to as the ‘XRP Army’, Egrag encouraged, STAY STEADY and keep on wearing your space suit.”

To provide more context, the ASO acts as a momentum oscillator, giving averaged percentages of bull/bear sentiment. It’s particularly potent in discerning sentiment during specific candle periods, assisting in trend identification or pinpointing entry/exit moments. The tool was conceived by Benjamin Joshua Nash and modified from its MT4 version. The oscillator’s design, showcasing Bulls % with a blue line and Bears % with a red line, illuminates the prevailing sentiment in the market.

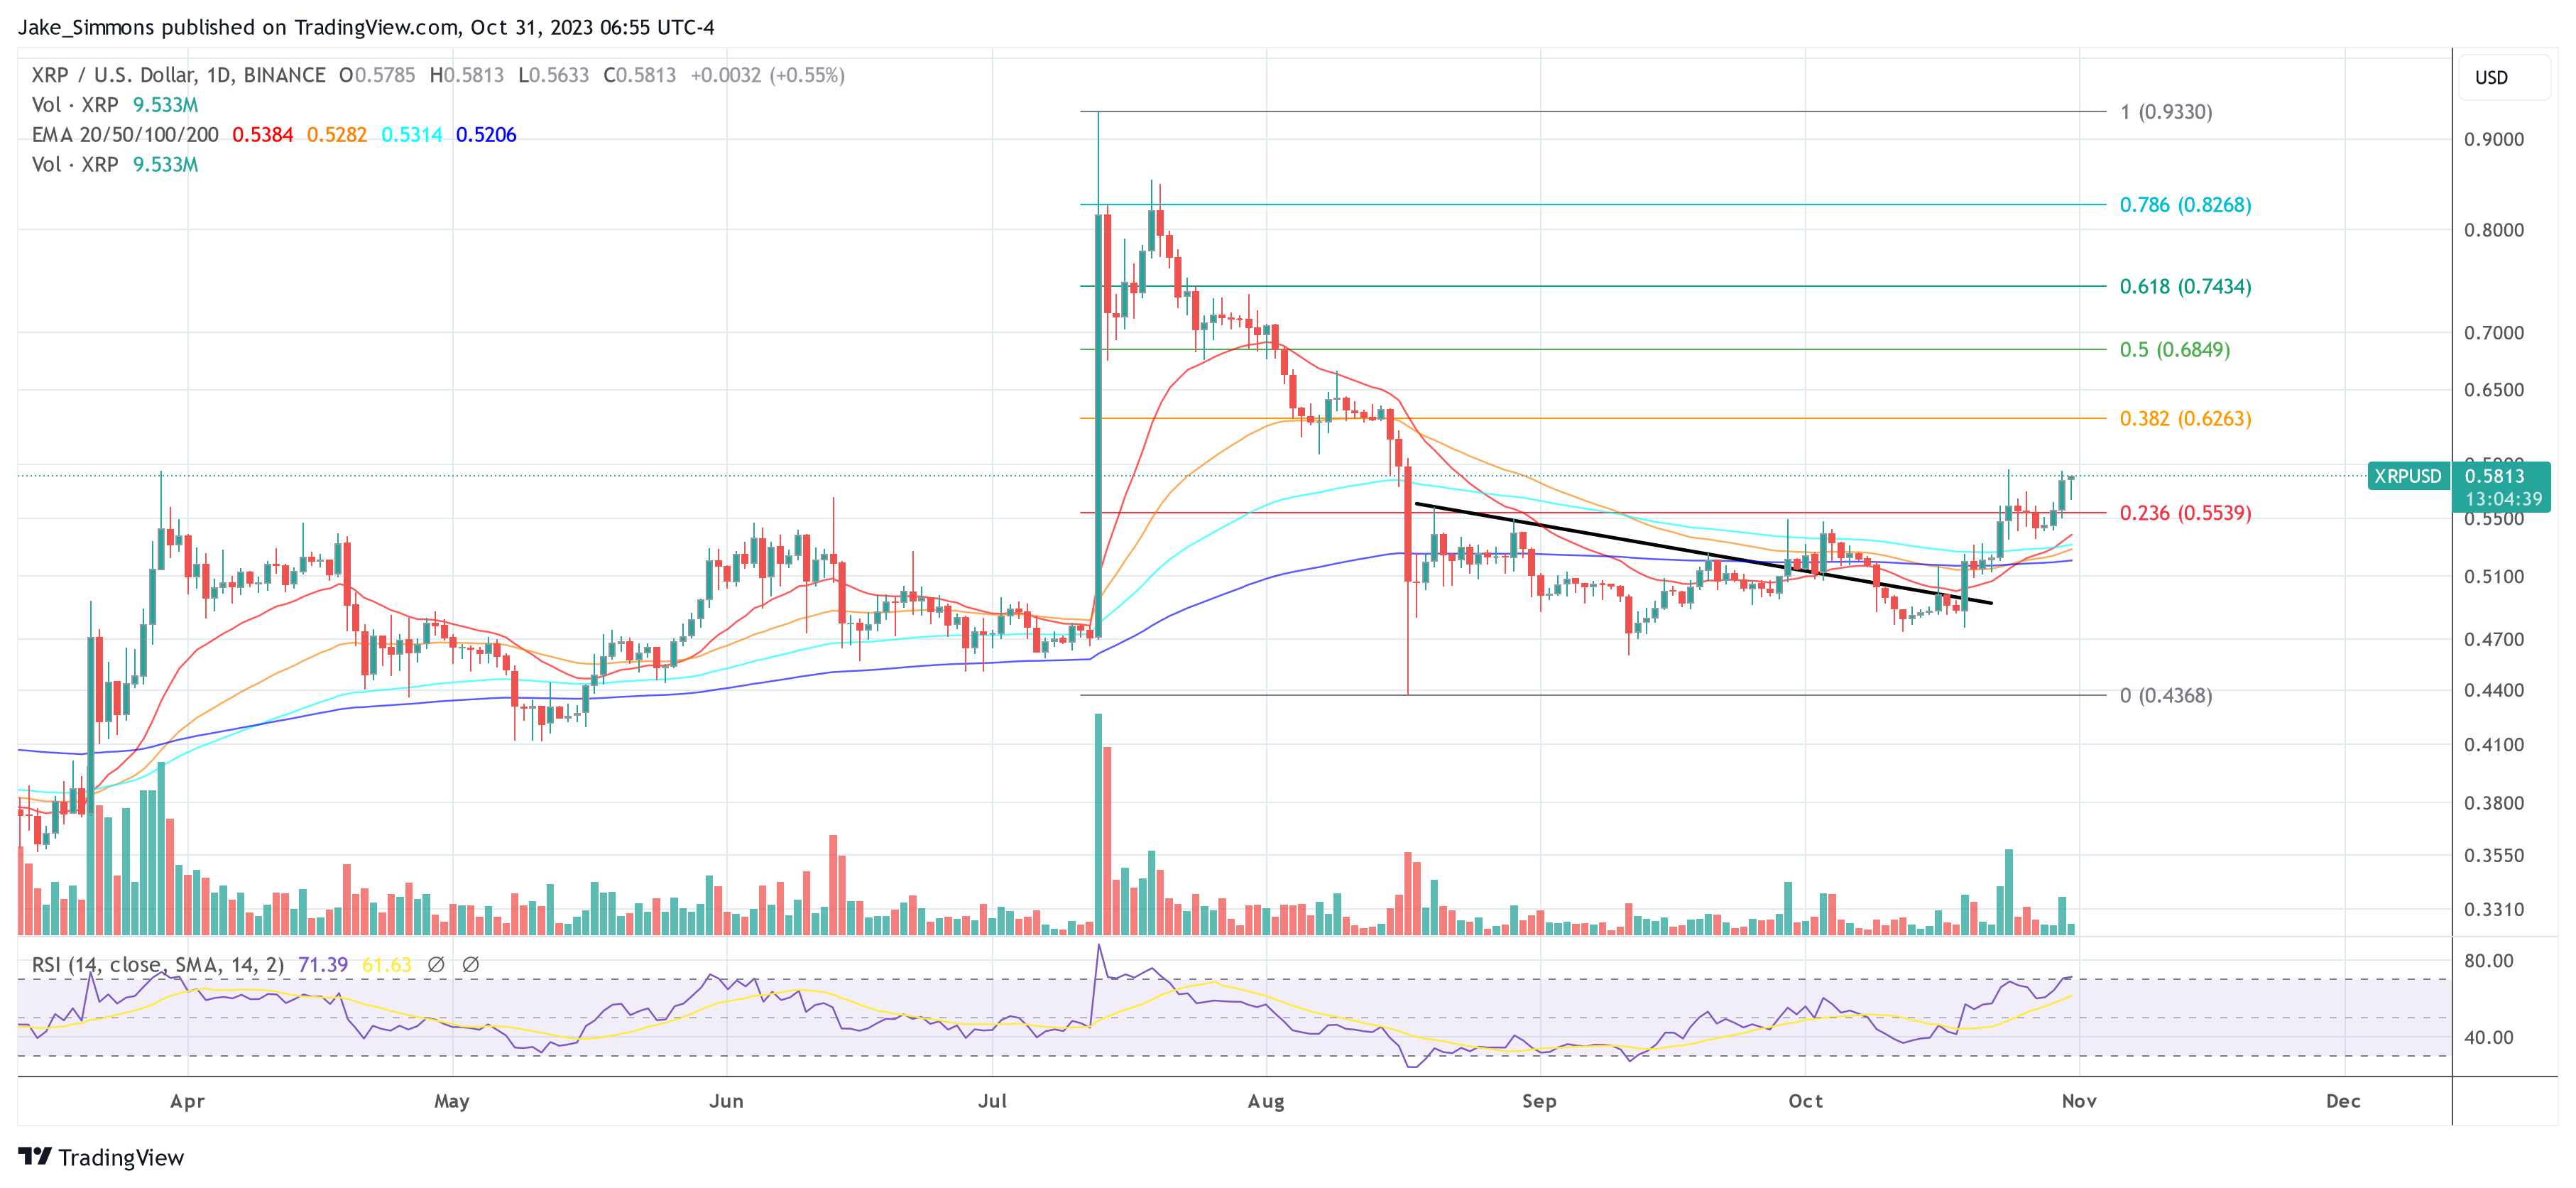
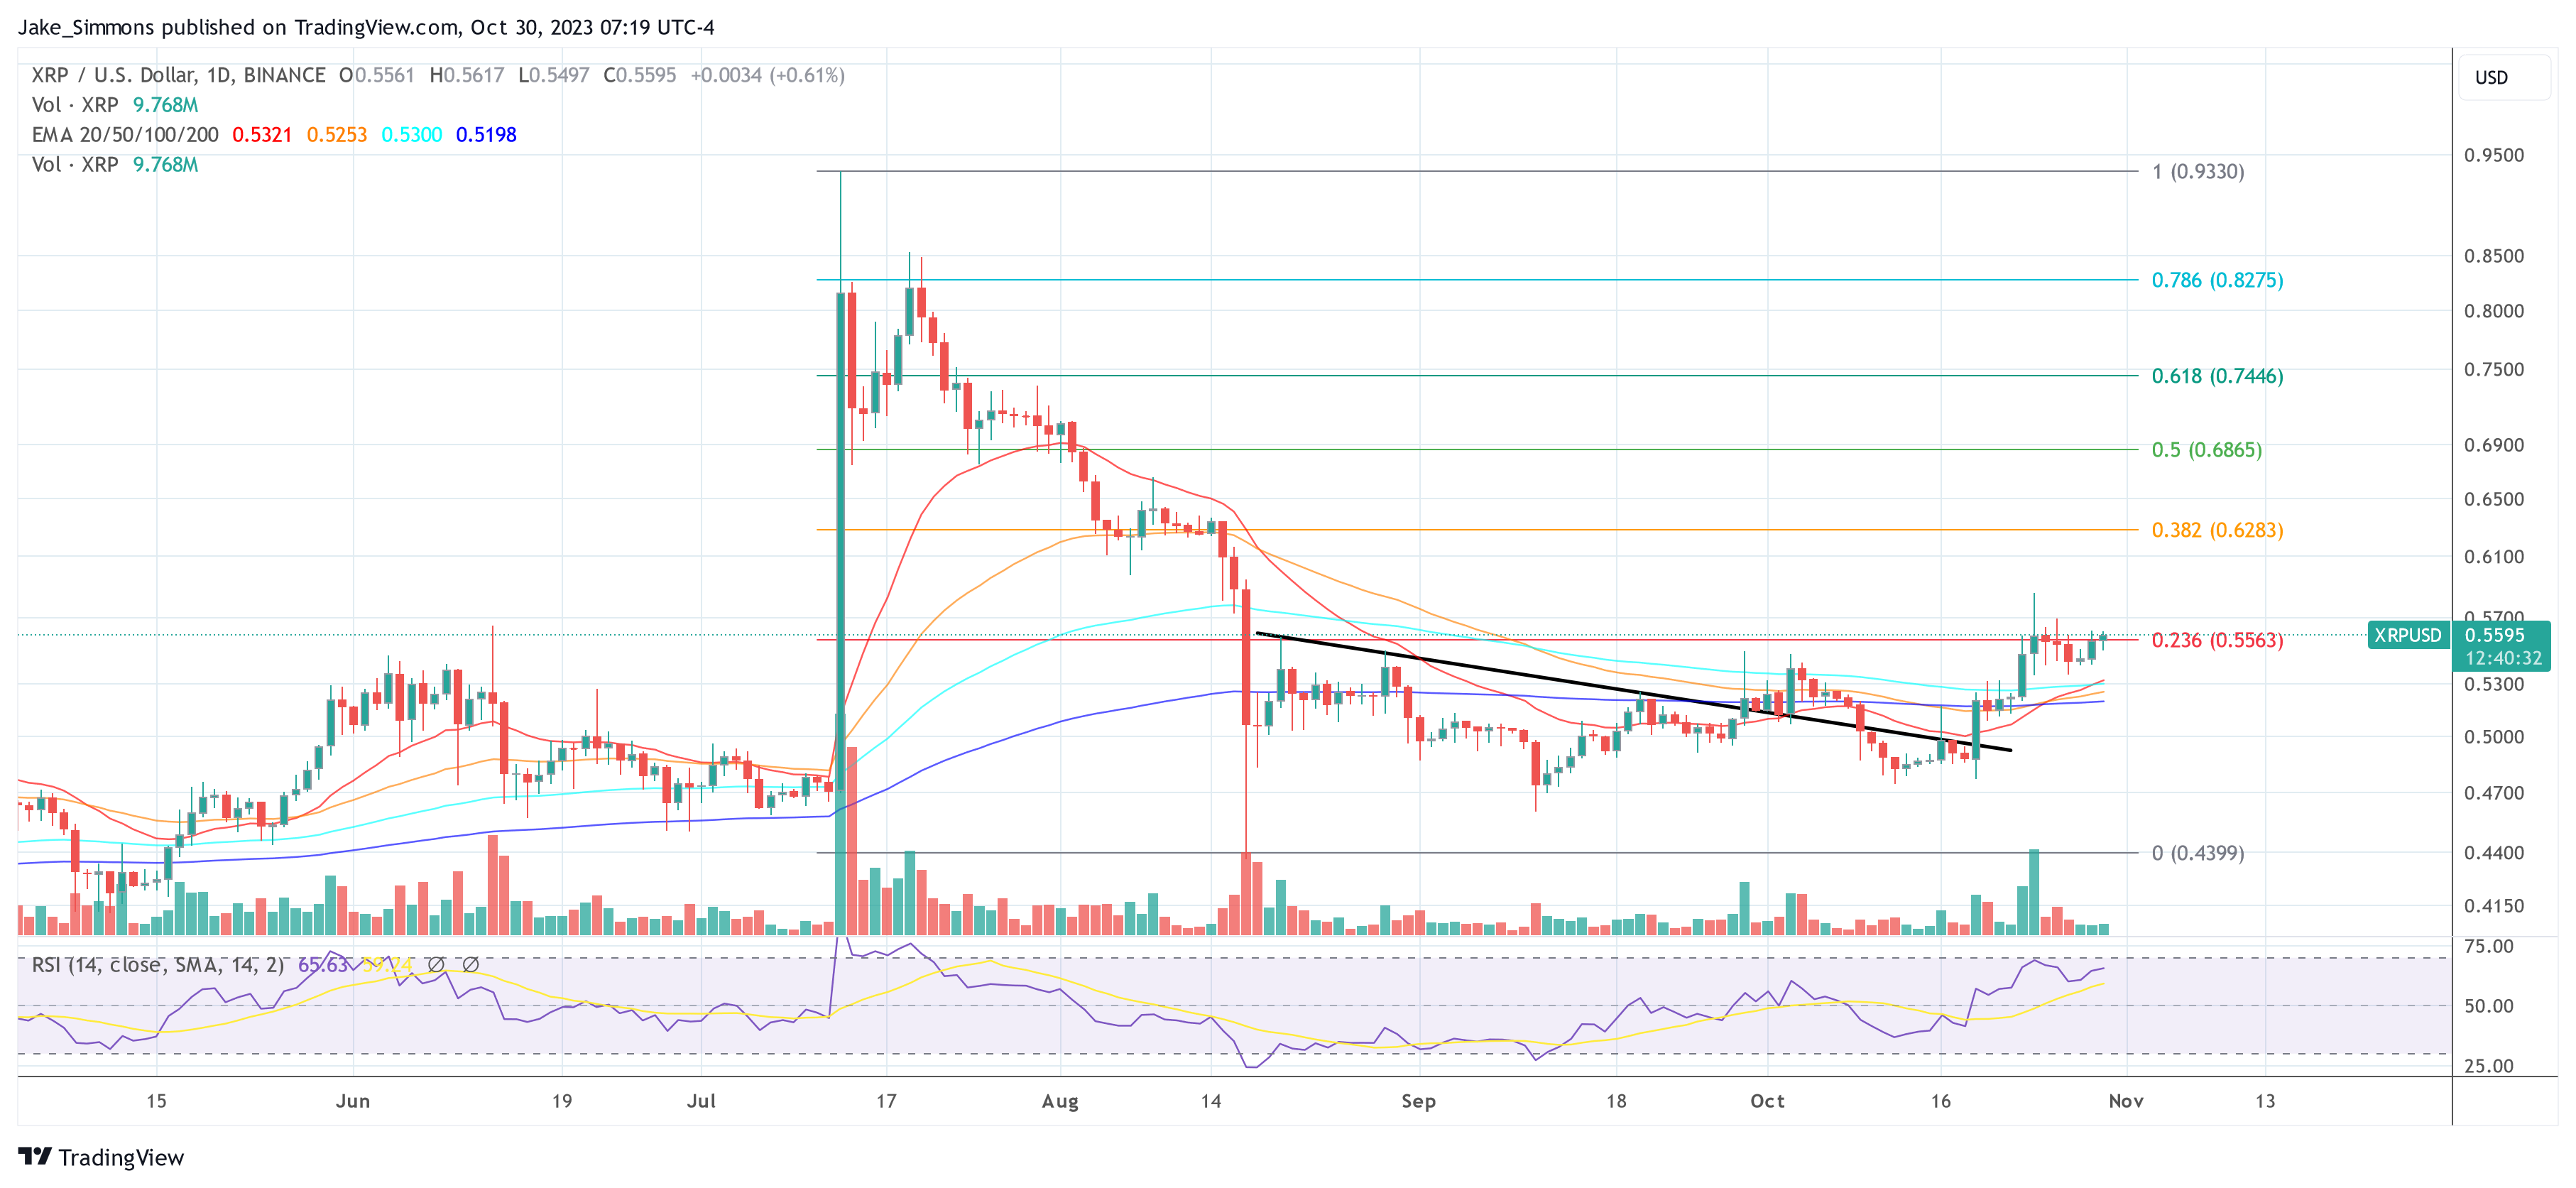
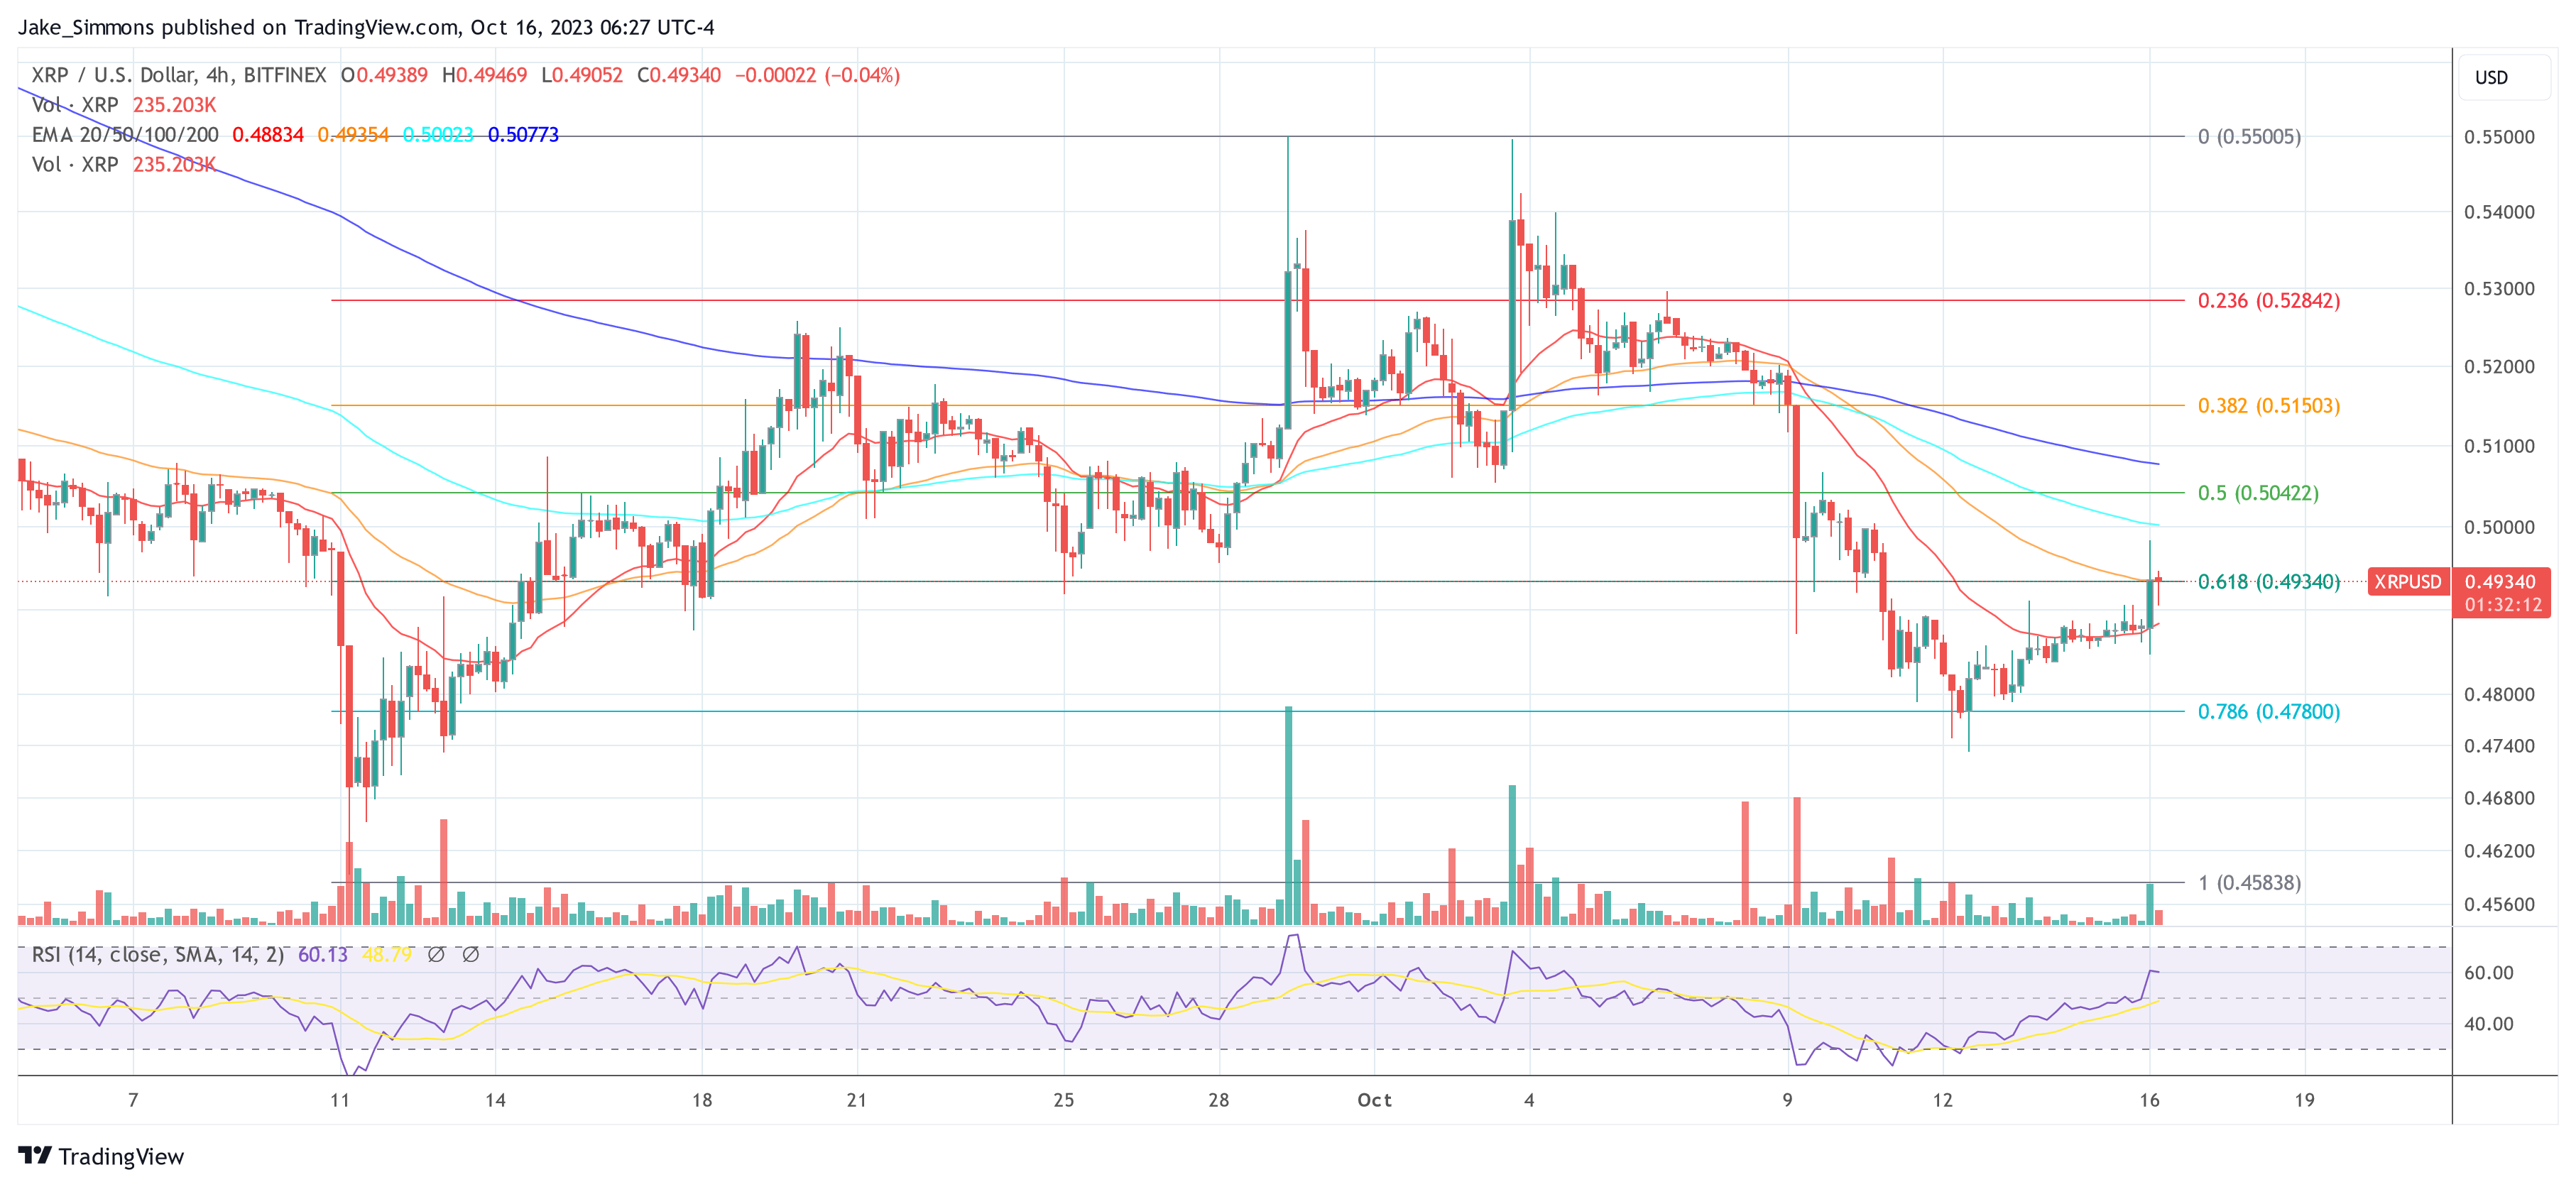
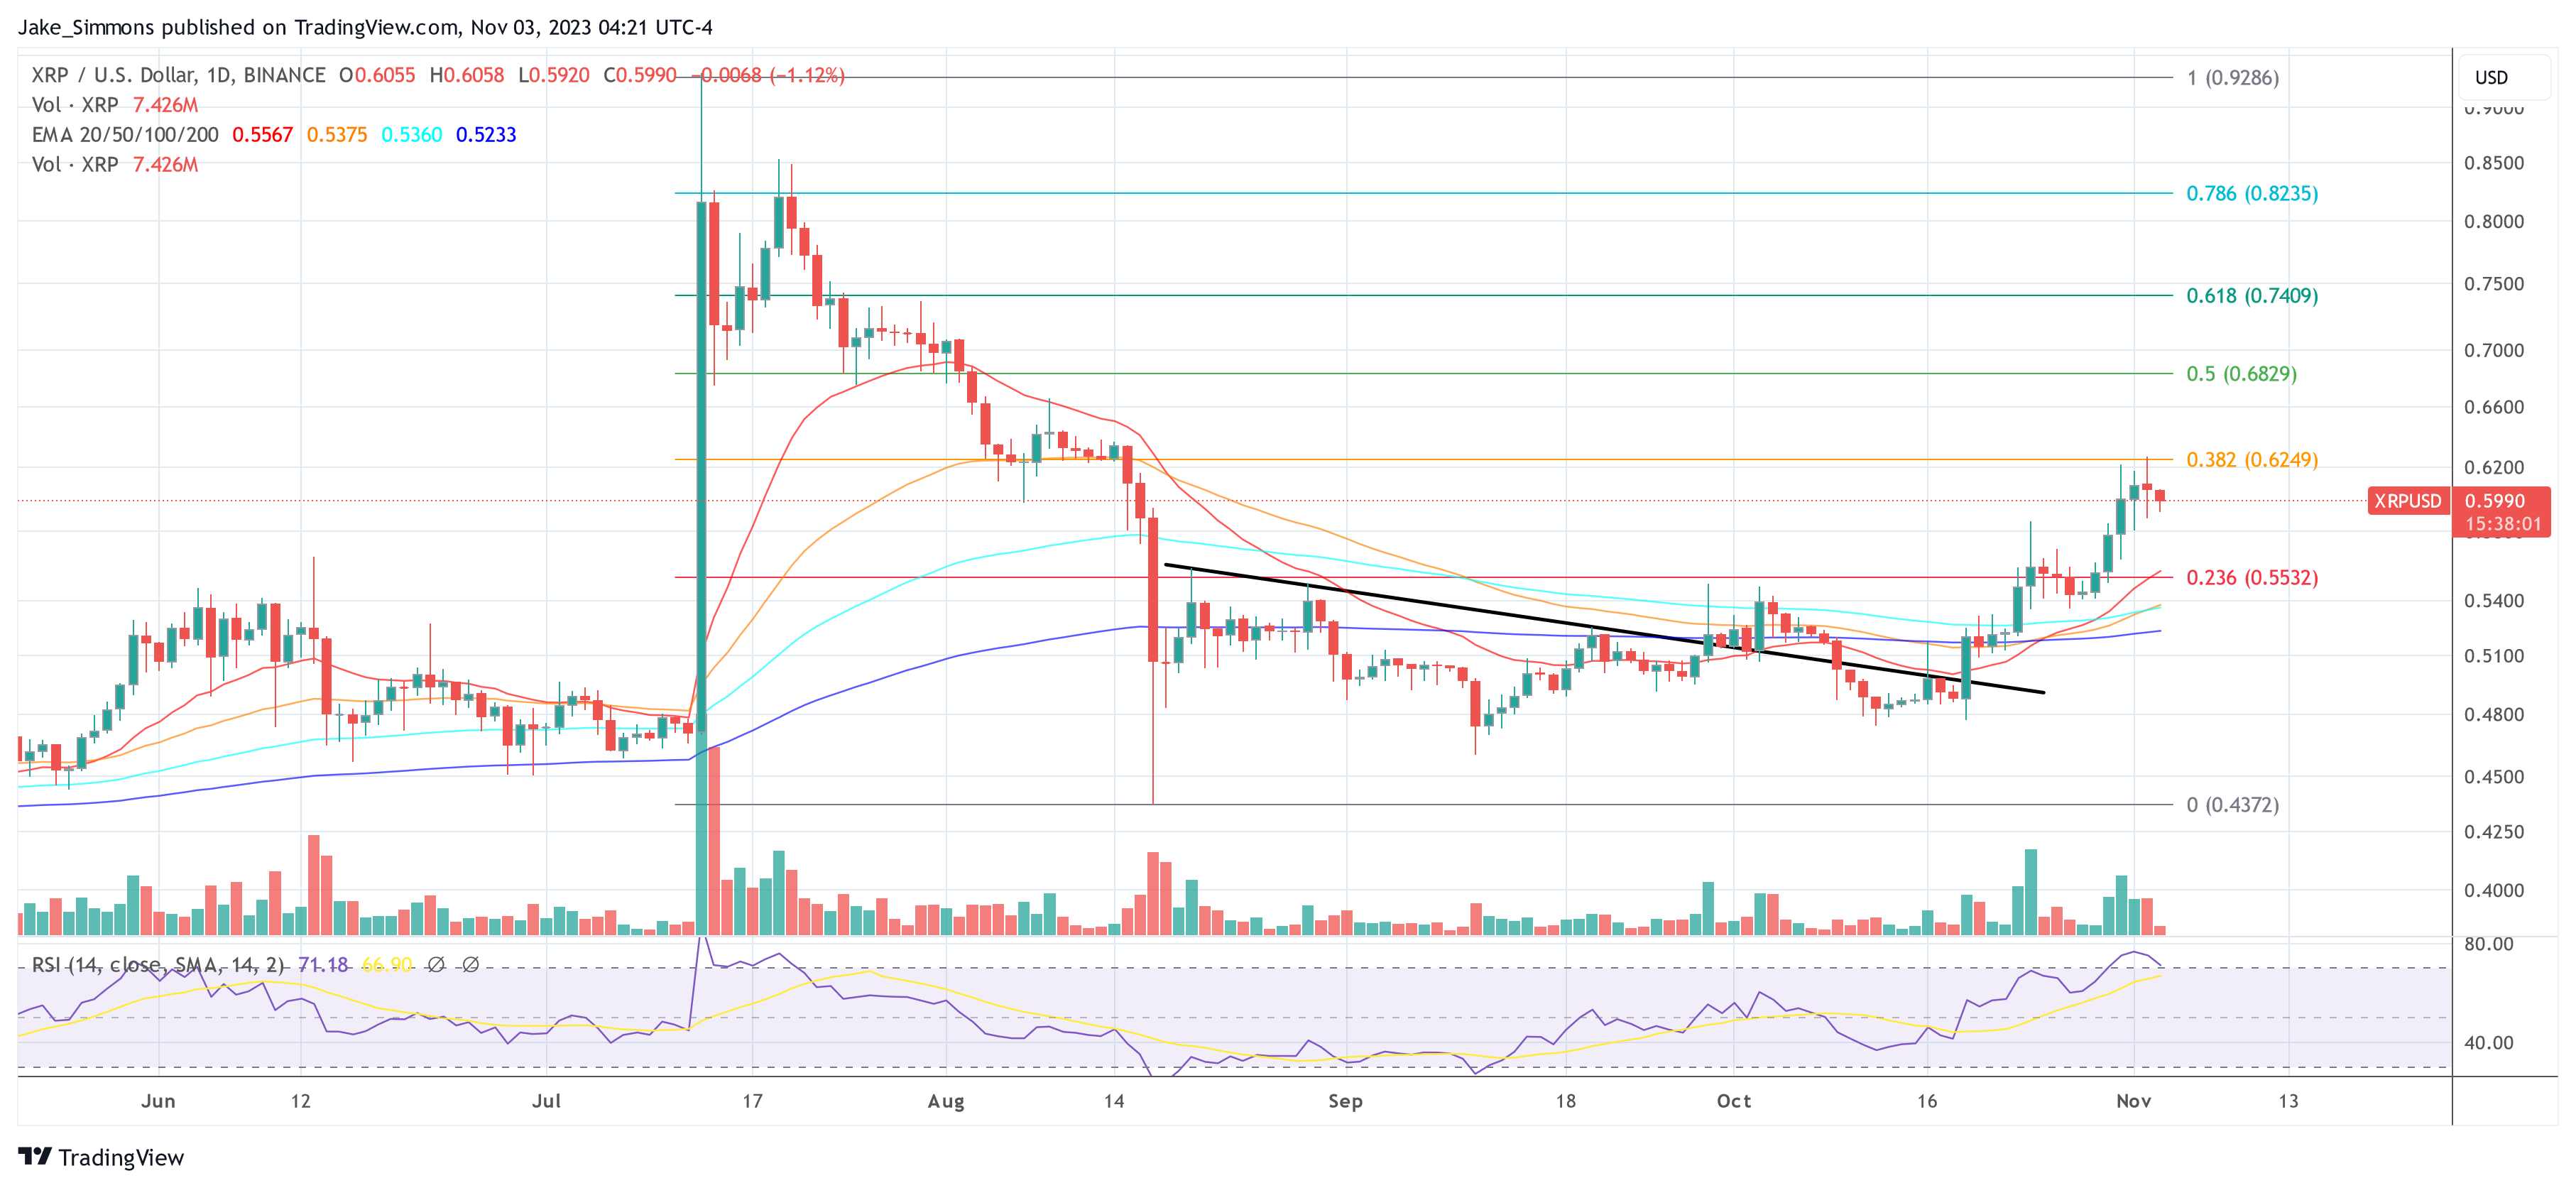
At press time, XRP traded at $0.5990. Upon examining the 1-day chart, it’s evident that the XRP price faced a second rejection at the 0.382 Fibonacci retracement level, which stands at $0.625.

Although the RSI has settled somewhat, it remains elevated in the overbought zone at 71. This suggests that the price might gear up for another shot at overcoming this resistance. However, if it doesn’t succeed, a pullback to the 0.236 Fibonacci retracement level, priced at $0.553, may be on the horizon. On the upside, the 0.5 Fibonacci retracement level, pegged at $0.683, represents the next potential price target.

XRP price

Ripple Transfers 800 Million XRP Back To Escrow: Catalyst For Price Rally?

Recent financial maneuvers by Ripple Labs have caught the eye of crypto sleuths again. Recent data from crypto data analysis platform Whale Alert has shown a significant movement of 800 million XRP tokens back into Ripple’s established escrow system. This move comes in the aftermath of Ripple’s customary monthly unlocking of one billion XRP, a practice that started in 2017 as part of the company’s strategy to maintain XRP price stability.

Ripple Returns 800 Million XRP To Escrow

The essence of Ripple’s escrow mechanism is to facilitate a consistent and predictable distribution of XRP to the market. This counteracts any potential price volatility that might arise from a sudden influx of tokens. In its commitment to this cause, Ripple, back in 2017, pledged to gradually release 55 billion XRP in 55 monthly tranches of one billion XRP each.

Post-release each month, Ripple typically returns a majority of the tokens, mostly 800 million XRP, back into the escrow, retaining a minor portion, around 200 million XRP, for market circulation. Recent data from Whale Alert confirms that Ripple was no exception this month and has locked 800 million XRP tokens back into the established escrow system.

Notably, the return of the 800 million XRP tokens occurred in two equal transactions, each involving 400 million XRP. Delving into the data from XRP Scan reveals that the first set, amounting to 400 million XRP, was directed back into escrow from an address known as ‘Ripple 10.’ Prior to this, ‘Ripple 10’ had received the said tokens from two different addresses: Ripple 22 and Ripple 23.

The subsequent batch of 400 million XRP was transacted from ‘Ripple 23’ to another address dubbed ‘Ripple 11,’ before it was also directed to the company’s escrow account. The market value of the re-locked 800 million XRP stood at an approximate $480 million during the time of these transactions.

Of the original 1 billion XRP that were made available, the remaining 200 million XRP, with a current valuation of about $121 million, was moved from Ripple 22 to Ripple 1. This balance is anticipated to facilitate Ripple’s operational expenses and other business-related activities.

Ripple’s escrow holdings now total roughly 40.9 billion XRP. For context, their Q3 report disclosed that they had about 41.3 billion XRP in escrow at the end of September.

XRP Price Poised For More Upside

After XRP broke the 200-day Exponential Moving Average (EMA) line (blue) on October 21, the price has been on a tear. Within 11 days, the XRP price increased by almost 20%. That the XRP price took a breather from its rally yesterday is probably not due to Ripple’s monthly transfer from escrow, as the XRP tokens do not hit the market immediately and, moreover, investors know how to gauge the issue.

A better explanation is that XRP encountered a strong resistance with the 0.386 Fibonacci retracement level at $0.625, where the price was rejected in a first attempt. Notably, the bulls could make another attempt if the price stays above the $0.60 level.

If the breakout succeeds, the 0.5 Fibonacci retracement level at $0.683 could be the next short-term price target. However, if the XRP price is rejected again at $0.625, a retest of the 0.236 Fibonacci retracement level at $0.553 could be the next logical move.

XRP price

XRP Price Prediction: Crypto Analyst Says Price Will Jump To $0.9

XRP price predictions continue to make the rounds, and one of the latest price predictions happens to be that of prominent crypto analyst CrediBULL Crypto, who recently gave a comprehensive analysis of the token’s future trajectory

How XRP Price Could Rise To $0.9

In a post shared on his X (formerly Twitter) platform, the crypto analyst highlighted that while analyzing the XRP/USD chart, the fact that XRP is currently enjoying an upward trend, but that could soon come to an end as it faces a resistance level at around the price range of $0.63. 

He was, however, quick to alleviate any fear of a potential dump as he noted that the rejection doesn’t necessarily translate to a massive dump down but could simply mean a consolidation around that price range.  

He also sounded optimistic when he stated that there is a “decent chance” that the XRP price breaks that resistance level, which, if it does, could see the token rise to as high as $0.9. He didn’t, however, provide a timeframe for when this could happen, as he mentioned that XRP holders might have to be patient. 

On the bright side, XRP’s fundamentals are looking stronger, especially with Ripple’s latest win against the SEC, with the Commission dismissing its case against the company’s founders. Ripple is also actively building to expand its services, which could see XRP’s utility increase as a result of the company’s efforts. 

What Could Hinder XRP’s Rise?

CrediBULL Crypto also mentioned the factor that was hindering a massive rally from the XRP price. According to him, the token is simply facing the same problem that other altcoins are encountering, which is a lack of liquidity in the market

He stated that this was what ultimately affected XRP’s decline in the months leading up to now, as he had predicted that XRP was going to rise above $1 following Judge Analisa Torres’ ruling in favor of Ripple in its case against the US Securities and Exchange Commission (SEC). 

Another factor that could see the XRP price decline in the short term is the projected parabolic rise of the flagship cryptocurrency, Bitcoin. While analyzing the XRP/BTC chart, CrediBULL Crypto hinted that XRP could experience as much as a 30% decline against BTC. This decline doesn’t only apply to XRP, as he expects that other altcoins will bleed against the foremost cryptocurrency.

The crypto analyst, however, does not doubt XRP’s potential, as he stated that the token would be one of the biggest benefactors once, there is an “influx of new money” in the market, which is likely to happen as Bitcoin continues to rise

XRP price chart from Tradingview.com

XRP Price Confirms Breakout Above Multi-Month Resistance: Next Targets

Renowned crypto analysts, Dark Defender, Jaydee, and Egrag have provided insights into the recent performance of XRP against the US dollar. All three analysts agree that XRP has confirmed a breakout from a multi-month resistance level yesterday and could be poised for another leg up.

XRP Price Successfully Breaks Out

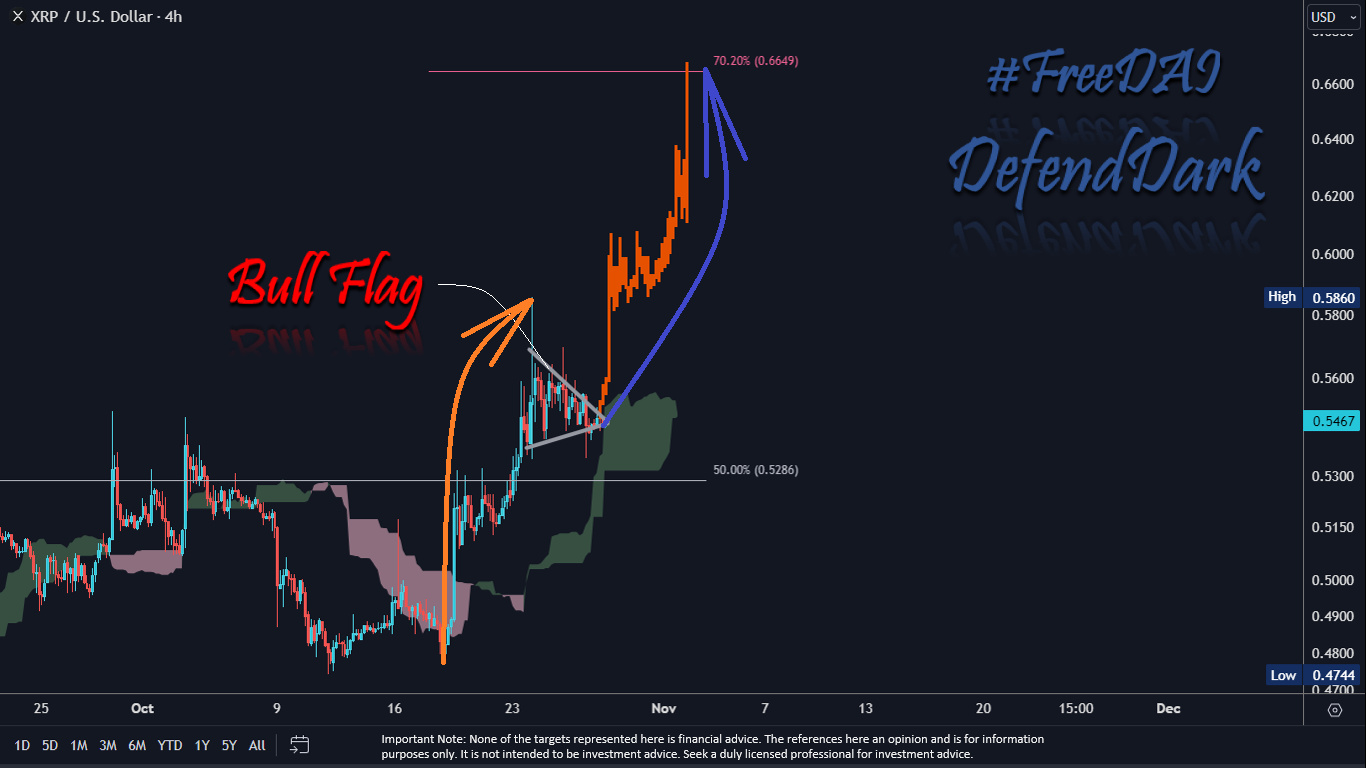
In the 4-hour time frame, Dark Defender has highlighted the formation of a “bull flag” pattern. This is usually considered a bullish continuation signal. Prior to the formation of this pattern, XRP experienced a significant upside move and then entered a consolidation. By surging above $0.55 yesterday, XRP validated the bull flag pattern.

Dark Defender posted, “confirmed”, alluding to a previous post where he stated the uptrend is reinforced by the Ichimoku cloud, which provided support below the price. “XRP formed a bull flag pattern, and this structure precisely touches our target at $0.66 in the 4H time frame,” the analyst remarked.

XRP bull flag pattern

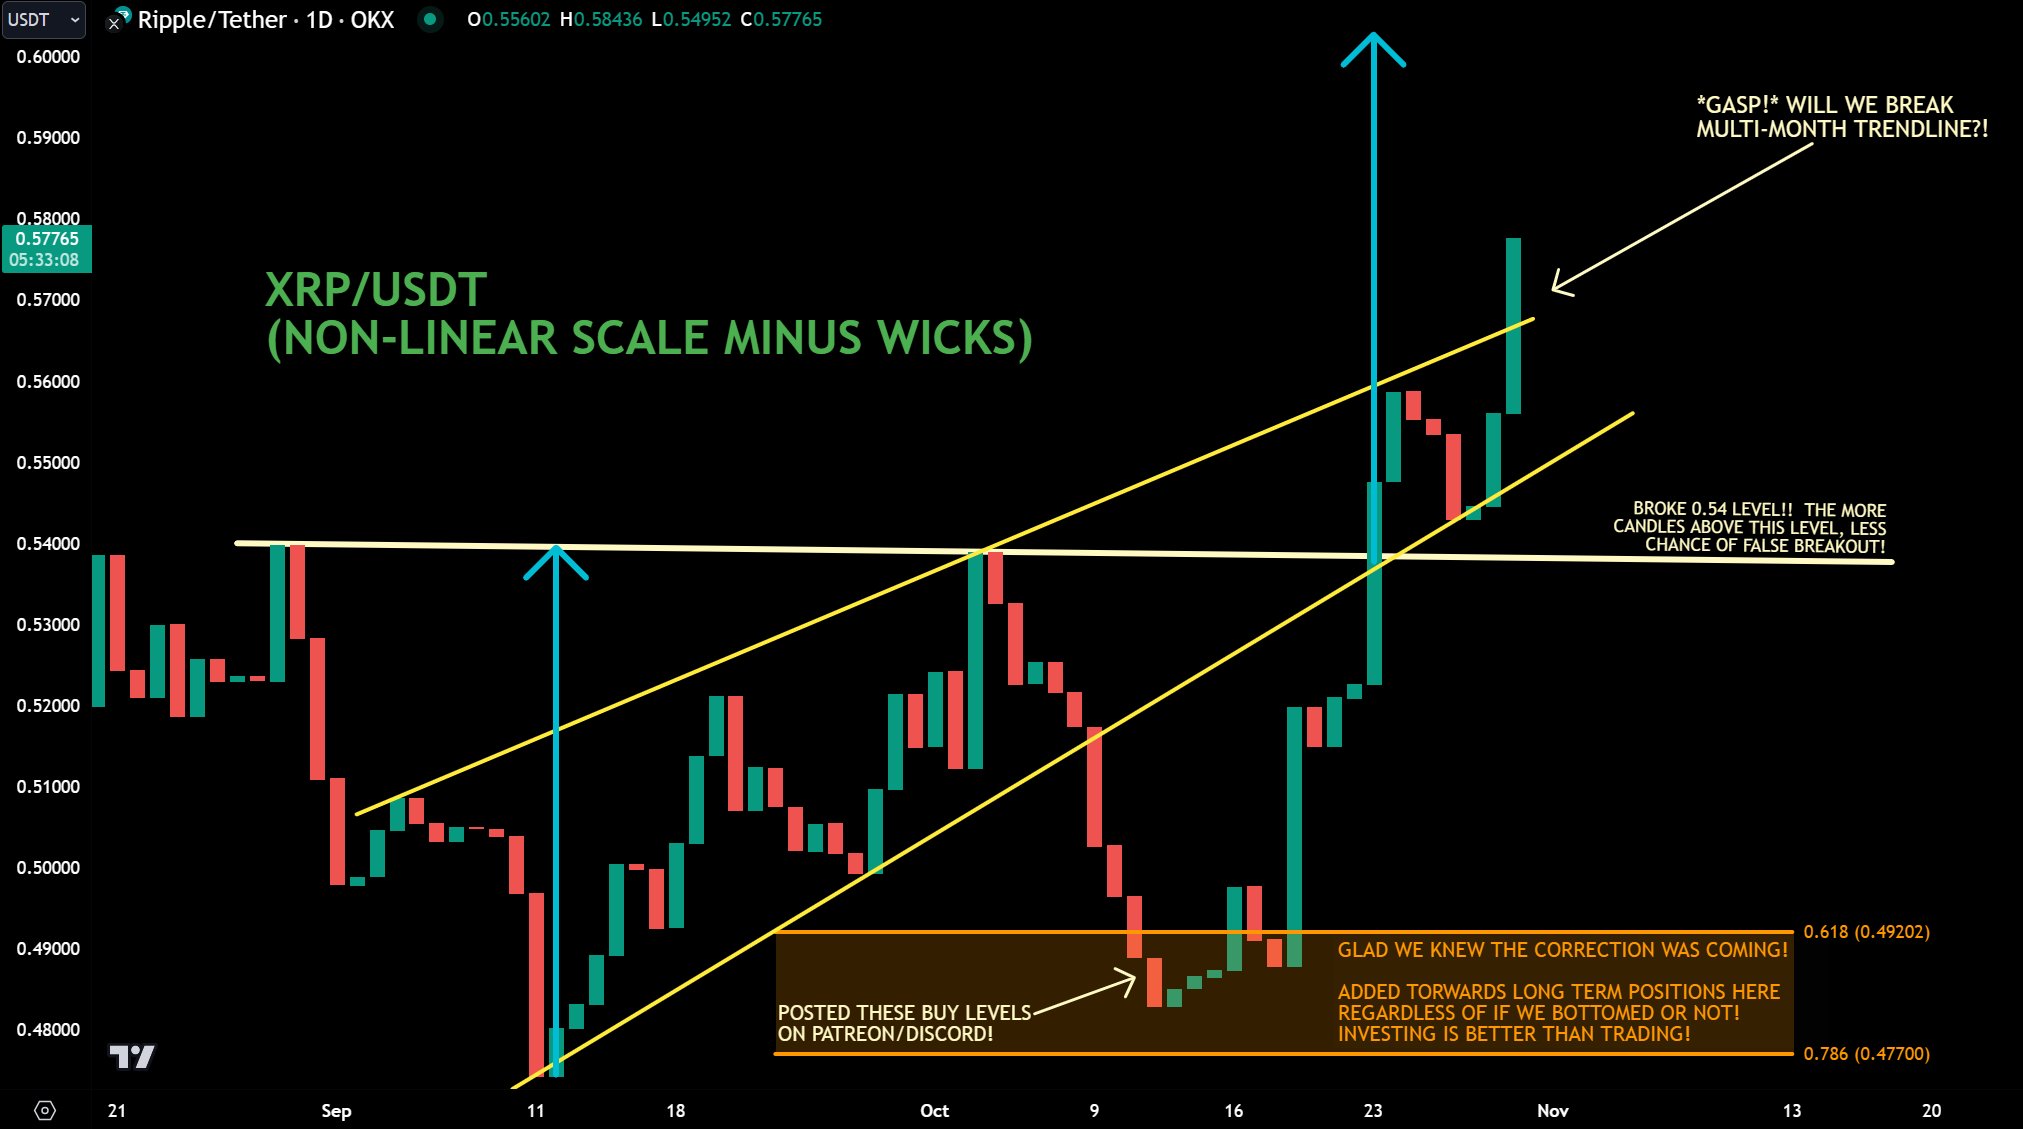
Jaydee’s analysis, using a daily time frame, showcases the price breaking the multi-month trendline resistance. The analyst spotlighted the importance of the $0.54 price level, stating that the longer the asset holds above this level, the lesser the chances of a false breakout. He predicts that the XRP price could rise above $0.60 in the short term.

“GASP!* Are we confirming the multi-month trendline breakout today? Finally, people are paying more attention to the charts that have been calling the crashes (& ignoring hopium that keeps REKTin Dumb Money) SMH LOL! Let’s go! Jaydee stated.

XRP breaks multi-month trendline

Egrag has shared a similar prediction as the other two analysts. In one of his latest analyses, Egrag refers to the $0.55 level as “the ultimate battleground” and emphasizes the tug-of-war between the bulls and bears at this critical juncture.

Looking at the 4-hour time frame, Egrag notes the commendable efforts of the bulls to maintain candle closes above the $0.55 level. In contrast, the bears are persistently trying to push the price back below that threshold.

The current challenge, according to the analyst, is that the XRP price needs to seal two consecutive full candles above the $0.55 level in the daily chart. Moreover, on the 3-day chart, the bulls must succeed in confirming a single candle close above this important price point. Egrag suggests that such a result would pave the way for the next significant challenge on the weekly chart.

What’s Next?

Based on the combined insights from the charts, the immediate target for XRP appears to be the $0.66 level, as indicated by the bull flag pattern on Dark Defender’s analysis. However, sustaining above the $0.54-$0.55 level will be crucial to affirm the bullish breakout and diminish the chances of a price pullback.

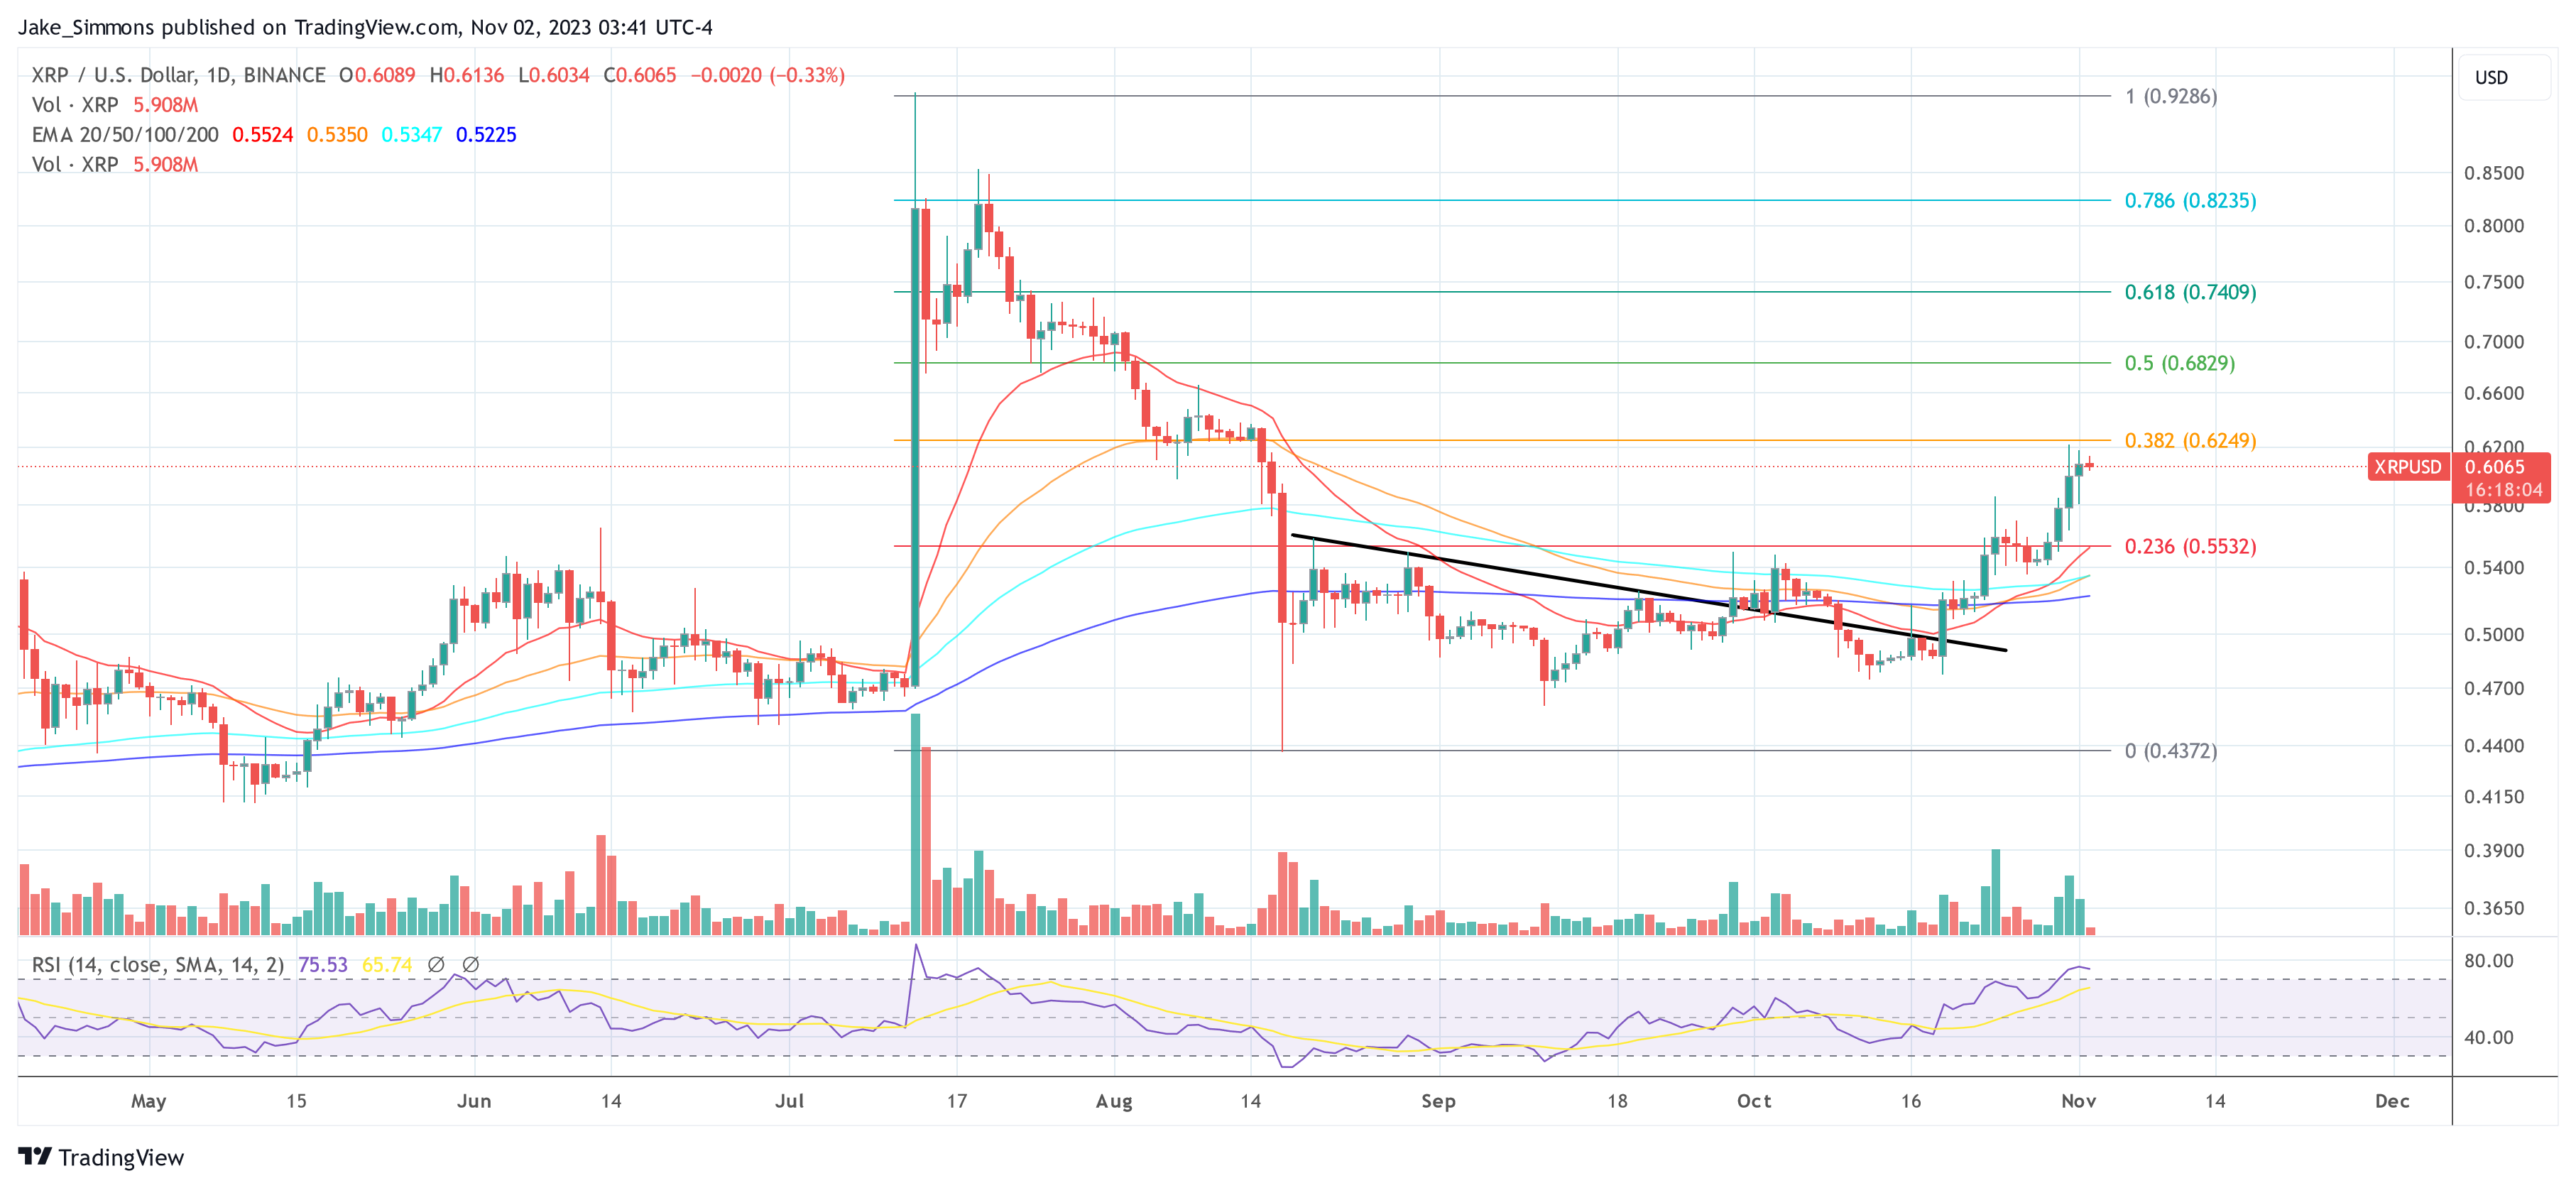
The analysis using Fibonacci retracement levels further corroborates the analyst’s perspective. Upon examining the 1-day chart, it’s evident that the XRP price surpassed the 0.236 Fibonacci level at $0.554 yesterday after a multi-day struggle. This suggests a potential weakening of bearish momentum, hinting at a continued upward price trajectory.

The subsequent targets to watch include the 0.382 Fibonacci level at $0.626 and the pivotal 0.5 Fibonacci level at $0.685. It’s worth noting that the 50% Fibonacci mark holds psychological significance, as reaching it would mean XRP has reclaimed half of its prior bearish slide after the summary judgment in the Ripple vs. SEC case.

XRP price

XRP Price About To See “Face Ripping” Rally, Legendary Trader Weights In

The XRP price continues to enjoy positive performance as the crypto market trends to the upside. The current rally confluences with the sector’s historical performance; thus, cryptocurrencies could extend their bullish trend.

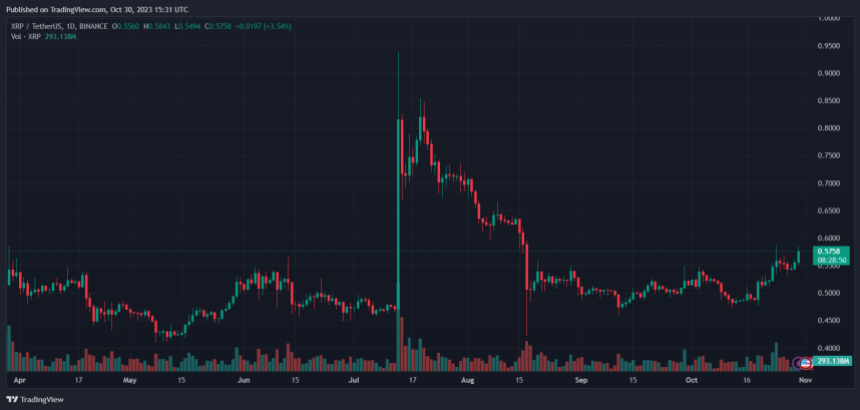
As of this writing, the XRP price trades at $0.58 with a 5% profit in the last 24 hours. In the previous seven days, the cryptocurrency recorded an 11% rally and stood as one of the best performers in the sector over the same period, along with Solana (SOL) and Cardano (ADA).

XRP Price XRPUSDT

XRP Price Bull Run Incoming?

As XRP and other trend upwards, legendary trader Peter Brandt share his positive views on the nascent sector. Brandt has been known for expressing his views on BTC and crypto without reservations, and this time, the forecast is bullish.

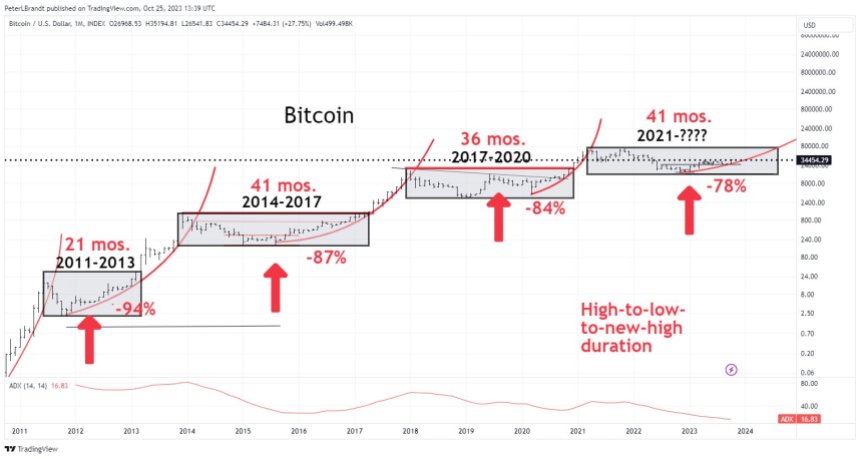
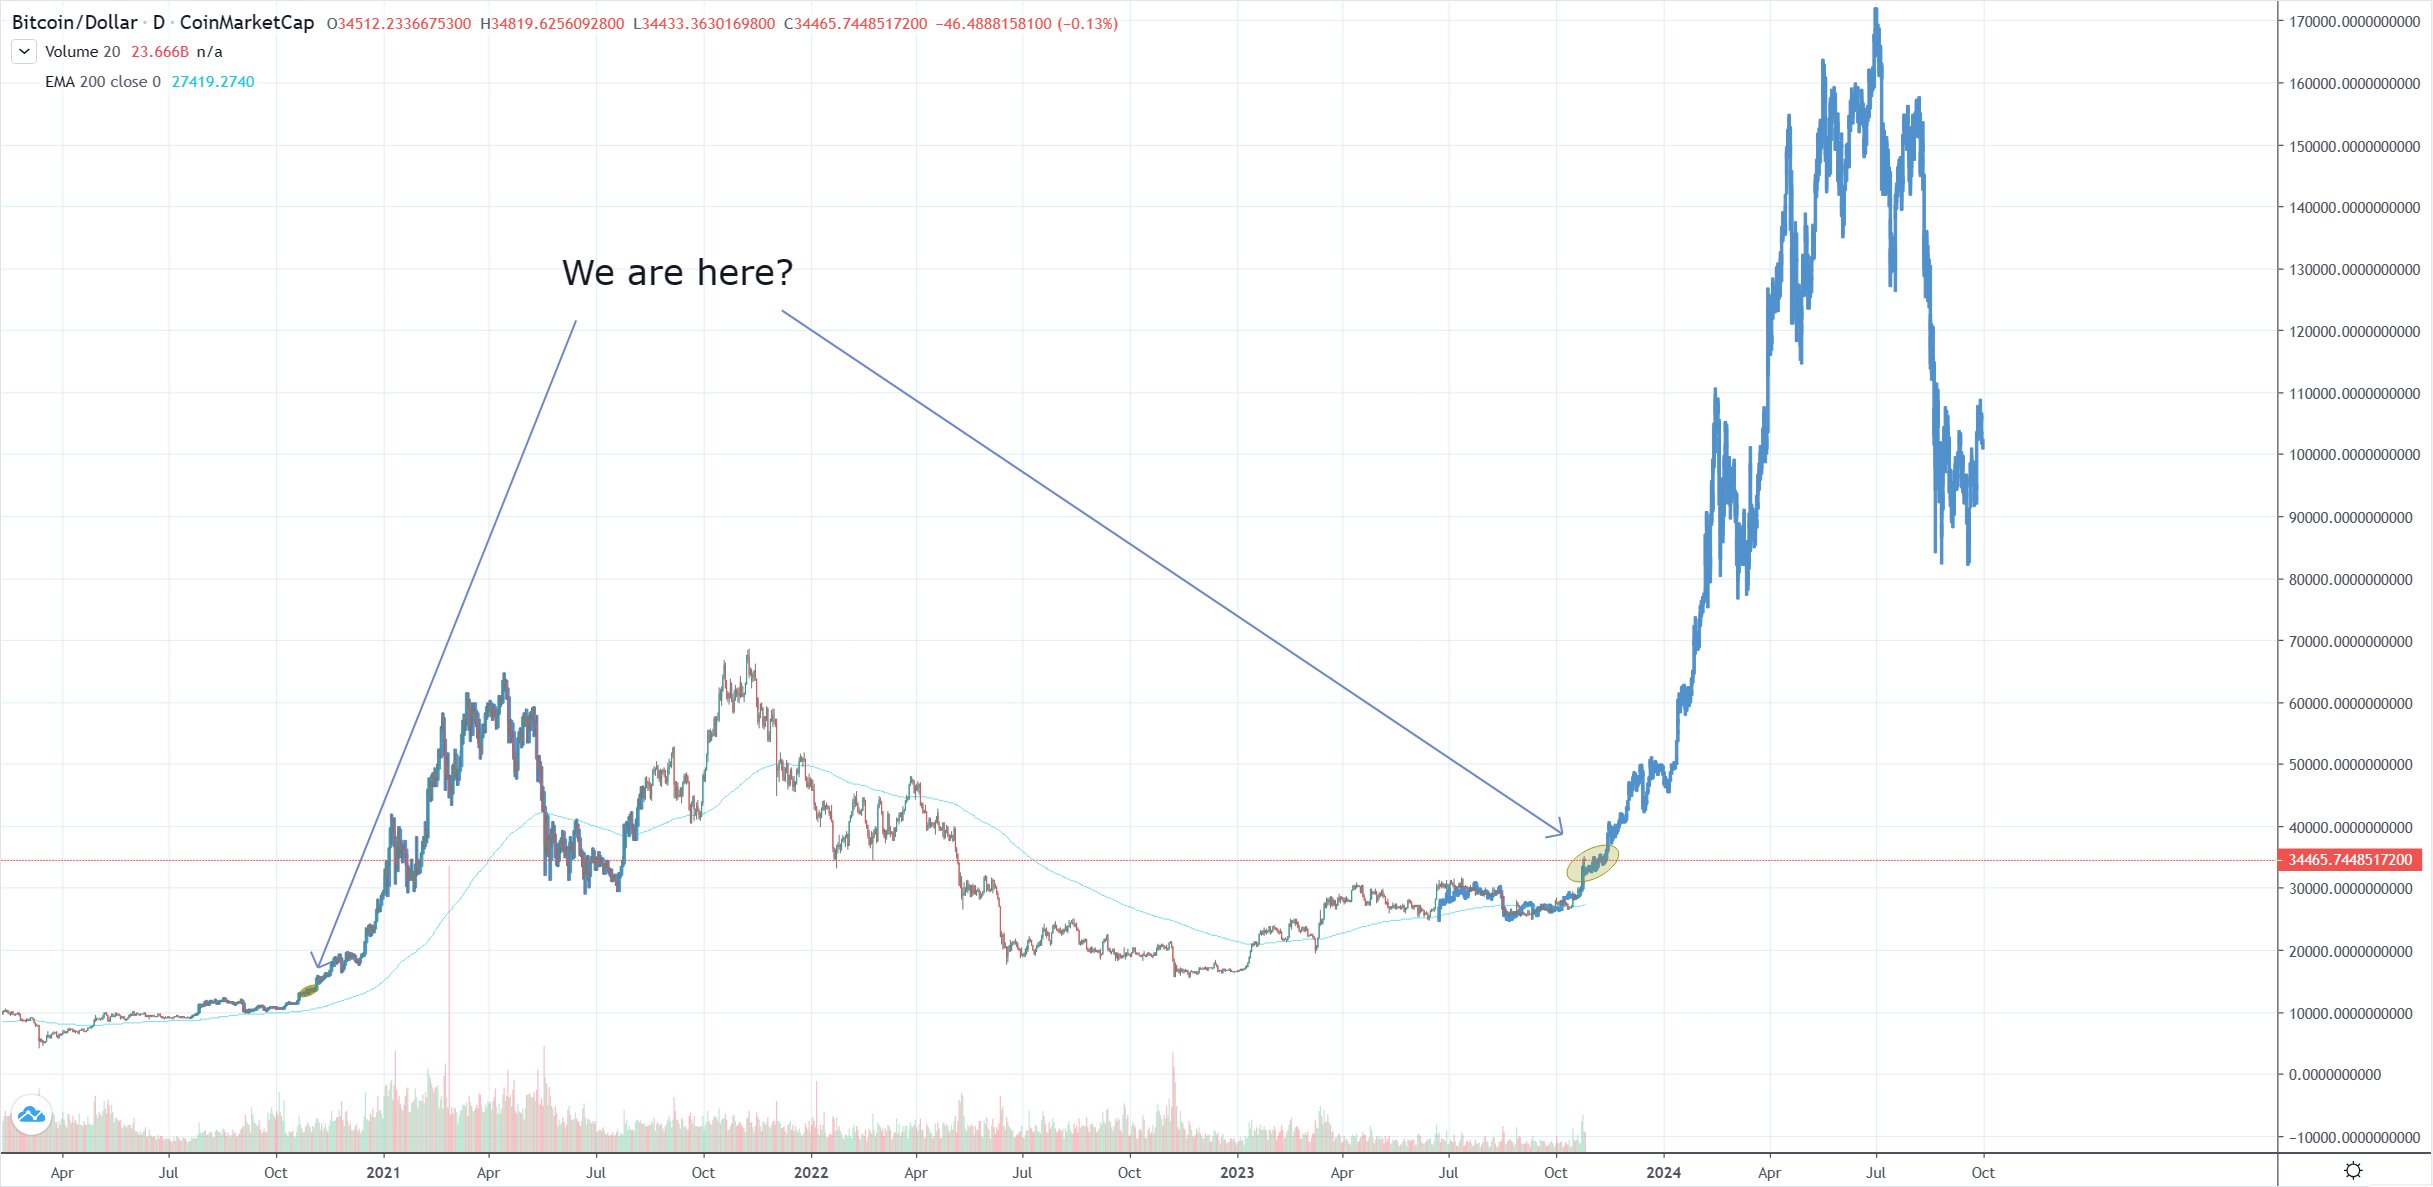
On social media platform X, the legendary trader dismissed market actors trying to predict future performance. However, Brandt dared to make three predictions regarding Bitcoin: first, the cryptocurrency is likely to hit bottom, which will lead it to new all-time highs, as seen in the chart below.

This bullish price action is based on the cryptocurrency’s historical performance. Each time the BTC market drops around 78%, Bitcoin bottoms and re-enters price discovery. The XRP price, Ethereum, and other altcoins follow the trend.

In 2017, when BTC went into a bull run, the XRP price reached an all-time high above $3. If history repeats, and based on the fundamentals supporting XRP’s bullish momentum, the token could hit a similar level.

XRP price XRPUSDT Ripple Bitcoin BTC BTCUSDT

XRP In The Short Term, Levels To Watch

The optimistic forecast in the traditional financial market supports this scenario. If stocks and Bitcoin see further profits, everything will align for XRP and other altcoins to hit their previous all-time highs.

In short timeframes, a pseudonym analyst indicated that XRP formed a bull flag pattern. This bullish market structure hints at a potential run of the high area around $0.66. However, bulls must maintain the token above $0.52 and $0.54 to prevent a run of the lows.

The analyst stated the following about XRP and how close it is to completing a significant milestone for further profits:

The first break has just arrived. XRP close to the Mid resistance at $0.5557. Still, the following applies: Bull flag $0.5557 above, to be precise. Invalidation $0.54 below.

Cover image from Unsplash, chart from Tradingview

XRP Price Breakout Soon? Analyst Points To Bullish Structural Signs

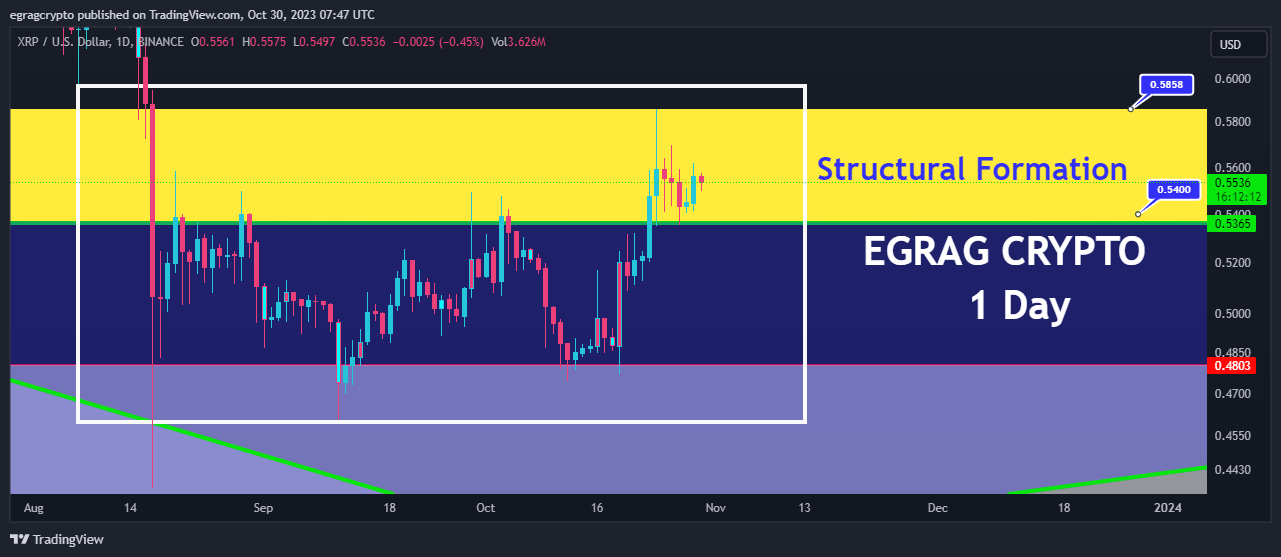
In a detailed analysis shared on social media today, renowned crypto analyst Egrag points to several bullish indicators in the XRP price structure, suggesting the potential for an imminent breakout. Egrag evaluated various timeframes, identifying a series of technical patterns and formations that bolster the bullish outlook.

XRP Shows Strong Bullish Structural Signs

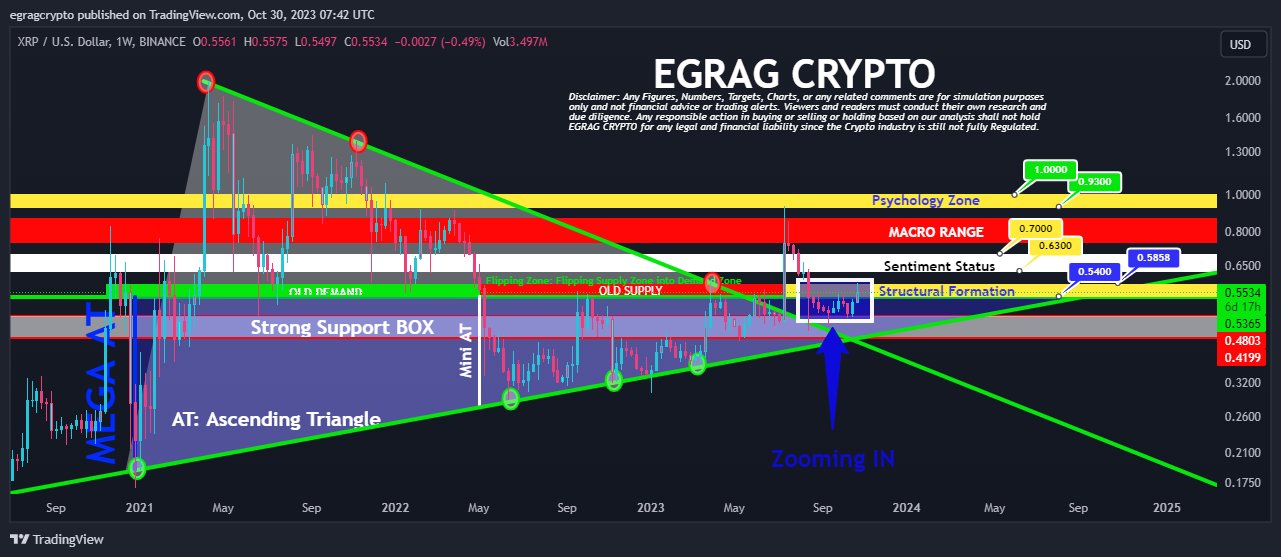
“Last week’s candle closed within the confines of the Yellow structural formation,” Egrag tweeted with regard to the weekly XRP/USD chart, emphasizing the significance of recent movements within the timeframe. This observation is instrumental in understanding the underlying market structures influencing the upcoming price action.

The implication? If another weekly candle were to affirm its position within this formation, the odds of a bullish trend continuation could significantly increase. “To confirm a bullish trend continuation, we need to see another weekly candle close with a full body inside this structure,” Egrag added.

XRP/USD weekly chart

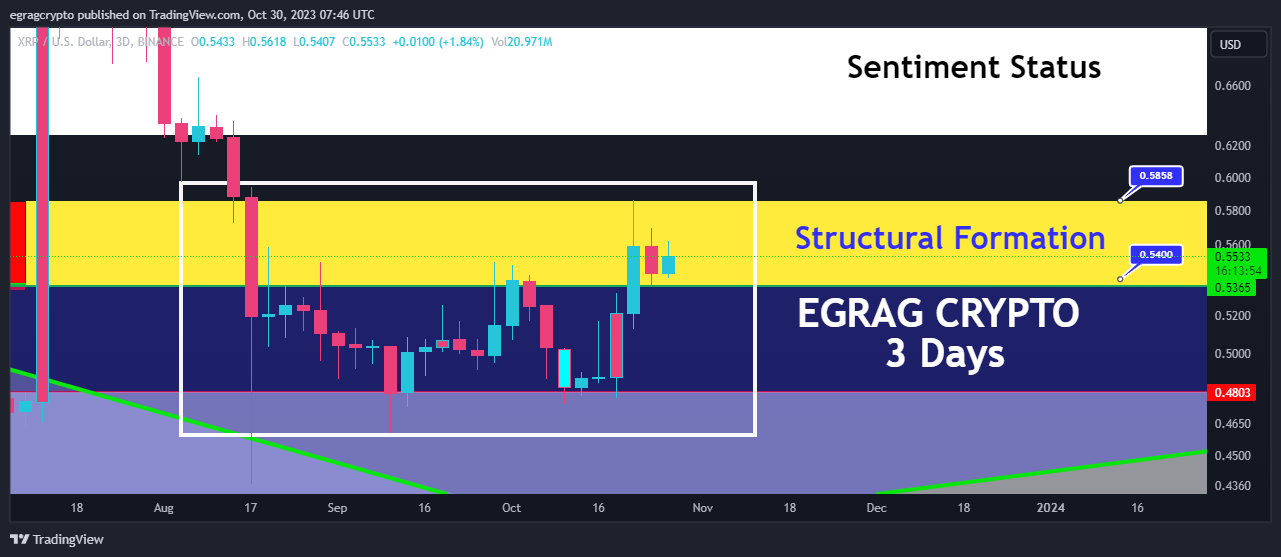
Next, his insights extend further to the three-day chart, where he keenly observes, “In just 16 hours, XRP is poised to complete the second full body candle within the structural formation, signaling a strong bullish sentiment.” This near-term projection underscores a sense of momentum that appears to be building within the XRP market.

XRP/USD 3-day chart

The 1-day chart, too, garnered Egrag’s scrutiny. He highlighted the imminent completion of the seventh full-body candle within the current structure, stating this indicates an “extremely bullish trend.” This observation suggests that XRP’s bullish behavior isn’t just a fleeting phenomenon but has consistency across varying timeframes.

XRP/USD 1-day chart analysis

For traders with a penchant for shorter timeframes, Egrag’s insights into the 12-hour chart are particularly salient. While there have been multiple closures within the structural formation, he singled out the importance of the ongoing momentum: “The current candle and the next one are pivotal as they form a symmetrical triangle.”

He elaborated on the implications of this pattern, saying, “Typically, symmetrical triangle breakouts have a 50/50 chance, making this a decision point for XRP.”

XRP Price Targets

Circling back to a tweet from October 27, Egrag had demarcated significant price zones, highlighting the “$0.54 to $0.58” range as a make-or-break threshold. Beyond this, he indicated the “$0.63-$0.70” range as a pivotal indicator of market sentiment shifts.

For those with an eye on the psychological dimensions of trading, Egrag’s mention of the “0.93-$1” bracket is noteworthy. He cautioned traders about this zone, advising them to “Stick to your plan and resist the temptation to let emotions or impatience dictate your actions.”

In sum, Egrag’s comprehensive analysis blends technical data with trader sentiment and psychology, providing a nuanced and detailed perspective for those invested in XRP. The coming days are likely to be watched with bated breath as traders anticipate the next big move.

At press time, XRP traded at $0.5595.

XRP price

XRP Price Prediction: Analyst Points Out Incoming Mega Bounce, Here’s The Target

Another bullish prediction has come in for the XRP price which is arguably more optimistic than many would expect. This time around, a crypto analyst is expecting XRP to use up its stored energy for an explosive rally that could see the altcoin rally to $27, well above its all-time high. 

XRP Price Suppressed During Last Bull Run Because Of SEC Lawsuit

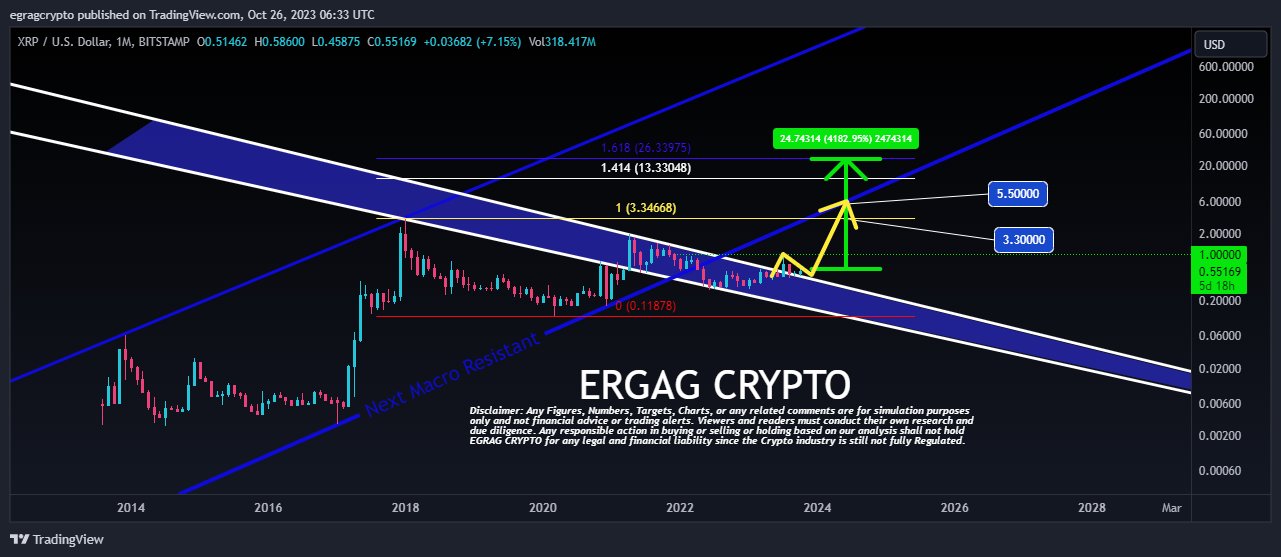
Crypto analyst ERGAG CRYPTO recently predicted that XRP is poised for a massive 4,000% price surge. ERGAG made this prediction in an X post, detailing how this price surge can be actually possible. According to the analyst, XRP’s price was suppressed during the last major crypto bull run in 2021 due to an ongoing lawsuit from the SEC against Ripple Labs, XRP’s creator. 

While Bitcoin and other altcoins were hitting new all-time highs, the XRP price struggled to keep up due to fears the lawsuit could severely impact the project’s future. For instance, during this time period, Bitcoin skyrocketed by 23X, and Ethereum also went up a whopping 58X. 

A federal judge in the United States has since determined that the programmatic sales of XRP do not constitute the selling of securities. Now that the lawsuit seems to be coming to an end with a settlement in sight, XRP is poised to make up for lost time and shoot up with this lost energy. 

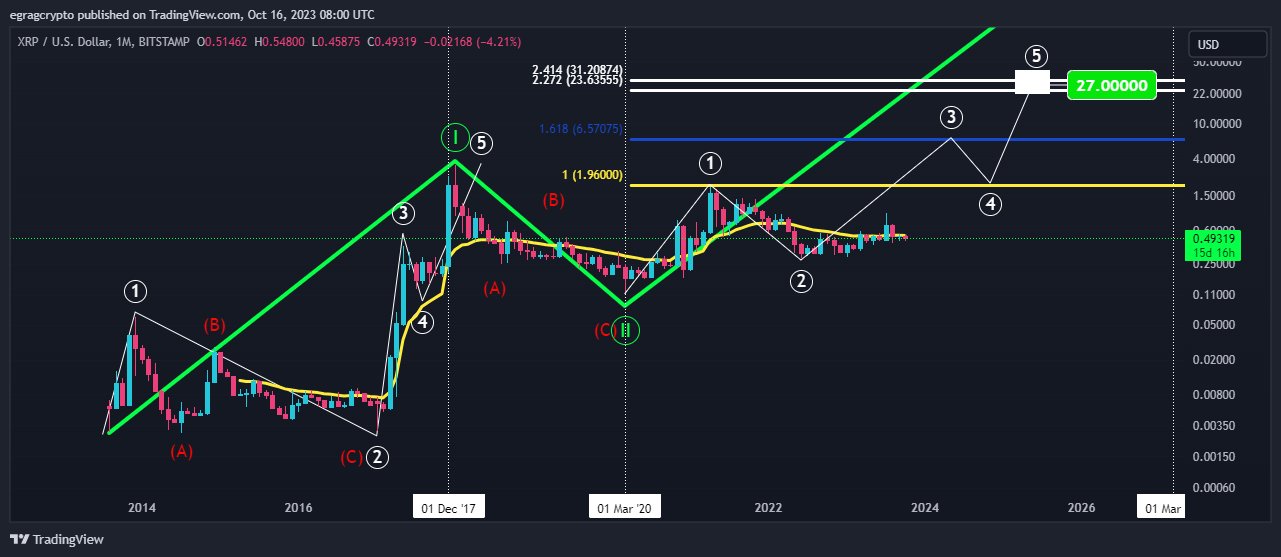
The analyst predicts the XRP price could rally 40 times from its current level to $27 in the subsequent bull run, which would exactly coincide with the Fibonacci 1.618 indicator from the 2017 peak to the 2020 bottom.

XRP price prediction

Although a timeline for the next bull run is not known at the moment, ERGAG puts this spike to happen around mid-2024.


What’s Next For XRP?

The entire crypto market has witnessed gains since the middle of October, and the XRP price hasn’t been left out. Bitcoin, for instance, attained a new yearly high of $35,150. At the time of writing, XRP is trading at $0.547, up by 5.73% in the past seven days. 

Although its price is relatively low compared to other altcoins, XRP is still one of the strongest in the entire market, occupying the 5th spot in terms of market cap. 

ERGAG CRYPTO has also had some very optimistic price predictions for XRP in the past. While a $27 price point seems very overachieving, XRP could easily smash through its previous all-time high of $3.84 in the next bull market. The analyst had initially predicted that the altcoin might not see a new all-time high by July 2028.

Shiba Inu price chart from Tradingview.com (SHIB whales)

XRP Price Could Blast Off In 18 Days, Here’s Why

The crypto community is abuzz with speculation as analysts draw parallels between the current XRP price movement and the 2017 Bitcoin (BTC) fractal. With several events on the horizon, many are wondering if the cryptocurrency is on the brink of a significant breakout.

Cryptoinsightuk, a recognized figure in the space, tweeted yesterday, “XRP Blast off in T-19 days. I’ve seen a lot of people overlay the 2017 BTC fractal to the present day and to be honest it is following it VERY closely.” Accompanying the tweet were images highlighting the similarities between the two price movements.

The 2017 BTC Fractal and XRP’s Current Position

The first image shared by Cryptoinsightuk overlays the 2017 BTC price movement onto the current XRP price chart. The striking resemblance between the two has caught the attention of many in the community. The consolidation phase of the 2017 BTC fractal, which began around October/November 2020, is being compared to XRP’s current position.

XRP vs BTC fractal

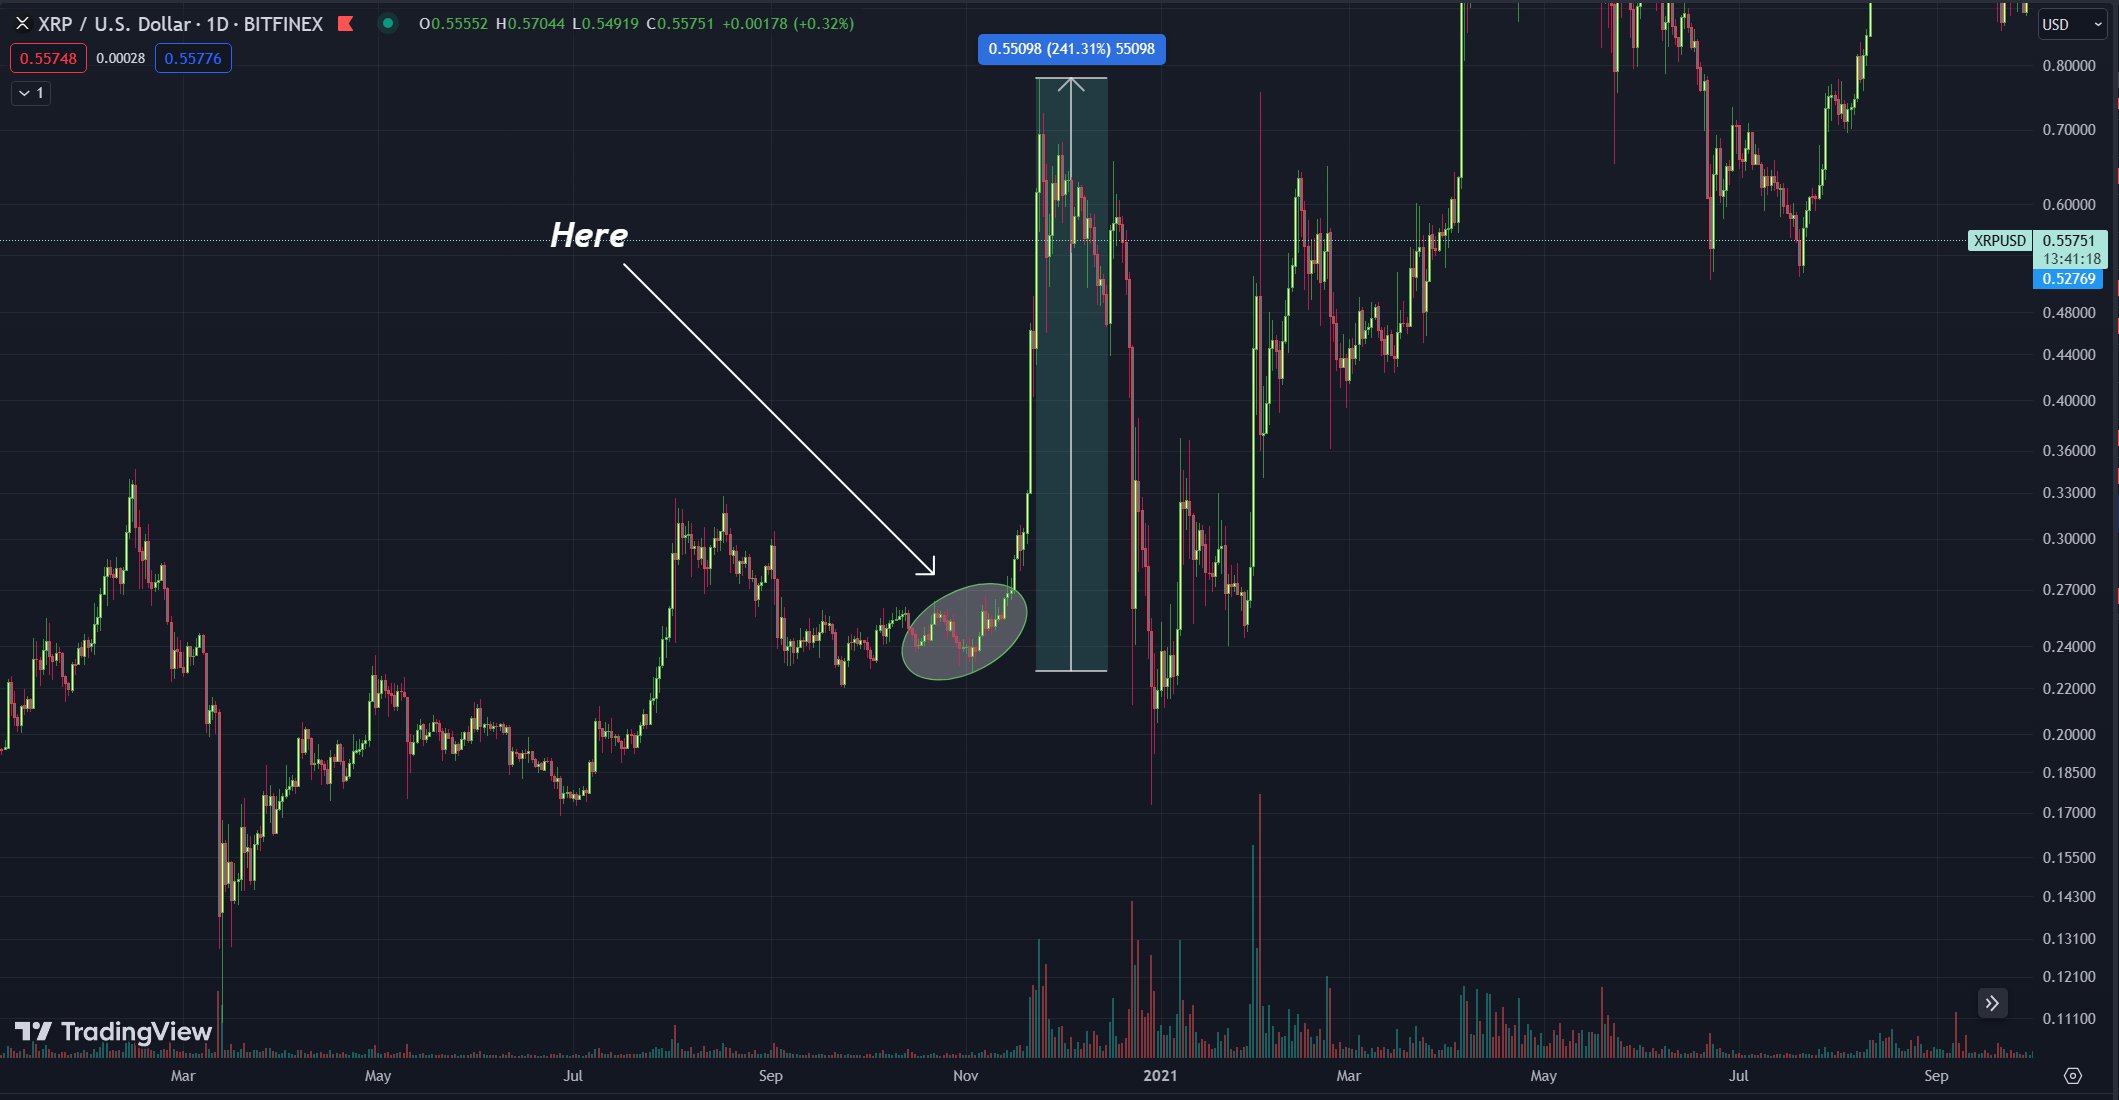
Elaborating on this, Cryptoinsightuk shared a second image, stating, “The consolidation on the left starts in October/November 2020. If we look at where XRP was at this time; It was right here.” The image indicates that following this consolidation phase in 2017, BTC experienced a massive 241% expansion at the end of 2020.

XRP 1-day price chart

However, it’s essential to note that while BTC was experiencing its bull run in 2017, XRP faced a significant setback. As Cryptoinsightuk pointed out, “We then crashed HEAVILY because of a Black swan event (SEC lawsuit was dropped on Ripple), whilst most other cryptos started their bull markets, breaking their previous ATHs (All-Time Highs).”

As NewsBTC reported, the SEC lawsuit against Ripple Ripple had a profound impact on the XRP price, causing it to plummet. This event has left many wondering if the cryptocurrency, after consolidating and three consecutive victories over the SEC in recent months, is now poised for a significant breakout.

Will History Repeat?

The million-dollar question on everyone’s mind is whether XRP will follow the trajectory of the 2017 BTC fractal. If it does, we could be looking at a substantial price surge in the coming weeks. However, as with all things in the crypto world, nothing is guaranteed.

Cryptoinsightuk’s tweet ends on a speculative note, asking, “Will history repeat? Or, will XRP outperform after consolidating for over 5 years?” If history repeats itself, the XRP price could blast off in as little as 18 days.

XRPEuropean chimed in on the discussion, commenting that there are several potential strong catalysts which could propel the price to new heights, “Love the countdown man. Lots going on with the settlement talks by Nov 9, Ripple Swell and ISO20022 on Nov 19 …. All we need is a Bitcoin spot ETF approval as well.” Cryptoinsightuk responded with enthusiasm, stating, “That would be fireworks!”

While the optimism is palpable, some analysts urge caution. JC Hodler recently tweeted, “BTC fractal does look promising for the next bull-run to start. But so did the fractal for XRP in 2021 to take the ATH out & it never happened because of the lawsuit. Still waiting on the Tether lawsuit that should have an effect on all coins. Only time will tell.”

Will XRP Release Its Stored Energy?

Renowned crypto analyst Egrag has weighed in on the ongoing discussions about XRP’s price trajectory, offering a bullish perspective. According to Egrag, a significant upswing in XRP’s price seems inevitable. “XRP Mega Bounce Is Inevitable – Fib 1.618 ($27),” he stated in reference to his 1-month XRP/USD chart.

XRP price prediction

In his analysis, Egrag compared the previous bull runs of major cryptocurrencies. “In the previous bull run, BTC skyrocketed by 23x and ETH went up a whopping 58x!” He used this historical data to set the stage for XRP’s potential performance, highlighting that XRP’s journey was unfortunately halted due to the SEC. “However, the XRP journey hit a roadblock when it was slapped with a lawsuit, putting a pause on the bull run.”

Egrag suggests that once XRP overcomes its legal challenges, it could unleash significant pent-up potential. He elaborated that the cryptocurrency, upon embarking on its next journey, “will release its stored energy, launching it into the cosmic expanse like a shooting star! A 40X move is on the horizon, representing a staggering 4000% gain, perfectly aligning with the Fib 1.618 from the 2017 peak to the 2020 bottom.

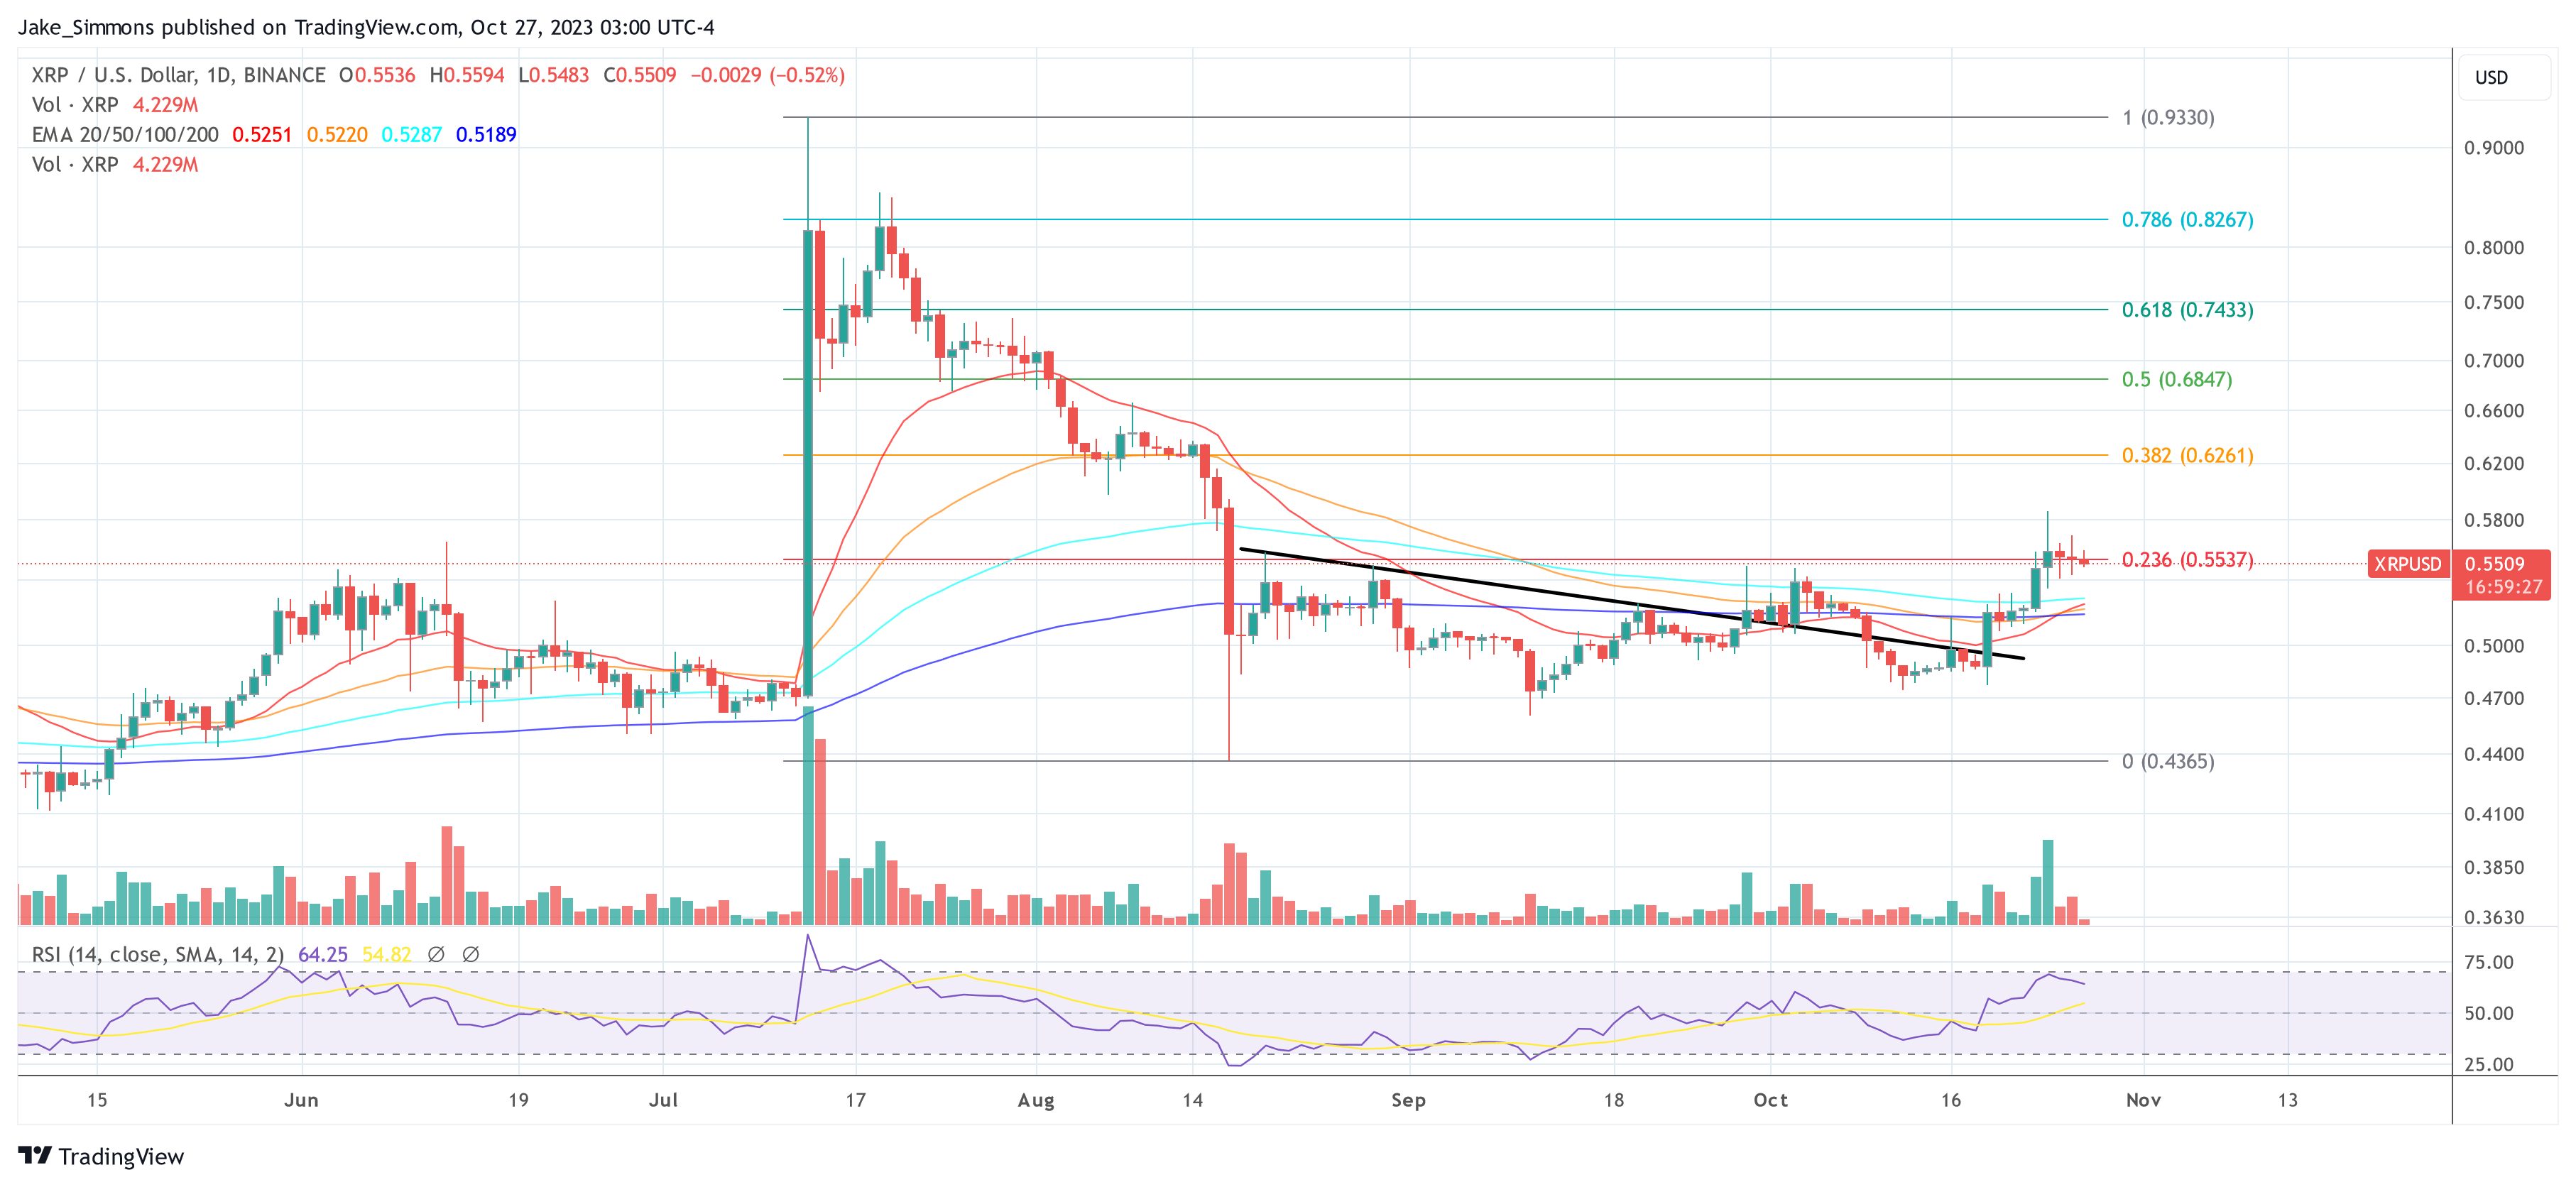
At press time, XRP traded at $0.5509.

XRP price

Forget 2023, Here Are The Major XRP Price Predictions For 2024

The official dismissal of the US Securities and Exchange Commission’s (SEC) claims against Ripple’s CEO Brad Garlinghouse and its co-founder Chris Larsen has reinvigorated predictions about the XRP price future trajectory. With the year coming to a close, some financial experts are already looking to 2024 and have made their expectations known as to the XRP price in 2024.  

XRP Price Could Go Above $1

Some financial specialists have given their thoughts on XRP’s price and factors that could ultimately affect the token’s trajectory. One of these experts happens to be Gillian Dewar, the Chief Financial Officer (CFO) of Crediful, who believes that the token could rise to as high as $1 (and even go higher)  based on certain conditions. 

These conditions include XRP’s adoption rate and the state of the broader crypto market. Ripple uses XRP as its utility token in processing cross-border transactions for its clients. Some of these clients include global financial institutions, and Dewar believes that XRP’s adoption, among them, could have a significant impact on the token’s future price pattern

Rising To $2

Financial analyst Lauren Yarpei didn’t give an exact price that XRP could attain at the start of 2024, although she noted that some other financial experts project that it could rise to as high as $2 at the start of next year.

Dom Farnell, a co-founder of The Investors Center, is really bullish on the token as he labels XRP as one of the best altcoins. Although he didn’t give a timeframe, he believes that the XRP community will soon witness the token hitting a new all-time high (ATH)

XRP Above $10

On the more optimistic side, crypto analyst Egrag Crypto believes that 2024 will be the year when the XRP price experiences parabolic growth. In an analysis posted on X (formerly Twitter), Egrag told their followers that the altcoin could explode 2,500% in 2024 which would mean that the XRP price climbs above $10.

In another prediction, Egrag has outlined a possible XRP price move to $30, which would happen sometime in the bull market.

XRP price prediction chart from Tradingview.com

XRP Price Between $14 And $17

Another crypto analyst puts the XRP price between $14 and $17 in the upcoming year. Like Egrag, the analyst sees the altcoin crossing the $10 dollar mark next year, something that would validate the expected 2,500% move upward.

On a longer time frame, the analyst expects XRP to climb as high as $24 around 2026-2027. Once again, validating Egrag’s prediction for the altcoin’s price.

Sending XRP To $500

Although the prediction of Wells Fargo Manager Shannon Thorp, is on a much longer timeframe, it is important to mention that the analyst believes that the XRP price will reach $500.

Thorp uses the fact that Ripple is moving into the cross-border payments sector, and capturing a good portion of that market share will send XRP surging in no time. The analyst, however, puts the timeframe for this sometime in 2027.

God Candle Coming For XRP Price? Crypto Analyst Reveals His Target

The XRP price has experienced a strong upswing along with the entire crypto market in the past few hours. XRP has temporarily risen by more than 5%, approaching a crucial resistance zone that if broken could trigger a strong and impulsive “god candle”.

Renowned crypto analyst Egrag unveiled his latest technical analysis on XRP’s price trajectory, sparking excitement within the crypto community. Using the 3-day XRP/USDT price chart, Egrag brings attention to several pivotal moments and trends.”XRP Gods Candle, it is coming, tweeted Egrag.

The “Berlin Wall” Of Resistance For XRP Price

In his analysis, Egrag likened the XRP’s resistance level to the infamous ‘Berlin Wall’, describing the resistance as both formidable and tantalizingly close to a breakdown. “Fast forward to today, and XRP is still chipping away at what can only be described as its own ‘Berlin Wall’ of resistance. With each small pinch, this formidable barrier inches closer to its inevitable collapse,” stated Egrag.

The “Berlin Wall” at $0.5574 served as a strong support from May 2021 to May 2022. Egrag’s chart shows two critical moments when the price level served as important support. However, in early May 2022, the XRP price fell below this support level. After that, XRP was rejected at the Berlin Wall in two key moments.

After the summary judgment in the lawsuit between Ripple and the US Securities and Exchange Commission, the wall was overcome only for a short time, despite the first God candle. Within 4 weeks, the price fell back below the price level. Now, however, the wall seems to be crumbling and resistance is getting lower, Egrag believes.

The analyst highlights the potential upside of this impending breakout: “The potential breakthrough looming on the horizon promises to be nothing short of spectacular. My expectations are set on XRP’s forthcoming move, which I anticipate falling within the impressive range of $1.10 to $1.40.”

Egrag also emphasized the emergence of a distinct ‘W’ pattern in XRP’s price action over the past 2+ months. This pattern is historically significant, often linked to trend reversals and strong price momentum.

“Now, let’s take a closer look at the current technical analysis. It’s apparent that XRP is in the process of forming a distinct ‘W’ pattern,” Egrag noted, suggesting a bullish outlook, “This pattern suggests a measured move to approximately $0.65.”

The Rebounce

Furthermore, the $0.65 mark isn’t just a random figure in Egrag’s analysis. A successful move past this resistance can set the stage for a bullish trend, and a short-term retest of the $0.55 to $0.58 cents range. Egrag highlights the importance of this level, stating, “Our next significant milestone is around 65 cents, and a successful breach at this level would indicate a bullish trend.”

The climax of Egrag’s prediction centers around the potential for a “Rebounce” — a term he employs to describe a swift and robust bounce in the price of XRP. Should this Rebounce materialize, Egrag is optimistic about the coin reaching the $1.10 to $1.40 range.

Concluding his update with a message to the ardent followers of XRP, Egrag affirmed, “XRP Army STAY STEADY, Our moment in the spotlight is drawing near, and your unwavering commitment will soon be rewarded.”

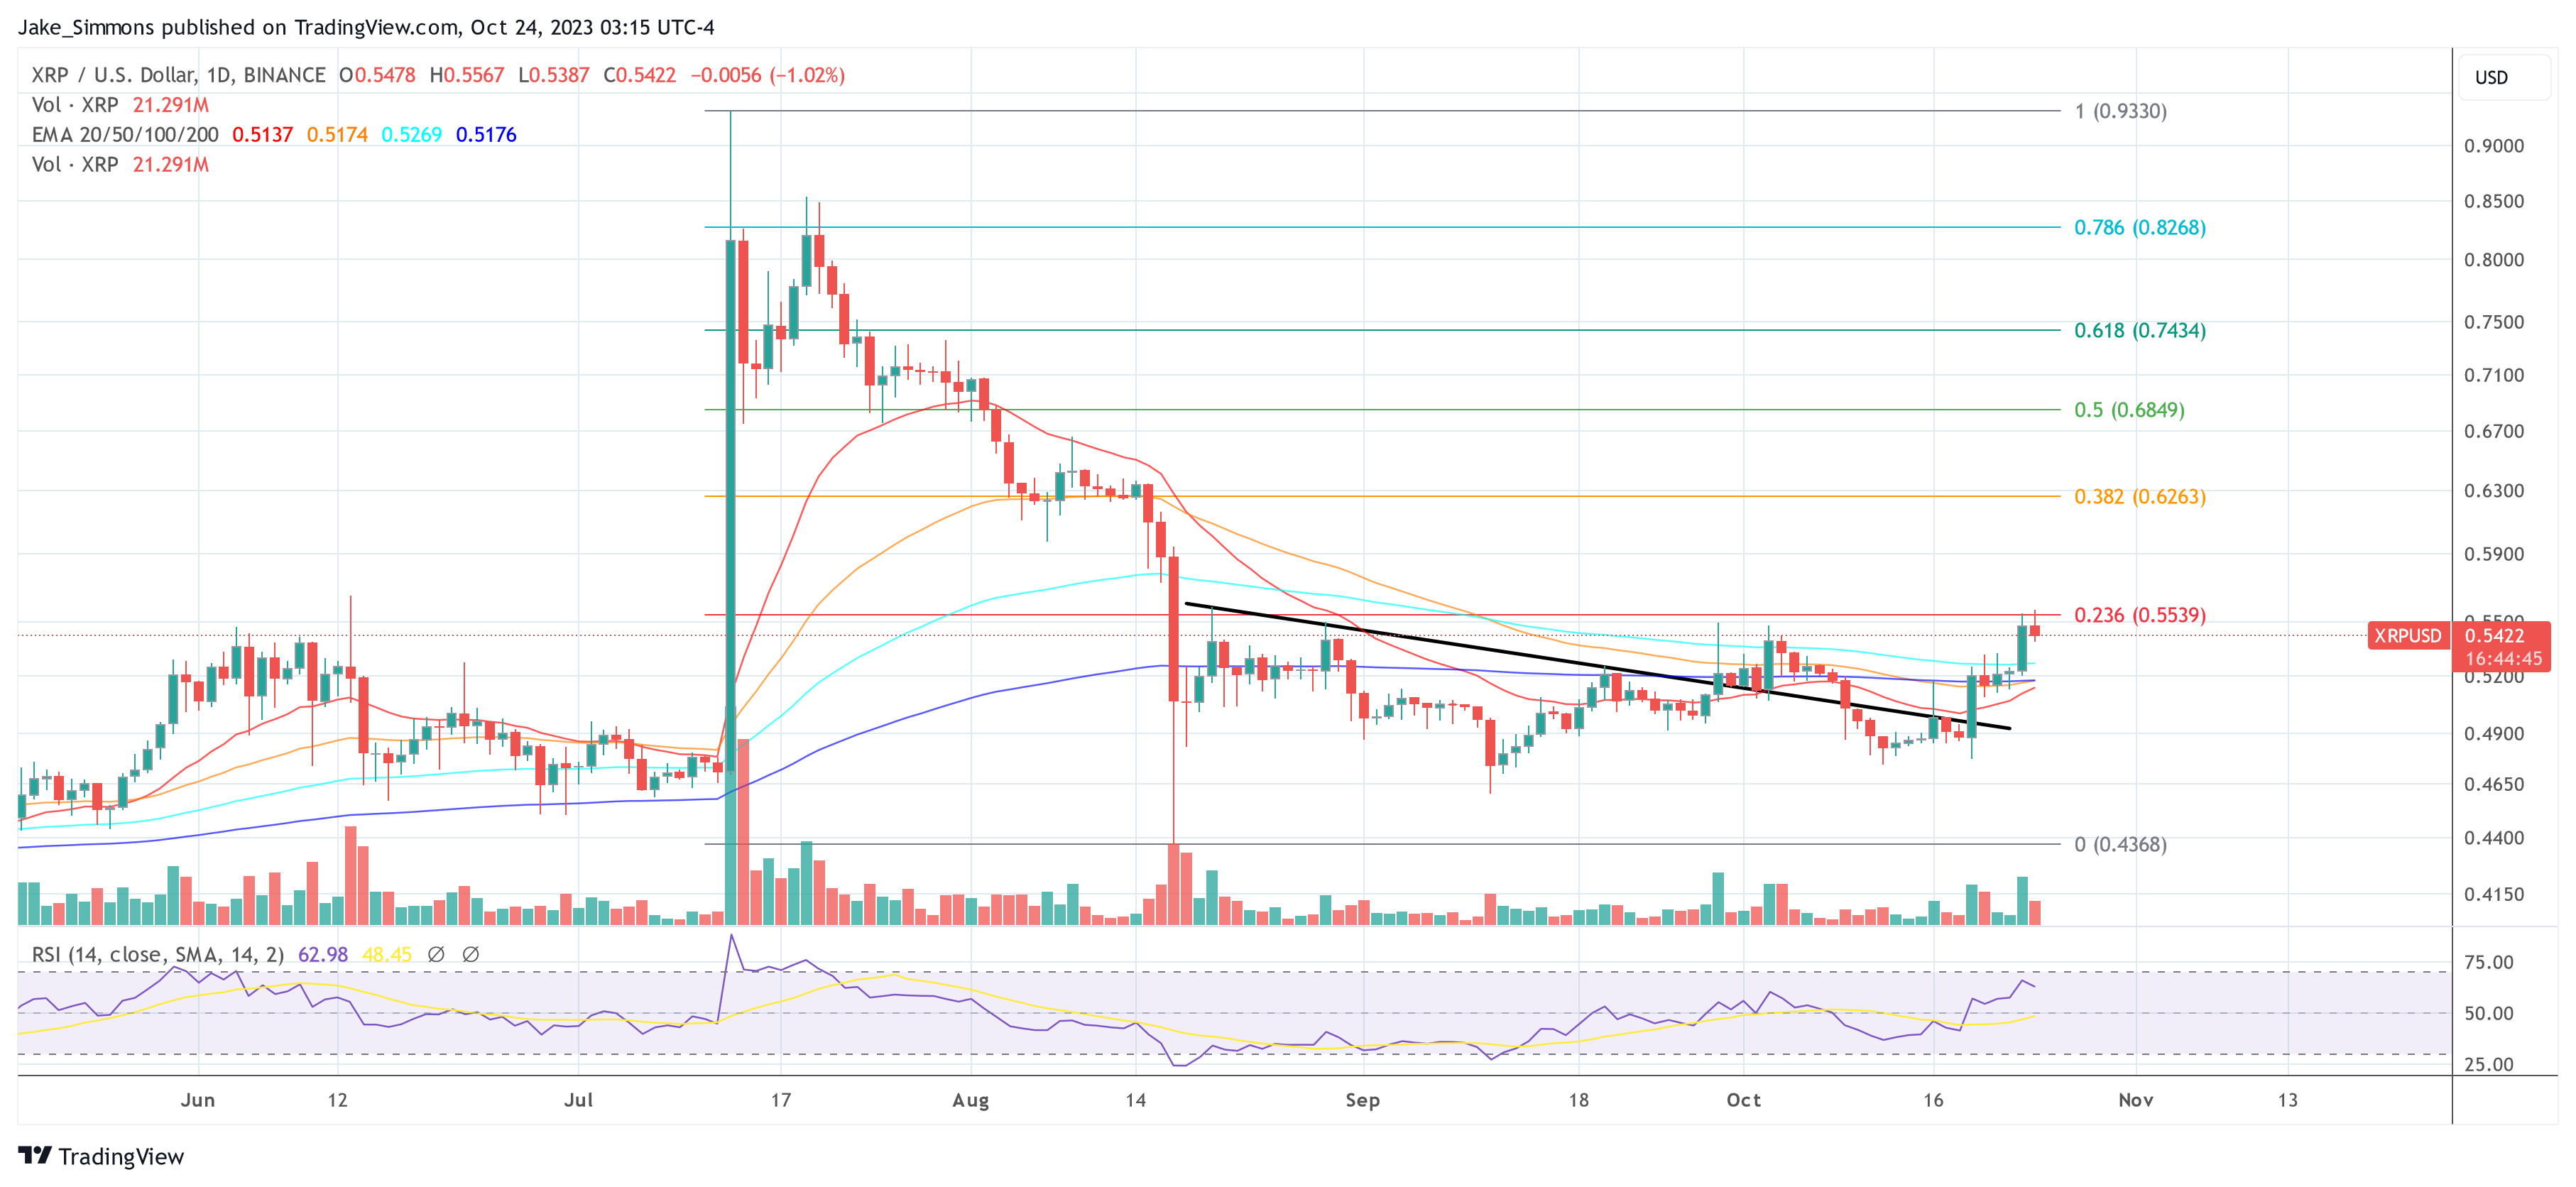
At press time, XRP was trading at $0.5422 and was rejected on the first attempt at the 0.236 Fibonacci retracement level ($0.5539).

XRP price

Mid-Term XRP Price Targets Revealed By Crypto Analyst

Egrag, a crypto analyst, today presented his medium-term predictions for the XRP price on X (formerly Twitter). He backed up his projections with the 3-day chart and pointed out several potential price points that investors should watch out for.

Analysis Of The 3-Day Chart XRP/USD

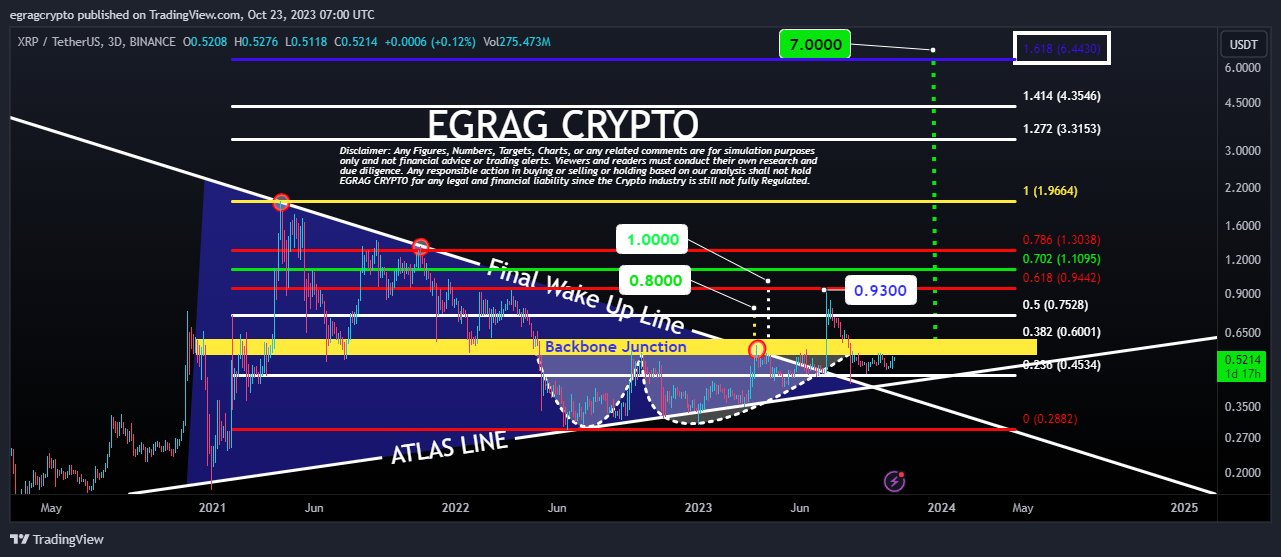
Egrag’s chart, based on Binance’s 3-day XRP/USDT pair, suggests that XRP is currently in the midst of a crucial breakout retest phase. He emphasized the current market dynamics by saying, “What’s happening right now is merely a retest of the breakout; the true pump is still on the horizon, and it’s bound to be epic!”

The analyst highlighted XRP’s triumphant rally from mid-July, which surpassed his original target of $0.85 and rose to a commendable $0.93, surpassing the original price target by 9.41%. Egrag’s 3-day chart shows a descending trend line, which the analyst calls the “Final Wake Up Line.”

According to him, the breakout above the trend line on July 13 after the summary judgment in the lawsuit between Ripple Labs and the US Securities and Exchange Commission (SEC) was the final wake-up call for investors who were still waiting on the sidelines.

XRP price prediction

Currently, the XRP price sits at around $0.52. As the analyst shows in the chart, XRP has experienced a retest of the trend line and passed it with flying colors. In particular, Egrag also points out that XRP was able to stay above the 0.236 Fibonacci retracement level at $0.4534.

This laid the foundation for the XRP price to enter bullish territory at this point. However, the price still faces the resistance zone between $0.55 and $0.60, which Egrag calls the “backbone junction”. Noteworthy is that the upper end of the price range coincides with the 0.382 Fibonacci retracement level. Exceeding this resistance is crucial, especially because it has provided strong resistance several times in the past.

Once this is accomplished, Egrag’s medium-term XRP price targets will come into focus. As explained, he has made an adjustment to his price targets as a result of the July increase. Due to the 9.41%-higher July rise compared to his original price target, Egrag now expects XRP to rise to $1.10 (instead of $1) in an initial rally.

Egrag has also raised the $5.5 price target to around $6, and the previous $6.4 benchmark has been recalibrated to nearly $7. He stated:

So, if we apply this same percentage increase to our upcoming targets, here’s what we can look forward to:

A) $1 * 9.41% = Approximately $1.10

B) $5.5 * 9.41% = Roughly $6

C) $6.4 * 9.41% = About $7

Lower Price Targets

Egrag’s analysis is based on several Fibonacci levels and shows potential resistance points. These are the Fibonacci 0.5 ($0.7528), 0.618 ($0.9442), 0.702 ($1.1095), 0.786 ($1.3038), 1 ($1.9664), and the Fibonacci extension levels at 1.272 ($3.3153), 1.414 ($4.3546), and 1.618 ($6.4420).

Overall, the analysis suggests that XRP’s upward momentum is likely to continue and build on its recent successes. The recent rise in price above the analyst’s lower target suggests robust upside sentiment in the market. However, investors should remain keenly aware of the crypto market’s inherent unpredictable nature and exercise due diligence at all times.

Egrag ended his tweet on an encouraging note for the community, “XRP Army STAY STEADY, We’re advancing step by step towards our exciting targets.”

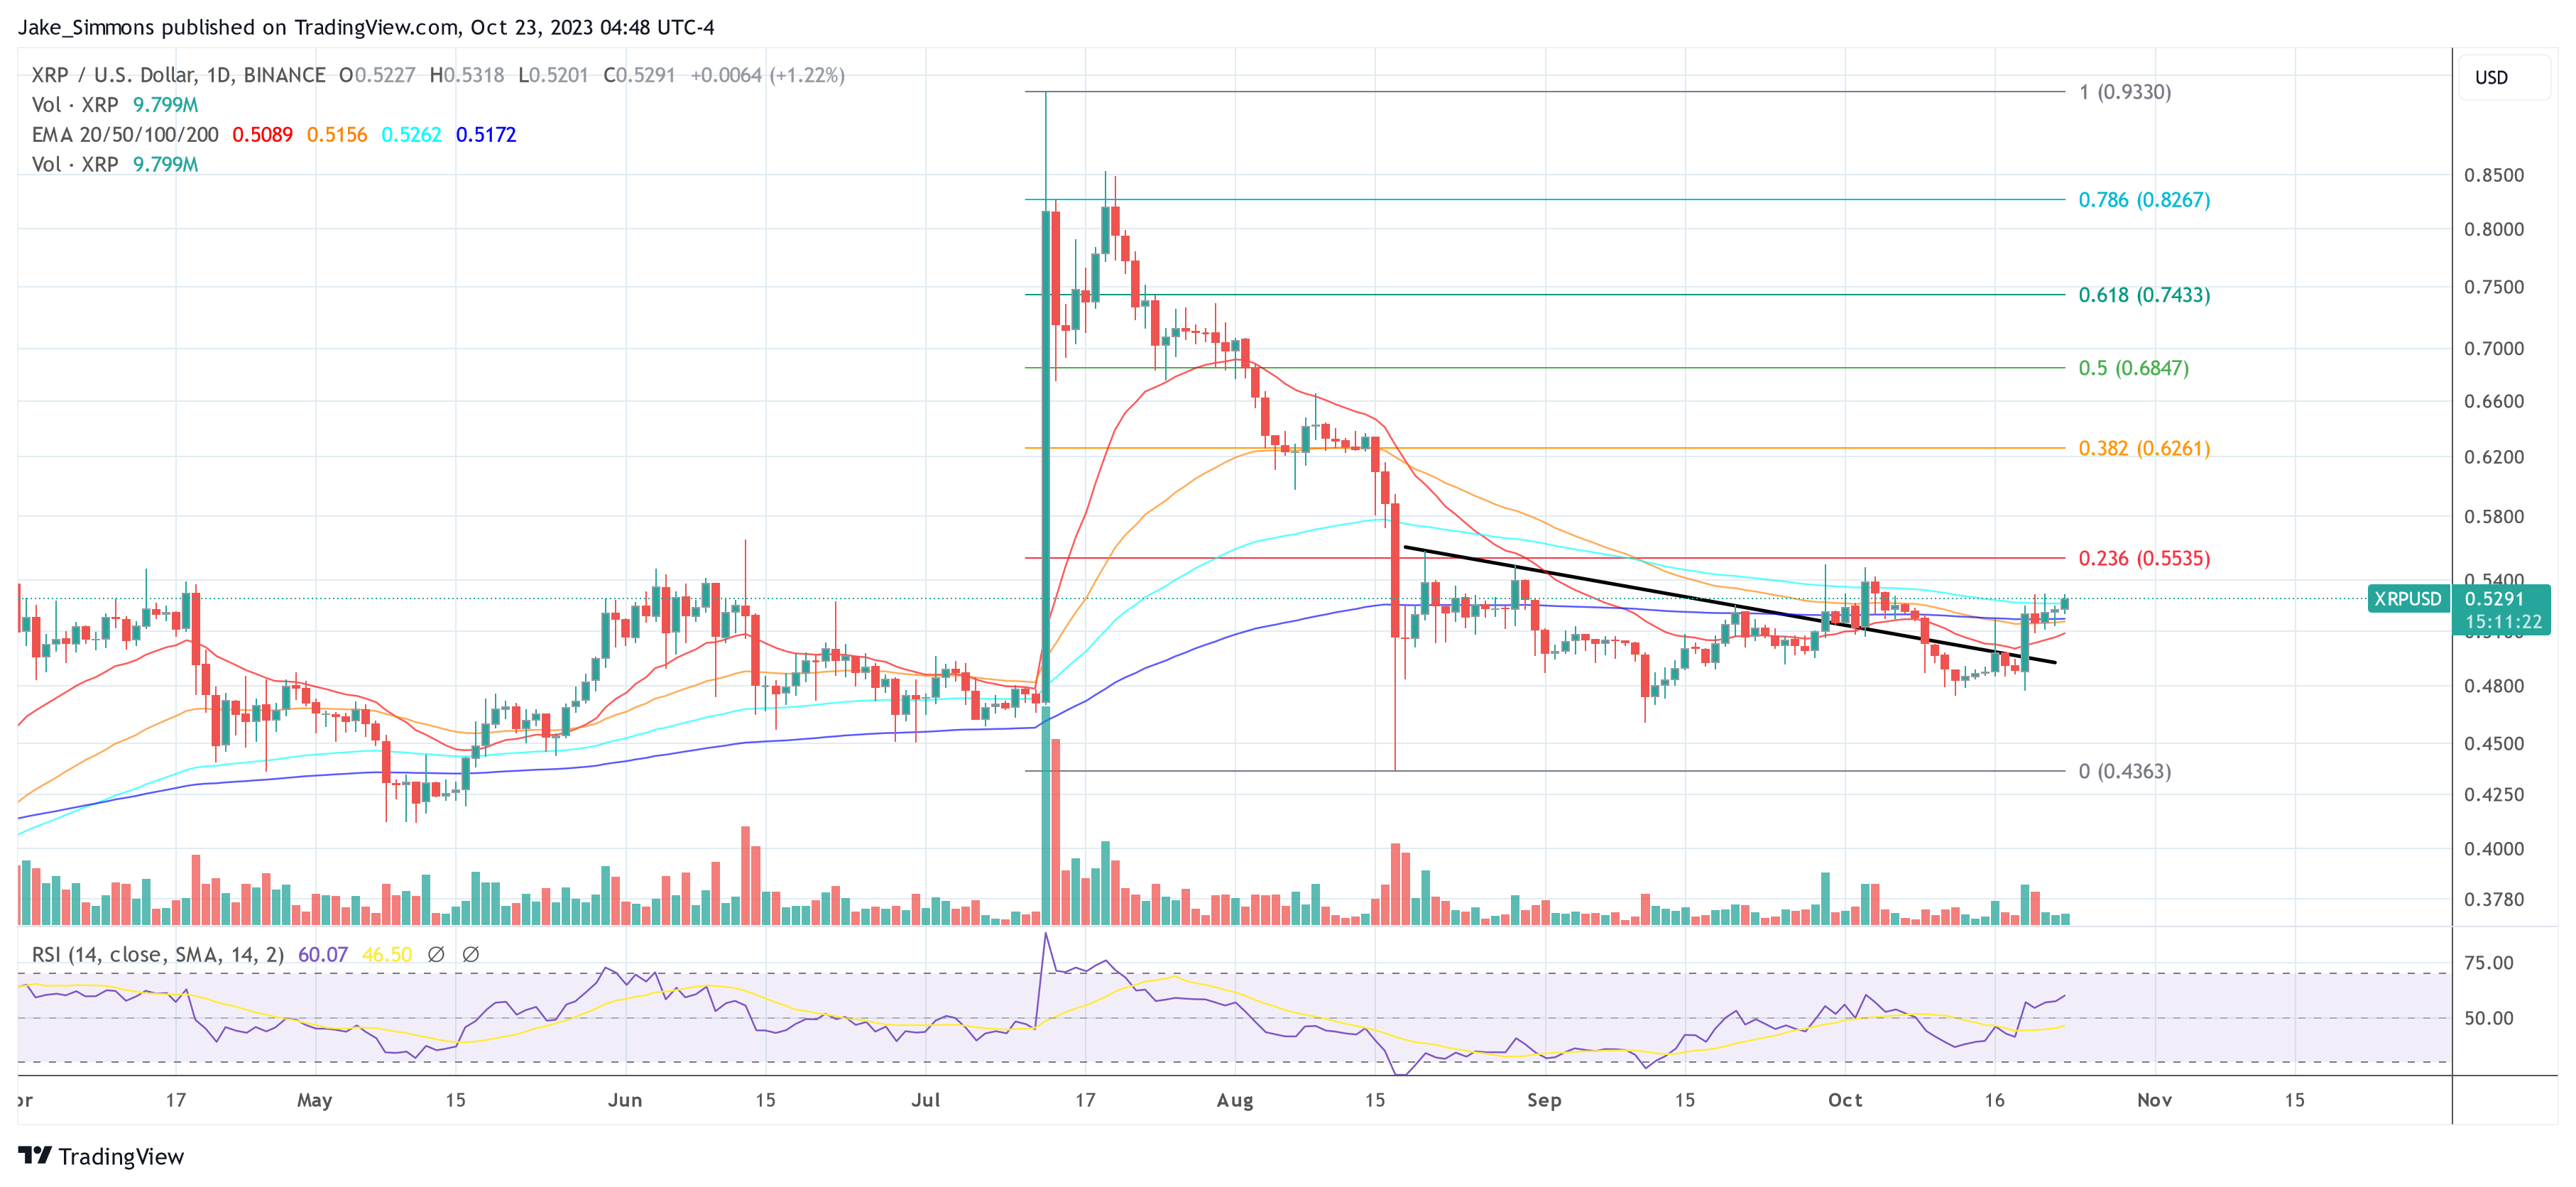
At press time, XRP traded at $0.5291.

XRP price

XRP Dominance Reveals Start Of Next Parabolic Price Move

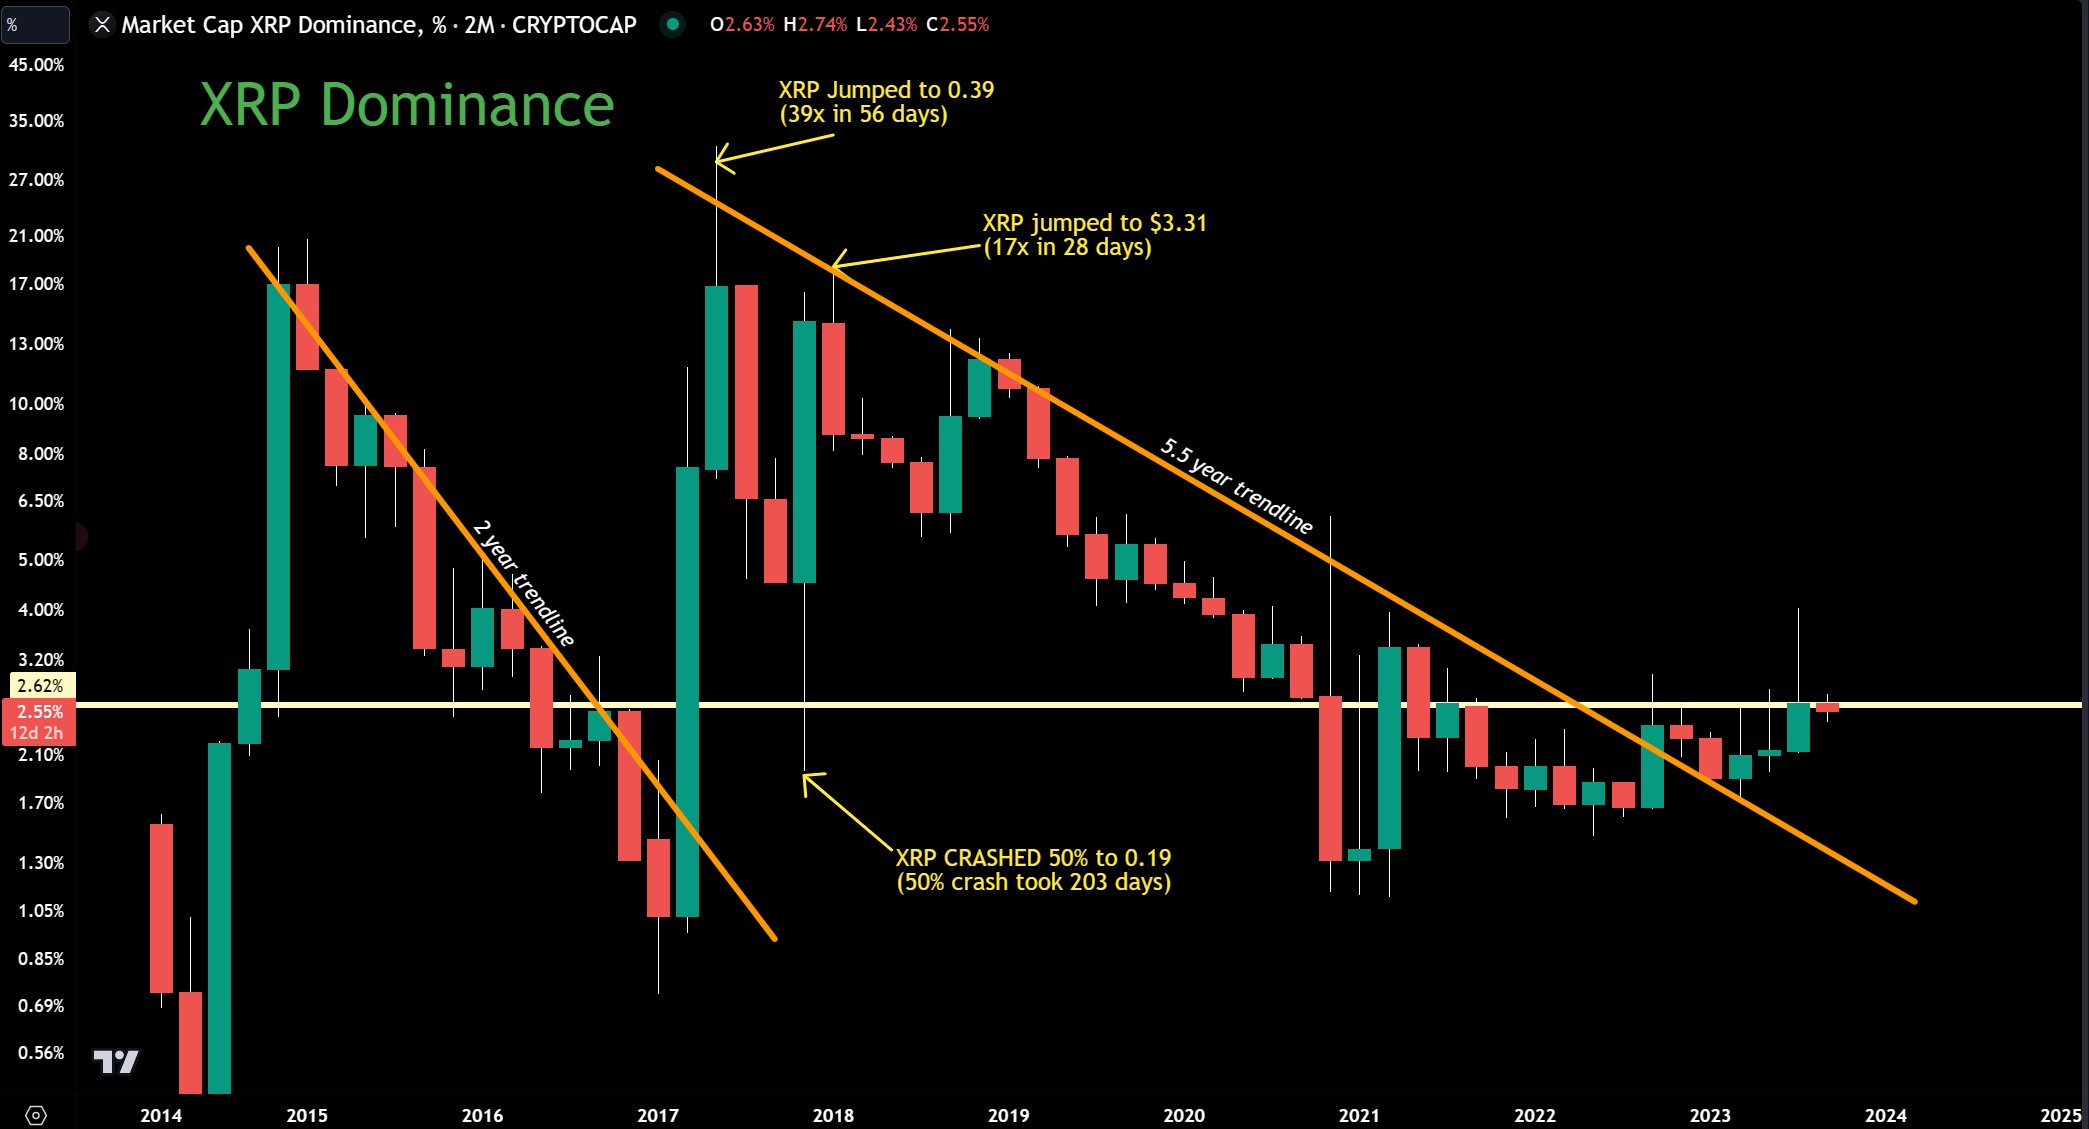
Crypto analyst Jaydee recently took to X (formerly Twitter), sharing another intriguing chart of XRP. The analyst presented the 2-month XRP dominance chart spanning from 2014 till today, shedding light on the cryptocurrency’s historical and potential future price actions. This examination brings to focus a falling trend line and a horizontal resistance line, which showcases a critical XRP dominance level at 2.62% that could be key for the price’s next parabolic move.

XRP Dominance Sits Just Below Key Level

Delving into the historical performance, the chart showcases moments when the token experienced rapid increases and furious drops in terms of crypto market dominance. There was a period where XRP underwent a staggering 39x price jump, reaching $0.39 in just 56 days in 2017. Shortly after, another surge saw the digital asset climb 17x within 28 days, marking its value at $3.31.

XRP Dominance, 2-month chart

Both times, the dominance was rejected at the yellow 5.5-year trend line. This resistance line has consistently acted as a major barrier to XRP’s dominance in the crypto market. Every approach or touch of this line led to significant price actions toward the downside.

Remarkably, the cryptocurrency’s price experienced a similar situation from 2015 to 2017 when the dominance was also held below a falling trend line for more than two years. However, the breakout of this trend signaled a massive price surge as XRP dominance rose from merely 1% to above 30% in just four months in 2017.

Fast-forward to today, the cryptocurrency could be in a similar situation as in 2017. It has breached the trend and is moving beyond the red trend line. However, instead of an instant surge as in 2017, XRP’s dominance now contends with the pivotal 2.62% mark.

According to the analyst’s chart, it’s currently at 2.55%, narrowly missing the critical level. Notably, over the past 14 months, dominance hasn’t achieved a close above 2.62% on the bi-monthly chart. However, if it does surpass this threshold, it might signal the onset of the next parabolic ascent, as outlined by Jaydee.

Currently hitting the yellow resistance line. If we can have a full 2-month candle close above the yellow resistance line, expect the next parabolic move! Is 2024 the year?

Weekly Chart: When ‘Moon’?

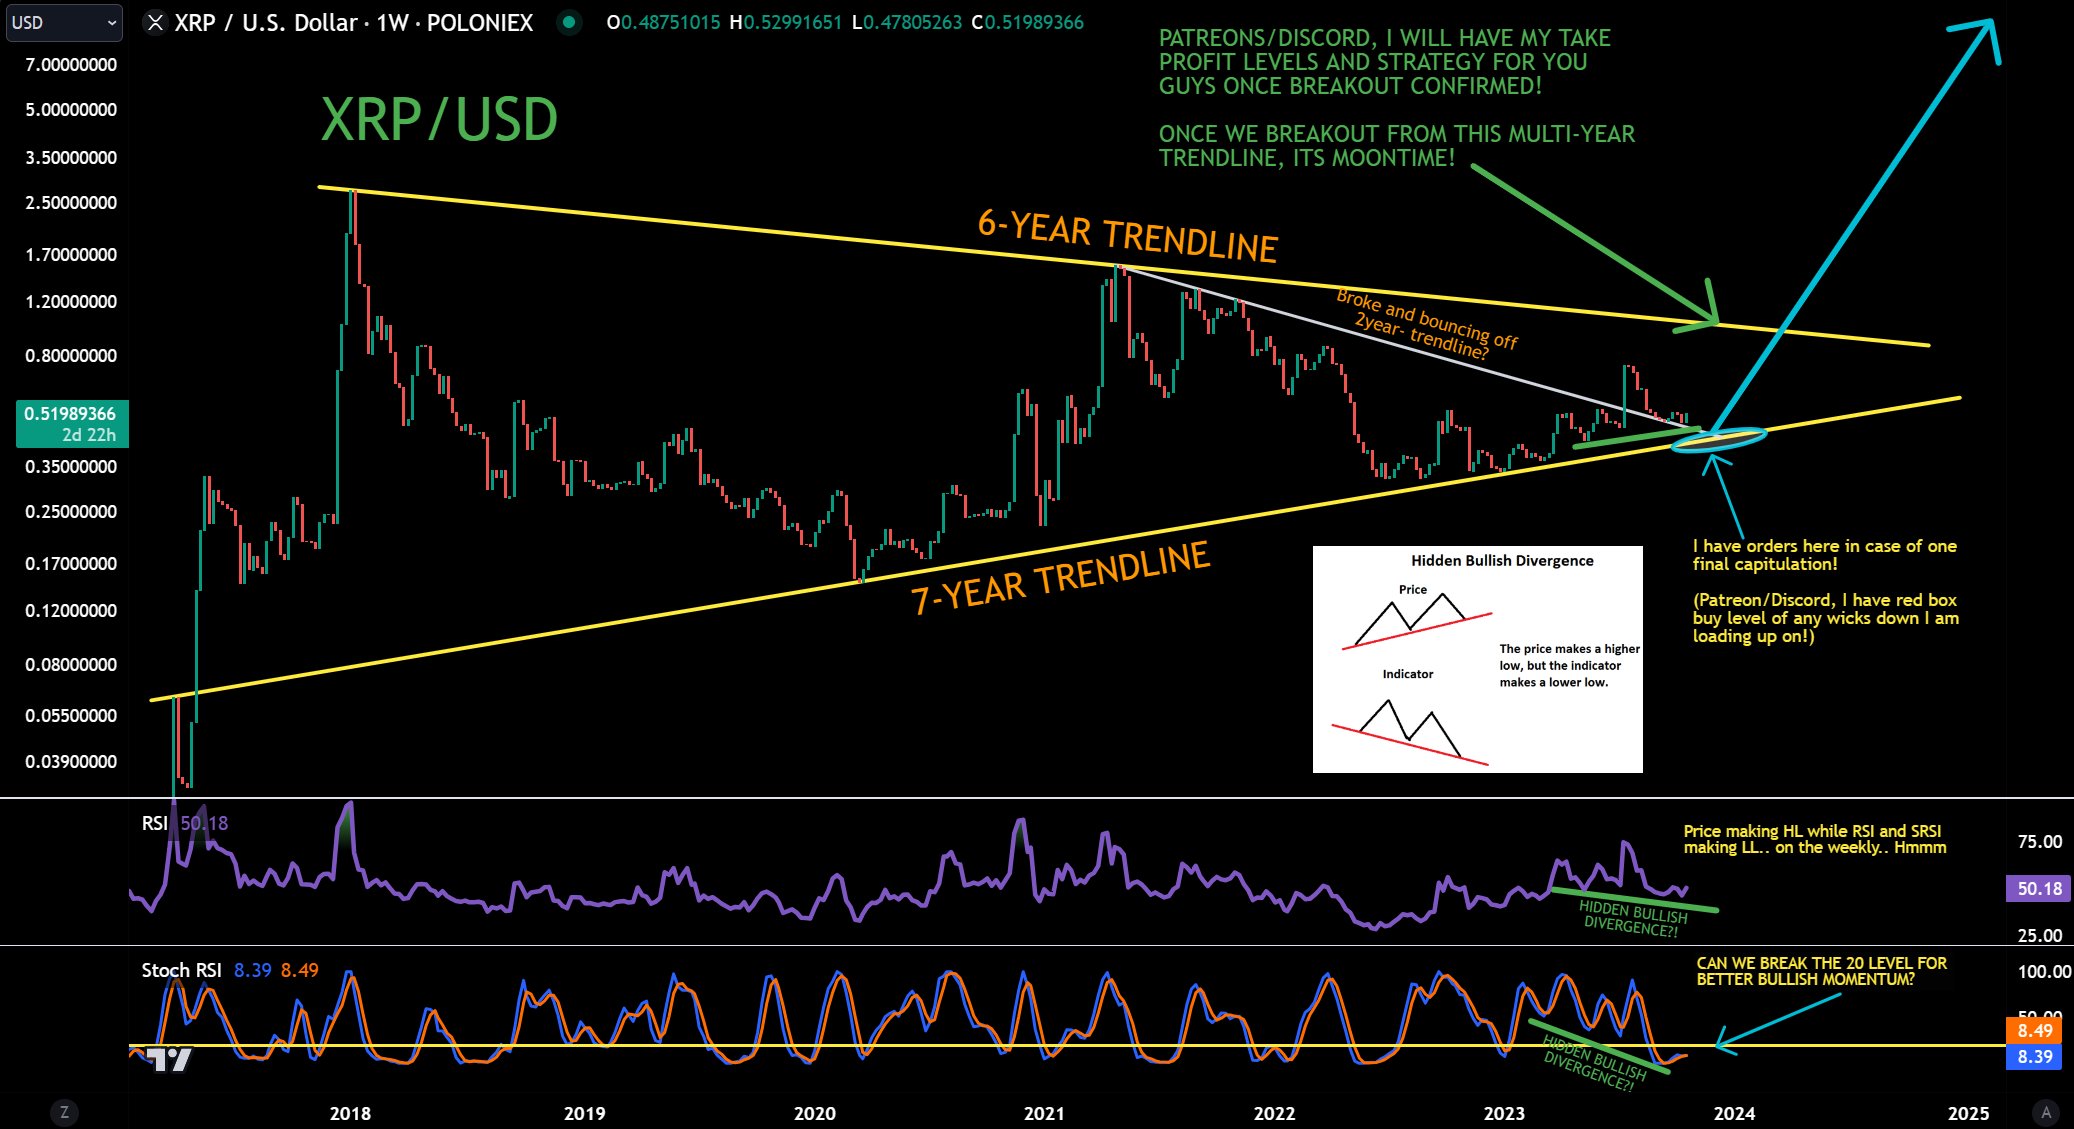
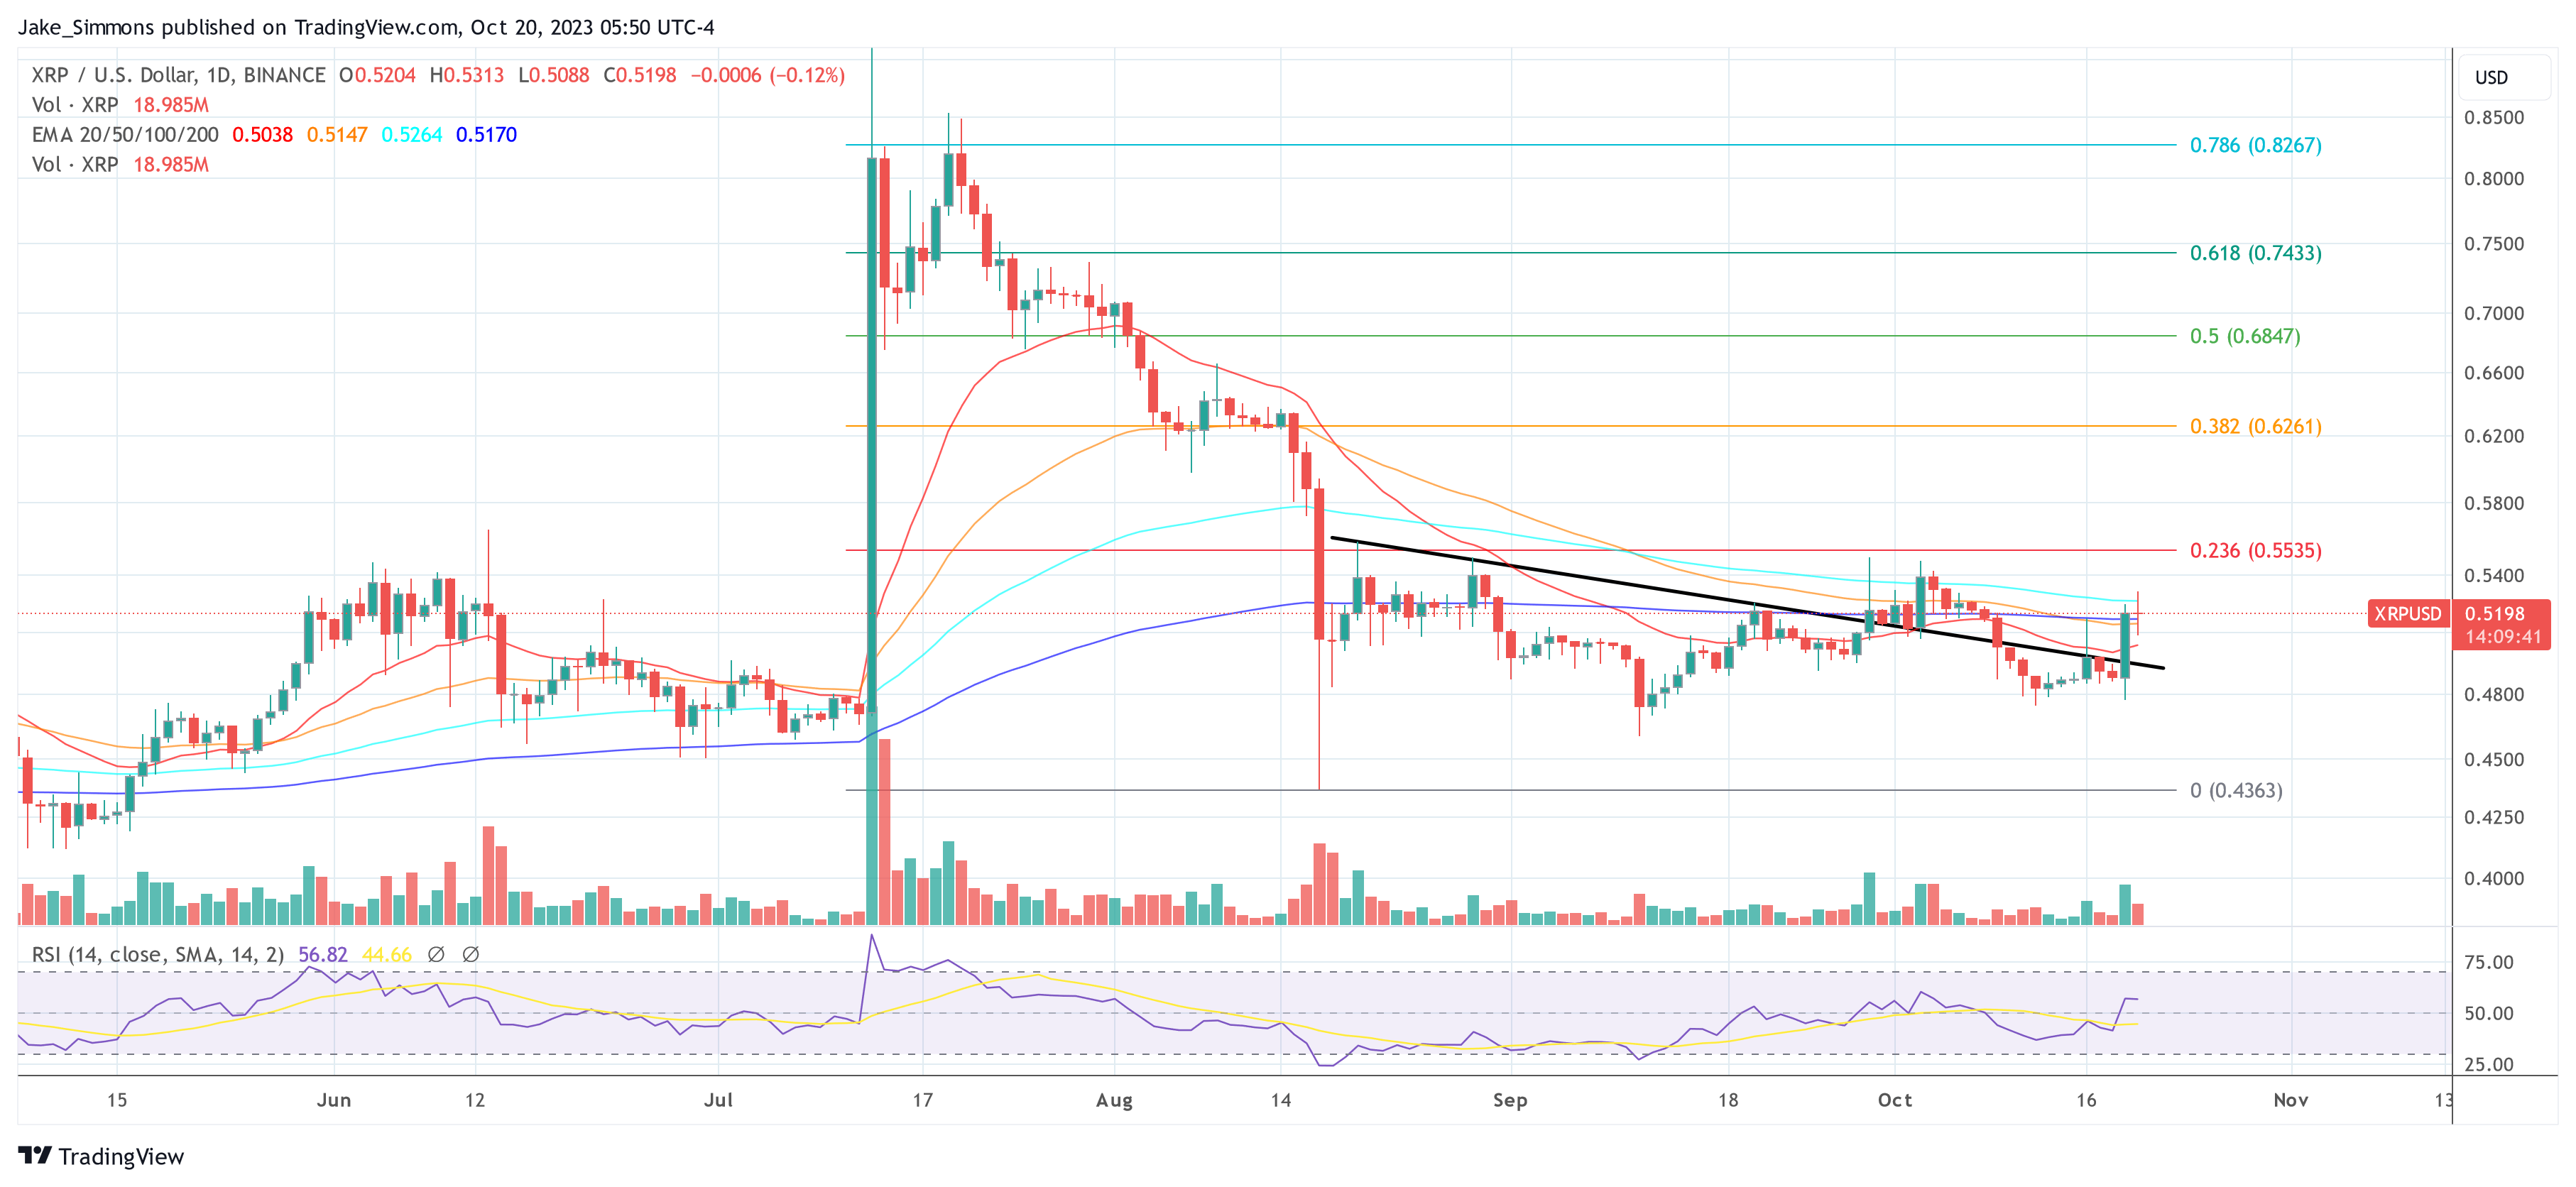
Jaydee shared another chart on X (formerly Twitter) today, stating with regards to the weekly XRP/USD chart: “Still creating higher high (HH) in Price while lower low (LL) in RSI and SRSI on the WEEKLY, while bouncing off the 2-year trend line.” From this, he discerns three key takeaways before XRP can “moon.”

First, the cryptocurrency needs to gather momentum. He suggests that it needs to break past the $0.54 mark, at least on the daily chart. Second, the Stochastic RSI (SRSI) for the weekly timeframe should cross the 20-level, indicating potential for a bullish move. Lastly, the most important point in Jaydee’s analysis is the yellow 6-year trendline. For XRP to witness a parabolic move, breaking this trendline is imperative.

XRP USD chart

At press time, XRP traded at 0.5198.

XRP price

XRP Price Prediction: Rare Bent Fork Pattern Predicts Explosive 3000% Surge To $15

Crypto analyst Egrag Crypto has been continuously bullish on the future of the XRP price and the latest prediction proves this. This time around, the crypto analyst is using a rare Bent Fork Pattern to back up his prediction that the XRP price is headed for double-digits.

The Rare Bent Fork Pattern

Egrag first mentioned the Bent Fork Pattern in a June post while showing a bullish roadmap for the XRP price. In the earlier post, the analyst points out ‘four distinct tracks’. These include the “Track A) Major Historical Support, Track B) Ranging Zone, Track C) Mid-Cycle Top, and Track D) Cycle Top.”

As Egrag explained, the Track D is the cycle top which could see the altcoin’s price reach as high as $15, although not without incidence. Despite expecting a surge, Egrag says that XRP could fall lower before this happens. However, the analyst asks investors not to fret when this happens. Rather, they should see it as an opportunity to buy the cryptocurrency for lower prices.

Now, four months after the initial post was made, Egrag has revisited this Bent Fork Pattern, doubling down on the previous prediction. In a post made on Wednesday, October 18, Egrag updated the previous prediction, showing what needs to happen for the XRP price to reach the lofty price of $15. This would mean at least a 3,000% price increase for XRP if the pattern plays out exactly as expected.

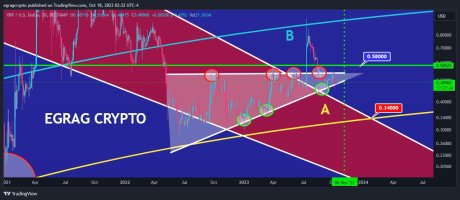
In the chart below, the analyst explains that the XRP price needs to breach the white line for the rally to begin. “the real excitement is if #XRP shatters the ‘White’ Ascending Triangle – get ready for some market-shaking action,” the analyst said.

Bent Fork Pattern XRP price

Looking at a time frame, the crypto analyst asks investors to keep an eye out for the 3rd and 4th week of November as this is when something interesting might happen. “Feeling uncertain about your next move? This might just be your last chance to seize a buying opportunity,” Egrag said in closing.

Not The Only Bullish Chart For XRP Price

Interestingly, Egrag’s XRP price prediction using the Bent Fork Pattern also matches their other predictions for the altcoin. Earlier in the week, Egrag had also put forward another forecast but used the Elliot Wave Theory to present the bull case.

As Egrag notes, the fifth wave is where the main movement really lies where the analyst expects the price surge to happen. Just like with the Bent Fork Pattern, it also suggests a double-digit price level at the top. However, the wave theory takes it a step further with a $27 price mark compared to the Bent Fork’s $15 mark.

Another similarity between both predictions is that the June Bent Fork chart shows the XRP price at $15 somewhere between 2025 and 2026. This is the same timeframe presented using the Elliot Wave analysis, so most of this will likely play out in the bull market.

XRP price chart from Tradingview.com (Crypto analyst Bent Fork pattern 3000% $15)

XRP Price Set For Massive Rally As BlackRock And JPMorgan Make Their Move

Amid the struggles in the cryptocurrency market, recent reports have suggested that the world’s largest asset manager Blackrock, and financial giant JPMorgan might spark a massive bull run for the XRP price as they work simultaneously.

Blackrock, JPMorgan Move Might Affect XRP Price

According to the report, Forbes Senior Contributor, Billy Bambrough, highlighted that Blackrock and JPMorgan are purportedly laying the foundation for an impending surge in the cryptocurrency sector. The report further identified several collaborative cryptocurrency moves taken by the two financial powerhouse firms.

Bambrough pointed out a recent report that claims that the asset manager recently utilized JPMorgan’s Ethereum-based Onyx network and tokenized collateral service. 

Blackrock reportedly used the network to tokenize shares from one of its financial market funds, which was later transferred to the London-based Barclays in an over-the-counter (OTC) derivatives trade.

Over-the-counter (OTC) derivative operations occur between two parties. However,  the specifics of the order quantity, cost, and other information of Blockrock’s transactions with Barclays remain concealed from the public.

Following the report by Bambrough, it was revealed that Blackrock became the first Wall Street giant to make use of JPMorgan’s blockchain-based collateral settlement system. This was part of a move that Blackrock’s Chief Executive Officer Larry Fink, has stated will pave the way for the “next generation for markets.”

The Blackrock CEO’s previous statement in an annual letter to shareholders where he emphasized blockchain technology as “very important” in the past year was also mentioned in the report. Fink highlighted the role that blockchain technology plays in their financial operations.

Blockchain technology enables traditional assets to be “tokenized” on a public ledger, potentially simplifying and lowering the cost of transferring anything from stocks and bonds to real estate and alternative investments like art.

Due to this, Billy Bambrough believes that there will be a significant increase in the price of digital assets such as XRP, Bitcoin (BTC), and Ethereum (ETH) as a result of BlackRock and JPMorgan entering the cryptocurrency industry, considering their connections to the traditional market. In addition, Ripple is also aiming to establish the XRP Ledger as a crucial platform for the tokenization of real-world assets.

BlackRock using XRP would not doubt have an immense impact on the XRP price. An example of the kind of rally it could trigger is what happened back in June with Bitcoin when the asset manager announced it had filed for a Spot Bitcoin ETF.

Significance Of Blackrock’s Transaction Via JPMorgan Blockchain

So far, Blackrock’s partnering with JPMorgan marks a new milestone for the financial firm. Blackrock’s recent transaction via JPMorgan’s blockchain indicates a crucial contribution to the volume of the Ethereum-based network Onyx.

Additionally, the operation could unveil a new world of possibilities for established financial institutions which enables them to free up capital and boost efficiency across separate markets, as a spokesman from JPMorgan told Bloomberg.

JPMorgan’s Head of Trading Service Ed Bond, also stated that “institutions on the network can use a wider scope of assets to meet any collateral requirements they have on the back of trading.”

XRP price chart from Tradingview.com (BlackRock JPMorgan)

Analyst Predicts XRP Price To Hit $100: Here’s How To Become A Millionaire

Several crypto analysts and influencers in the XRP community have continued to make their predictions as to the future of the XRP price. This time, another has predicted the token to rise to $100 and given tips on how one could make money from this occurrence. 

How To Make $1 Million From XRP

In a post shared on the X (formerly Twitter) platform, Crypto Analyst and XRP influencer Crypto Assets Guy stated that XRP had the potential to reach $100 in 3-5 years. As to the best way XRP holders could benefit from such a significant increase in XRP’s price, he opined that holding 10,000 XRP is enough for those holding long-term. 

He further calculated the potential returns that these holders stood to gain if his prediction were to come through. Going by this, holders could gain as much as $1 million, assuming they were holding 10,000 XRP and each token was worth $100 in the next three to five years.

Some seemed to agree with the analyst’s prediction, with one particular X user stating that XRP “should” break $100 long before then, especially due to institutional interests. On the other hand, many seemed to disagree with the prediction and stated that it was almost impossible for the token to hit $100 by then.

There was also the category of people who seemed tired of such predictions as they stated that they had heard similar predictions in the past (years back), and still, there hasn’t been any notable increase in the token’s price. 

XRP Price Prediction Factual Or Otherwise?

The future XRP price is arguably one of the trending topics in the X crypto community, as analysts and influencers have continued to make predictions on the token’s trajectory. While some have based their prediction on certain indicators and fundamentals, others seem to be making these predictions without any conviction or any basis for it. 

With this in mind, some members of the XRP community have gone as far as accusing these influencers of simply making these predictions for engagement farming. Interestingly, the influencer Crypto Assets Guy who had made this $100 prediction was the same person who had some days back stated that XRP wasn’t going to hit “$10000, $1000, $50 or $10 any time soon.”

Although one can’t assertively state what he meant by “any time soon” in this context, it raises eyebrows as to the analyst’s recent prediction, considering that he seemed less optimistic about XRP’s future trajectory just days back. 

XRP  price chart from Tradingview.com (XRP millionaire)

‘Extra Bullish’ On XRP? Crypto Analyst Pinpoints The Perfect Timing

In a detailed chart analysis of the XRP/USD trading pair, seasoned crypto analyst Dark Defender has shed light on several significant indicators that point towards a bullish trajectory for the popular cryptocurrency.

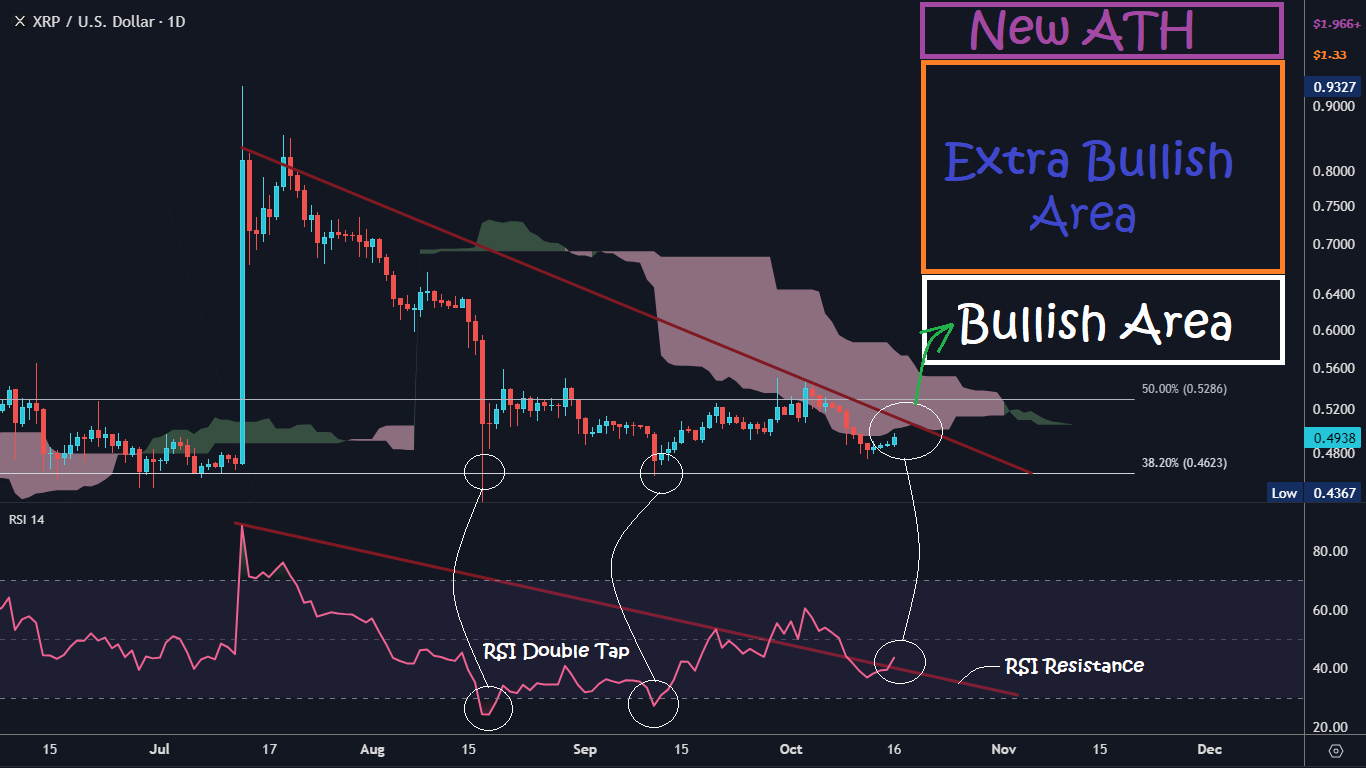
Taking to Twitter to share his insights, Dark Defender remarked, “Morning All. Hope you had a great weekend. XRP in the daily time frame is still within our price range. Above $0.52 – $0.55 is a challenge, first to break the resistance & stay above the Ichimoku Clouds.”

This sentiment aligns with the depicted interaction of XRP with the Ichimoku Cloud on the chart, a renowned technical tool that offers insights on support, resistance, and momentum. Furthermore, the analyst outlined specific price brackets, stating that XRP is: “Bullish above $0.55 – $0.66, Extra Bullish between $0.66 – $1.33, and envisions a New All-Time High Above $1.966.” These delineations echo the marked areas on the chart, notably the “Bullish Area” and “Extra Bullish Area.”

XRP price prediction

When To Get Extra Bullish On XRP

One of the primary takeaways from the chart is the “RSI Double Tap” event. For those unfamiliar, the Relative Strength Index (RSI) is a momentum oscillator that measures the speed and change of price movements. An RSI reading below 30 is typically considered oversold, while an RSI above 70 is seen as overbought. The “Double Tap” indicates that XRP has been undervalued in mid-August and mid-September, but found a strong foundation.

Further boosting the bullish sentiment is the declining trendline in the RSI that the XRP price recently broke out of, implying a potential shift in momentum. Remarkably, the RSI broke out of the downtrend for the first time at the end of September.

However, the XRP price could not keep this momentum, and as a result, the RSI once again fell below the trend line drawn by Dark Defender. But in recent days, another breakout has occurred, which could predict bullish price movements.

Moving onto the price action, the chart depicts XRP’s consistent interaction with the Ichimoku Cloud, a renowned technical tool that offers insights on support, resistance, and momentum. The fact that XRP is inching closer to entering the ‘Bullish Area’ of the Ichimoku Cloud is quite significant. This could mean that the asset is on the verge of a bullish reversal if it climbs back above $0.52.

Moreover, the chart also demarcates two distinct areas labeled “Bullish Area” and “Extra Bullish Area.” The latter is situated between the $0.66 and $1.33 mark, suggesting that if XRP manages to break above the lower boundary and hold above this price point, we might witness intensified bullish momentum. The XRP price could then more than double before major resistance is expected at the $1.33 level by Dark Defender.

Additionally, the Fibonacci retracement levels, drawn from the peak to the trough of the price movement, emphasize the 50% level at $0.5286 as a critical resistance point. Breaking through this level might propel XRP toward the “Extra Bullish Area” as specified by the analyst.

Concluding his tweet, Dark Defender aptly stated, “The clock is ticking,” indicating the expectation that the cryptocurrency could perform a strong bullish move into the “Bullish Area” between $0.55 and $0.66 at any time.

In summation, while the crypto market remains unpredictable, the technical indicators for XRP, combined with Dark Defender’s analysis, suggest a promising bullish trajectory. But as always, investors should conduct thorough research and remain cautious in their investment decisions.

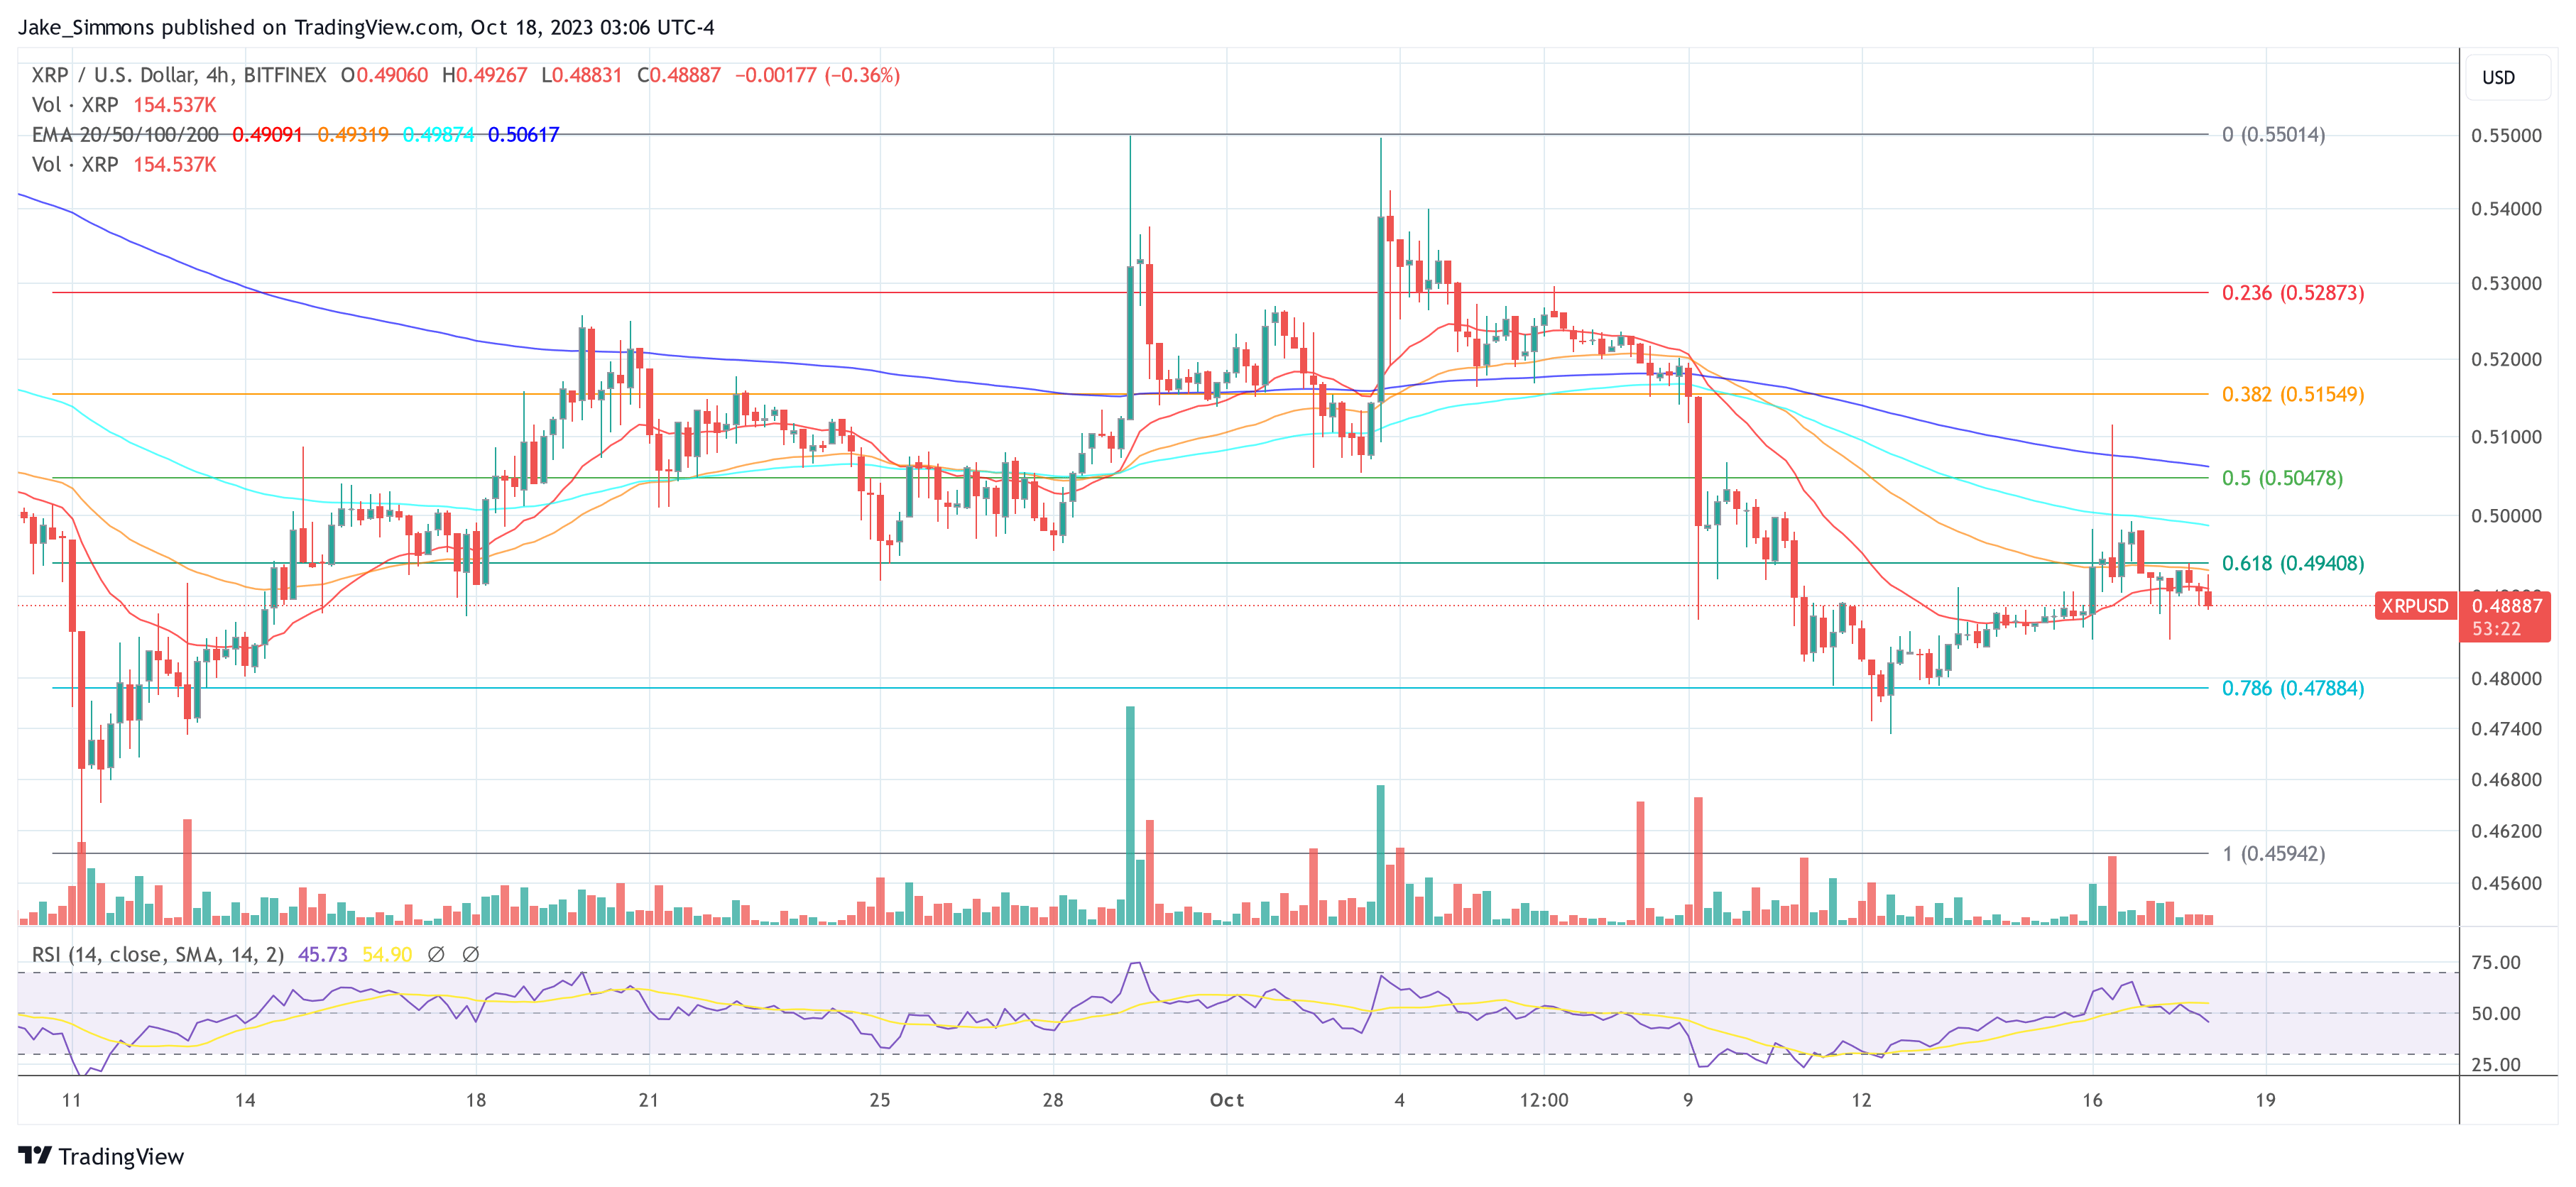
At press time, XRP traded at $0.4888.

XRP price

Crypto Research Firm Predicts 200% XRP Price Rally To $1.5

As the XRP price and its future trajectory continue to be a hot topic for debate, crypto research firm Sistine Research has weighed in on this debate using technical analysis. XRP holders are set to love this one, as their prediction is bullish. 

Where Is XRP Price Headed?

In a post shared on the X (formerly Twitter) platform, Sistine Research stated that, despite the current market outlook, XRP is one of the tokens with a bullish chart in the crypto market as of now. 

Their bullish sentiment was projected in their post, which contained a weekly chart that suggested an accumulated pattern since May 2022, with the XRP price having the potential to rally to as high as $1.5, an over 200% increase from its current price of $0.49.

XRP price Sistine Research

The research firm also used the XRP/Bitcoin chart to further drive home their bullish sentiment. The chart showed XRP’s potential to outperform the flagship cryptocurrency with its projected rally to $1.5. However, it seems that the XRP price could decline to the $0.40 support level before any massive rally.

Sistine Research XRP price

Clarification On The Charts

Sensing that there was some form of skepticism from many in the crypto community, Sistine Research released a subsequent post where it further elaborated on its technical analysis. It explained that from the charts, it was evident that there is a long-term accumulation that is trending upwards. 

According to them, during this period, buyers are willing to dive into the market and provide support to the token at higher and higher prices, likely suggesting that a potential retracement or dump by the bears doesn’t faze the bulls

Sistine alluded to the fact that the most recent pump on the chart was larger than the previous pump. This supposedly shows that buyers are active as they are still accumulating at higher prices rather than waiting for a decline before going in. While all this is happening, sellers are still holding their tokens as they anticipate higher prices before selling. 

They compared this XRP chart to the BTC chart in 2018, when buyers got weaker, and sellers had control of the market, selling every pump at lower prices. 

The research firm also suggested that DOGE’s chart is currently experiencing something similar (to the 2018 BTC chart) as they stated that the XRP price chart is “objectively bullish” in comparison to the meme coin, which is “exhibiting major signs of buyer exhaustion.”

As of the time of writing, the XRP price is trading at $0.49, around 0.30% in the last 24 hours, according to data from CoinMarketCap. 

XRP price chart from Tradingview.com (Sistine Research $200 rally to $1.5)

Elliott Wave Theory Forecasts XRP Price Of $27 By 2026: Crypto Analyst

Renowned crypto analyst Egrag presented a compelling Elliott Wave analysis on the potential XRP price trajectory in a tweet today. Drawing attention to the inner workings of the Elliott Wave theory, he highlighted that XRP has entered Wave 3 in recent days, which in particular plays a transformative role in determining the course of asset prices.

In Egrag’s words: “XRP aiming to $27 – Wave 1 inside Wave 3: Diving into the Elliott Wave theory as we explore the potential for XRP to reach $27! Wave 3 is typically a game-changer in the Elliott Wave theory.”

Elliott Wave Analysis: Wave 3

The crypto analyst further elaborated that Wave 3 emerges as the trend’s dominant force, outshining other waves in size and influence. This stage often witnesses positive news that prompts fundamental analysts to revise their outlook, giving a boost to upward momentum.

Notably, prices tend to shoot up rapidly during this phase, with minimal corrections. Investors who try to enter the market on a pullback often find themselves missing out as the third wave gains traction. At the outset, pessimistic news might still dominate, with most market participants maintaining a bearish stance. However, as Wave 3 unfolds, a significant shift towards bullish sentiment becomes evident among the majority.

Deep-diving into the XRP analysis, Egrag points out that the green wave count reflects the Grand Cycle spanning from 2014 to 2018. This cycle commenced with Wave 1 and was succeeded by a corrective Wave 2. “Presently, XRP finds itself amidst the thrilling currents of Wave 1 within the Grand Cycle’s Wave 3. Prepare for a fascinating journey ahead!” he noted.

He further elucidated that XRP has adeptly navigated through the initial waves and is now setting its course for the anticipated Wave 3, which he predicts will touch the Fibonacci 1.618 mark at $6.5, followed by a brief correction. The subsequent and concluding phase, Wave 5, according to Egrag’s analysis, will propel the XRP price to a staggering $27.

A Deep-Dive Into Egrag’s XRP Price Chart

Egrag’s analysis delineates the intricate voyage of the XRP price through the conceptual lenses of the Elliott Wave theory. The chart starts its narrative in March 2020, when the subordinate Wave 1 began. This initial phase witnessed XRP escalating to a prominent peak of $1.96, buoyed by a favorable outcome in Ripple’s legal battle with the US Securities and Exchange Commission (SEC).

Elliott Wave analysis for XRP

Subsequent to the apex of Wave 1, the chart navigates through a territory marked by correction, which is dubbed Wave 2. In this segment, the XRP price experienced a pullback and dropped to a low of $0.4313. This corrective phase, although incisive, respects the sanctity of Elliott wave norms by not falling below the initial point of Wave 1.

With the transition into the Wave 3 area, bullish momentum is currently starting to build up. Egrag, with a combination of analysis and foresight, expects the XRP price to rise beyond the zenith of Wave 1 and target the Fibonacci extension of 1.618, valued at around $6.57. This upside, plotted on Egrag’s chart, is expected to end sometime in 2024 or 2025.

Wave 4, as described by Egrag, provides for a corrective move following the upswing of Wave 3. At this point, the XRP price is expected to drop heavily and find support at $1.96, which interestingly mirrors the peak of Wave 1.

In Egrag’s chart, Wave 5 emerges as the pinnacle of the bull market. In this decisive phase, the analyst projects his most audacious forecast for the XRP price trajectory. Anticipating a monumental bull surge in 2025, he envisions XRP oscillating between Fibonacci extension levels of 2.272 and 2.414, corresponding to price points of $23.63 and $31.20. Egrag, averaging the values, subsequently forecasts a price target of $27 for XRP.

At press time, XRP traded at $0.4934.

XRP price chart

How Ripple’s Rumored Token Burn Could Affect The XRP Price

XRP has struggled to regain bullish price momentum this month, with the crypto going on six days of red candle close last week. The XRP community appears to be feeling the effects of this lack of momentum, as speculations have begun to circulate about a potential catalyst for the next XRP price surge.

Word on the street now is that Ripple plans to burn the 41.9 billion XRP tokens they have locked up in escrow. Although this hasn’t been confirmed yet, some say this move could send the value of XRP skyrocketing.

The Potential Impact Of A Full Escrow Token Burn

Ripple, the company behind the XRP cryptocurrency, currently holds billions of XRP in escrow. As of the time of writing, Ripple has 41.9 billion XRP locked up, with 1 billion XRP released from escrow each month. This huge stockpile of XRP has led to criticism that Ripple could flood the market at any time and crash the price. 

However, rumors are swirling that Ripple may burn all of the XRP in escrow, potentially spiking up the price of XRP. If Ripple eliminated all of the escrowed XRP, it would significantly decrease the total supply of XRP and could positively impact the market price. 

The rumor was started on social media X by the account @realXRPwhale and has elicited a response from community members. Although unverified, the account posted the update of Ripple, burning the “50 BILLION $XRP.” 

While some have shown enthusiasm regarding the price effect if this happens, others have dismissed it as just a baseless rumor. 

Ripple XRP price XRPUSDT

What’s Next For XRP?

Ripple has never acknowledged or refuted rumors that it will destroy all of its tokens held in escrow, but this is not the first time that such a rumor has emerged suggesting that the technology company will do so. But the possibility of this happening is not completely out of the question, as Ripple CEO Brad Garlinghouse mentioned in a 2021 interview.

Other factors that could drive up XRP prices include major partnerships by Ripple and a clear outcome of the ongoing case with the US Security and Exchange Commission. However, one thing that’s going so well is the increased recognition of XRP after a US judge declared that the token isn’t a security. 

At the time of writing, XRP is trading at $0.4863 and is within a range as it looks to break above $0.5. According to an analyst, the price of XRP could get a boost from a blooming altcoin season if Bitcoin’s dominance continues to decline. Research has shown that October has historically seen more losses than gains for XRP.

Cover image from Unsplash, chart from Tradingview