The former Alameda Research CEO placed part of the blame for FTX’s failure on CZ, while the Binance CEO claimed Ellison’s offer to buy the firm’s FTT holdings was the cause.
Cryptocurrency Financial News
The former Alameda Research CEO placed part of the blame for FTX’s failure on CZ, while the Binance CEO claimed Ellison’s offer to buy the firm’s FTT holdings was the cause.

Uniswap launched a beta version of its wallet app for Android, paving the way for a Google Play Store launch once testing is complete.
In a recent research report from JPMorgan, the financial firm has predicted a harsh drop for one Bitcoin metric, forecasting a potential decline of the Bitcoin Network Hash Rate by 20% leading up to the Bitcoin halving in April 2024.
In the report, JPMorgan stated that the Bitcoin mining industry is at a crucible stage leading all the way to the Bitcoin halving in April 2024 and beyond. This is because the approval of a Spot BTC exchange-traded fund (ETF) could spark a rally against the backdrop of record hash rates and the impending block reward halving that threatens the industry’s revenues and profitability.
The report highlighted that the total four-year block reward opportunity is estimated at $20 billion, due to the current price of Bitcoin (BTC), which is 72% lower than its all-time high in 2021. This figure represents a significant drop from its peak of $73 billion in April 2021 and has fluctuated around $14 billion and $25 billion since the past year.
As such, the financial firm expects the Bitcoin mining sector to see the predicted 20% hash rate drop at the next Bitcoin halving in April 2024.
“We estimate as much as 80 EH/s (or 20% of the network hash rate) could be removed at the next halving (April ‘24) as less-efficient hardware is decommissioned,” the report reads.
Bitcoin halving is an event that aims to control inflation and it involves the reduction of Bitcoin miners’ rewards by half, and it takes place roughly every four years after miners solve 210,000 blocks.
Analysts Reginald Smith and Charles Pearce noted in the report that the bank favors mining operators that can offer the best relative value in light of the existing hash rate, operational efficiency, power contracts, and more.
JPMorgan chose Bitcoin mining company CleanSpark (CLSK) as its top pick among several companies listed by the firm, highlighting that the mining company offers the best balance of scale, growth potential, power costs, and relative value.
In addition, the firm highlighted the significance of other mining firms it listed. These include Marathon Digital (MARA), Riot platforms (RIOT), and Cipher mining (CIFR).
According to the firm, Marathon Digital is the largest mining operator, with the highest energy costs and lowest margins. Meanwhile, Riot has lower energy costs and liquidity, but Cipher has the lowest power costs with limited growth.
The firm also included an outweight rating table and price targets of the mining operators in the report.
The high cost of mining and the removal of inefficient hardware have been seen as some of the factors that tend to affect the Bitcoin mining industry.
Large amounts of electricity are needed for mining, and at first, this makes it too expensive for miners to continue their operation. Nevertheless, many also tend to come back whenever the next bullish cycle drives Bitcoin’s price to unprecedented levels.

Stars Arena negotiated with the attacker over the course of four days, eventually recovering 90% of funds in exchange for an agreement not to prosecute.
Cardano is one of the most actively developed blockchains with an ambitious roadmap. Its native ADA token has seen immense growth since launching in 2017. This article explores what’s next for Cardano prices.
Cardano is an open-source proof-of-stake blockchain network founded by Ethereum co-founder Charles Hoskinson in 2015. It aims to provide fast, secure, and scalable blockchain transactions through leading research and development.
The Cardano blockchain is divided into layers handling different functions:
Some key aspects of Cardano include:
Proof-of-stake consensus
Cardano uses an Ouroboros PoS algorithm that is less energy intensive than PoW blockchains.
Research-driven approach
Cardano takes a science and philosophy-based approach for robust protocols.
Multi-phase roadmap
Cardano is being developed systematically in stages as part of a long-term strategy.
Governance model
ADA holders can vote on Cardano Improvement Proposals to determine future upgrades.
Significant capabilities
Cardano aims to rival Ethereum as the leading smart contract platform once development completes.
Due to its organized development path, Cardano proponents believe it can achieve the vision of becoming the most advanced blockchain.
Several core factors impact Cardano prices and market outlook:
Cryptocurrency Market Trends
Like most altcoins, Cardano’s price depends significantly on the performance of top cryptos Bitcoin and Ethereum. Rising crypto markets lift ADA. Bullish Cardano news also can have an impact.
Project Roadmap Progress
Cardano hitting major roadmap milestones like launching smart contracts demonstrates real-world viability and boosts ADA price.
Adoption By Developers
As developers build dApps, DeFi protocols and NFT projects on Cardano, utility grows along with demand for ADA tokens.
Staking Participation
Higher staking uptake increases locked ADA supply reducing selling pressure and potentially raising prices.
Competition
Interoperability blockchains like Polkadot and Cosmos or faster networks like Solana threaten to erode Cardano’s market share which impacts growth potential.
Upgrades and Governance
Smooth upgrades through community governance signals stability and reliability, instilling confidence in the network and ADA price.
Cardano is still early in its developmental journey. Here are key highlights so far:
2017 – Shelley Era Begins
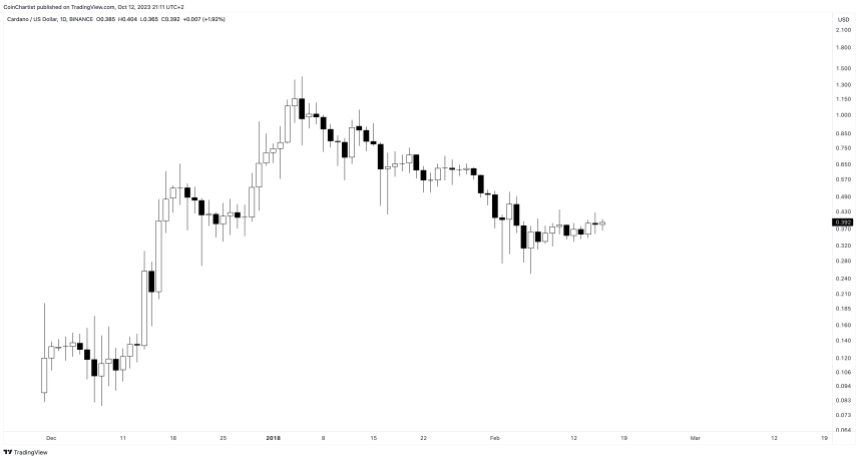
ADA tokens were first made available in early 2017, trading around $0.02 during the initial months. As the crypto market surged, ADA hit an all-time high of $1.33 in January 2018 before declining with the broader market.
The Shelley phase of decentralization development began, with staking and community governance capabilities being built. This marked a major step towards realizing Cardano’s vision.
2018-2020 – Bear Market Consolidation
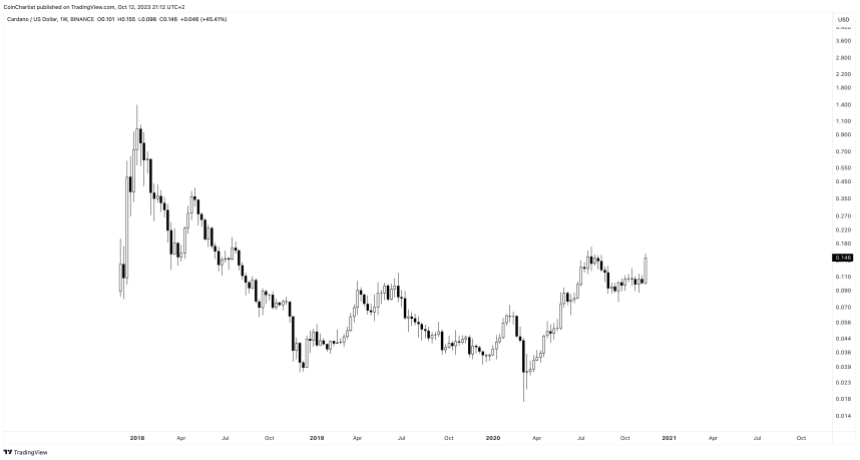
ADA faded from the spotlight during the 2018-2020 crypto bear market, with prices falling as low as $0.027 in March 2020. However, staking adoption grew steadily, reaching over 21 billion ADA staked by August 2020 and reducing supply pressure.
Despite price weakness, Cardano made major headway on technical improvements during this period away from the hype.
2021 – Explosive Growth Phase
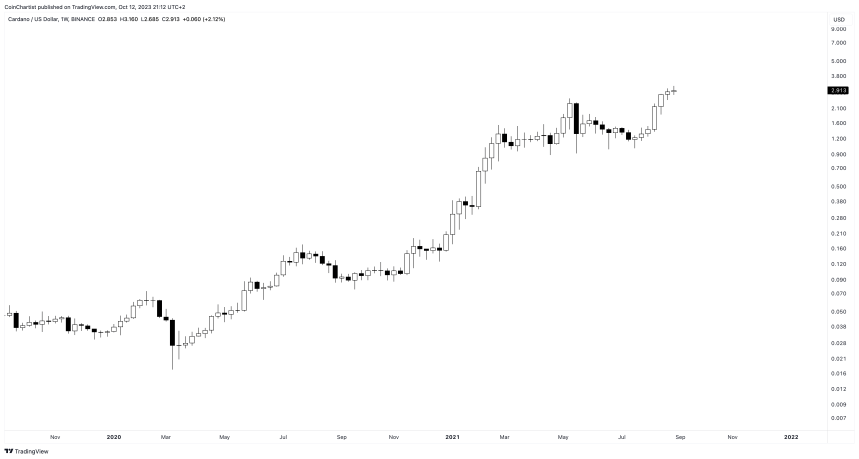
As crypto markets returned to health in 2021, ADA went on a monumental run starting from $0.18 at beginning of the year and reaching an all-time high of $3.10 in September 2021 – a surge of over 15x within 8 months!
Several developments triggered this growth phase:
This proved a breakout year for ADA establishing itself as a leading altcoin. Cardano ended 2021 at around $1.50.
2022 – Crypto Winter Survival
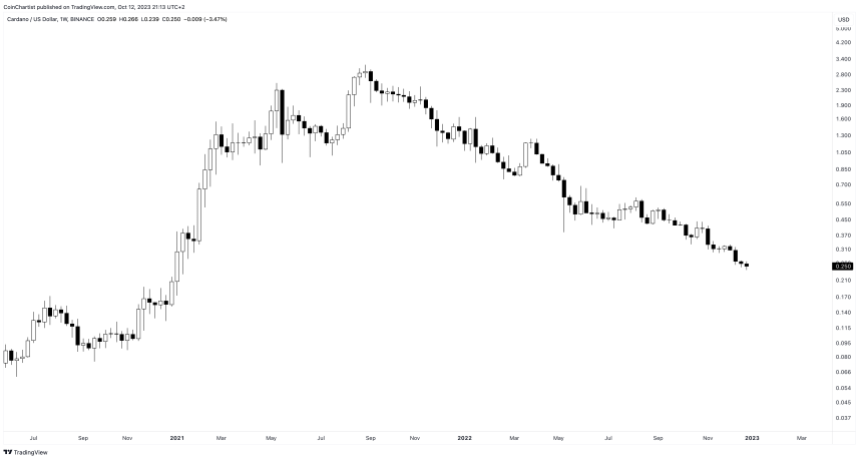
The 2022 crypto bear market was harsh on most altcoins including ADA, which fell to around $0.24 losing over 85% of its value from the peak. However, Cardano maintained active development throughout 2022. Over 100 projects were building on Cardano by year end despite market conditions. This demonstrated strong ecosystem fundamentals.
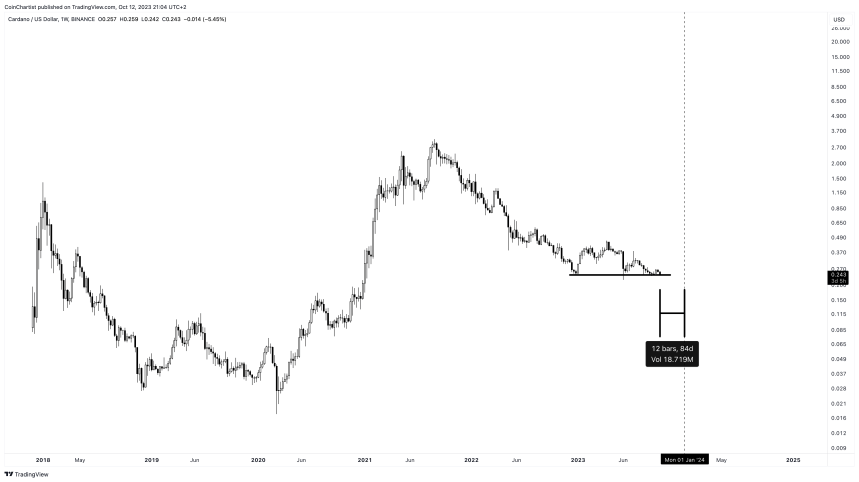
In 2023, ADA hasn’t fared much better, making a lower low at around $0.22. It is currently trading at around $0.24 per token but is at risk of losing support of a descending triangle pattern.
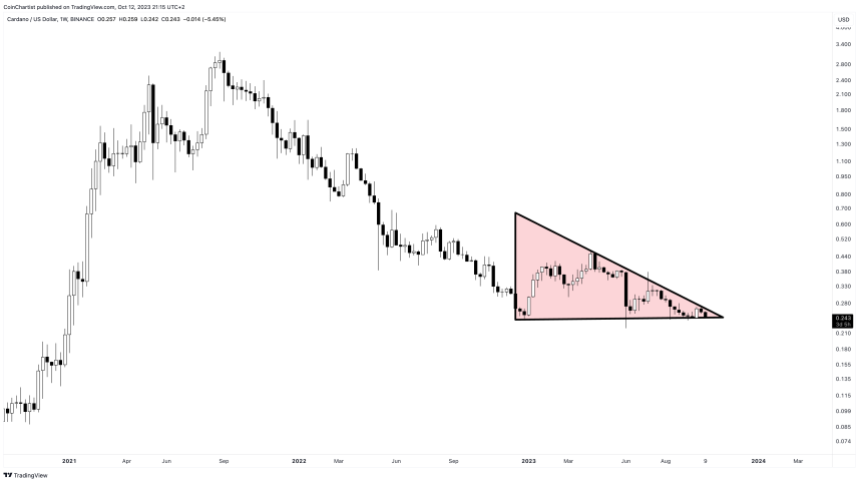
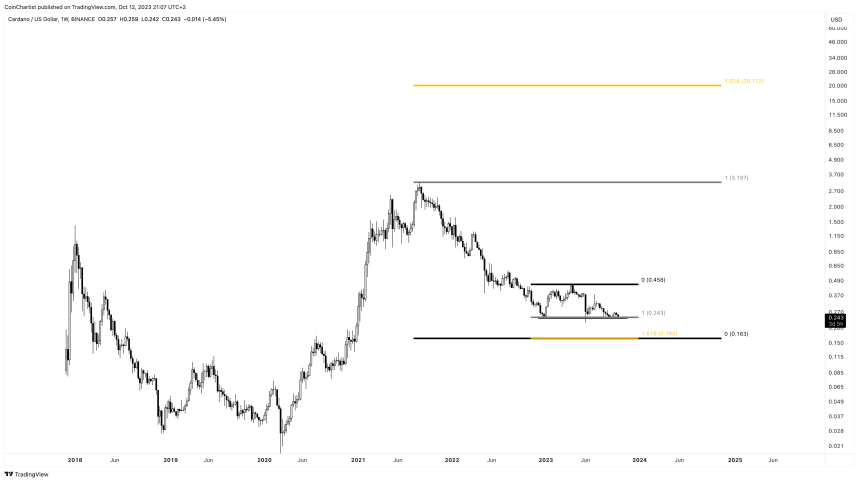
With less than 90 days left in 2023, Cardano has little hope for much higher prices, and investors should focus more on what happens if support is lost. Immediate short-term price predictions could even point to more downside, possibly falling as low $0.15 before the year is over.
Once ADA finds a bottom, which could go as deep as $0.15 in the new year, the cryptocurrency market could finally be poised for a rebound. If these two years are positive for the cryptocurrency market, Cardano could find itself – shockingly – as much as $20 per ADA according to the Golden Ratio 1.618 Fibonacci.
By 2030, Cardano intends to fulfill its goal of becoming the most developed blockchain platform. Assuming it achieves the vision, ADA has vast growth potential. If it maintains the long-term linear trajectory it is on, there are changes that Cardano can trade between $10 and $45 in the longer term.
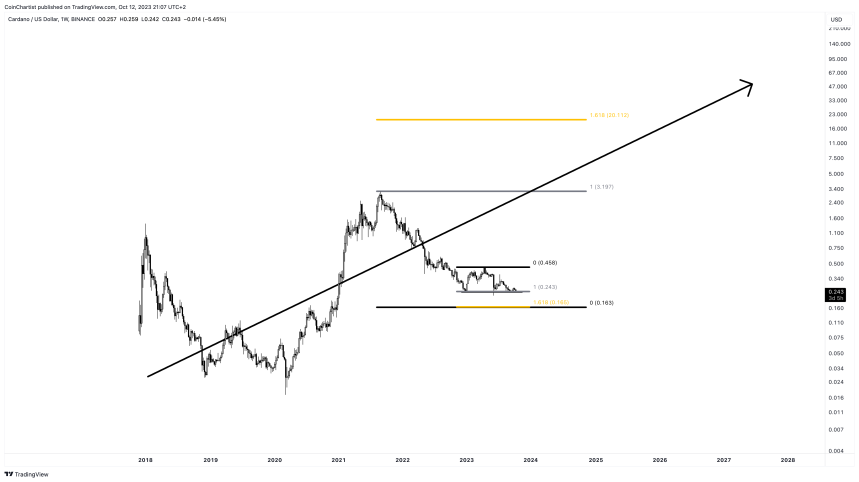
The next decade promises to be transformational for blockchain technology. If Cardano can cement itself as a leader, its long-term growth could be exponential. Patience and persistence are key.
Cardano has established itself as a leading development-focused blockchain with the goal of becoming the backbone infrastructure for decentralized finance one day. While market conditions remain challenging currently, long-term growth prospects appear bright for Cardano by 2025 and beyond. Hitting development milestones will be crucial for justifying significant price appreciation in the future.
Let’s look at some common questions investors have about ADA price analysis:
What was Cardano’s lowest price?
ADA sank to as low as $0.017 in the early stages after launch in 2017. During the 2022 and 2023 bear market, it dropped to around $0.22 which is the recent low.
What was the highest price for Cardano?
Cardano’s all-time high price was $3.10 reached in September 2021 at the peak of the crypto bull run.
Is $10 possible for Cardano?
ADA reaching $10 is achievable if crypto adoption returns to rapid growth by 2025 and Cardano executes its ambitious roadmap. But $10+ seems unlikely in the near-term given current depressed market conditions.
Can Cardano crash to zero?
A complete crash to zero looks highly unlikely barring an existential catastrophe given Cardano’s strong fundamentals. But an extended crypto winter could potentially push it below $0.10 until markets recover.
Why is ADA so volatile?
As with most cryptocurrencies, speculation and changing market sentiments contribute to ADA’s volatility. As a top-10 token, it also experiences high trading activity and price swings.
When will Cardano’s price stabilize?
ADA volatility should stabilize significantly if/when Cardano sees massive adoption as a blockchain solution used by enterprises, institutions and governments. But markets will likely remain turbulent for foreseeable future.

Bitcoin price has corrected at each attempt to rally above $28,000. Cointelegraph explains why.
The waiting time to deploy new validators to the Ethereum network has diminished to just five hours from a peak of 45 days in early June.

The government is incentivizing new residents to come develop payment solutions, smart contracts, hard wallets and promotions for the digital yuan.
Designed to dismantle barriers to financial services for marijuana businesses, the bill would be beneficial to crypto companies stripped of banking access, says Cody Carbone.
The new Ethereum layer-2 network’s debut adds to the competition among rival providers of so-called “zkEVMs,” including Polygon and Matter Labs.
Data shows the Bitcoin drop below the $27,000 level has made most investors fearful for the first time this month.
The “fear and greed index” is an indicator that tells us about the general sentiment among investors in the Bitcoin and broader cryptocurrency market. Alternative created the metric, and according to the website, it’s based on these factors: volatility, trading volume, social media sentiment, market cap dominance, and Google Trends data.
The indicator uses a numeric scale from zero to hundred to represent the sentiment. When the index has a value greater than 54, it means that the average investor is greedy right now, while it being under 46 implies a fearful mentality is dominant.
The region between these two thresholds naturally signifies a neutral sentiment among the holders. Until today, the sector had been stuck inside this region since the last couple of days of September, as the investors had been split about the trajectory of Bitcoin.
The chart below shows that the market sentiment has worsened with the latest drop in the cryptocurrency’s price below the $27,000 level.
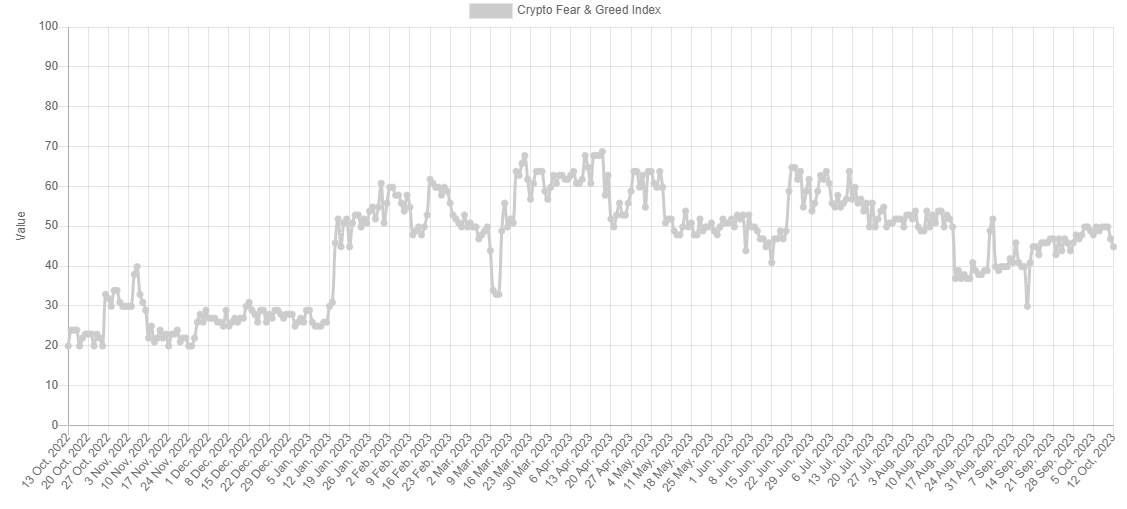
After this latest drop in sentiment, the fear and greed index has hit a value of 45, meaning that investor sentiment has just entered the fear region.
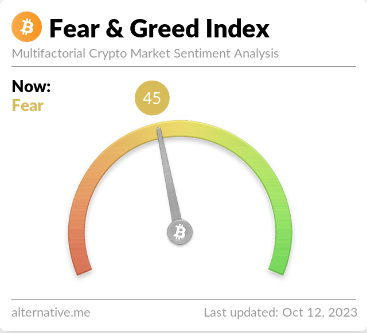
Historically, the market has tended to move in a way that’s opposite to what the majority of the investors believe. The likelihood of such a contrary move happening increases as this imbalance in the sentiment rises.
While the holders are leaning towards one side (fear), the imbalance is small, as the fear and greed index is barely inside the territory. As such, the probability of a rebound would be pretty high right now (at least based on the sentiment).
Besides the core sentiments discussed before, there are also two special zones, called “extreme fear” (at or below values of 25) and “extreme greed” (at or above values of 75).
These regions are where the cryptocurrency has often turned around in the past. Naturally, bottoms have occurred in the former zone, while tops have formed in the latter area.
If the Bitcoin fear and greed index continues declining in the coming days and reaches values near the extreme fear region, a bounce could become a real possibility.
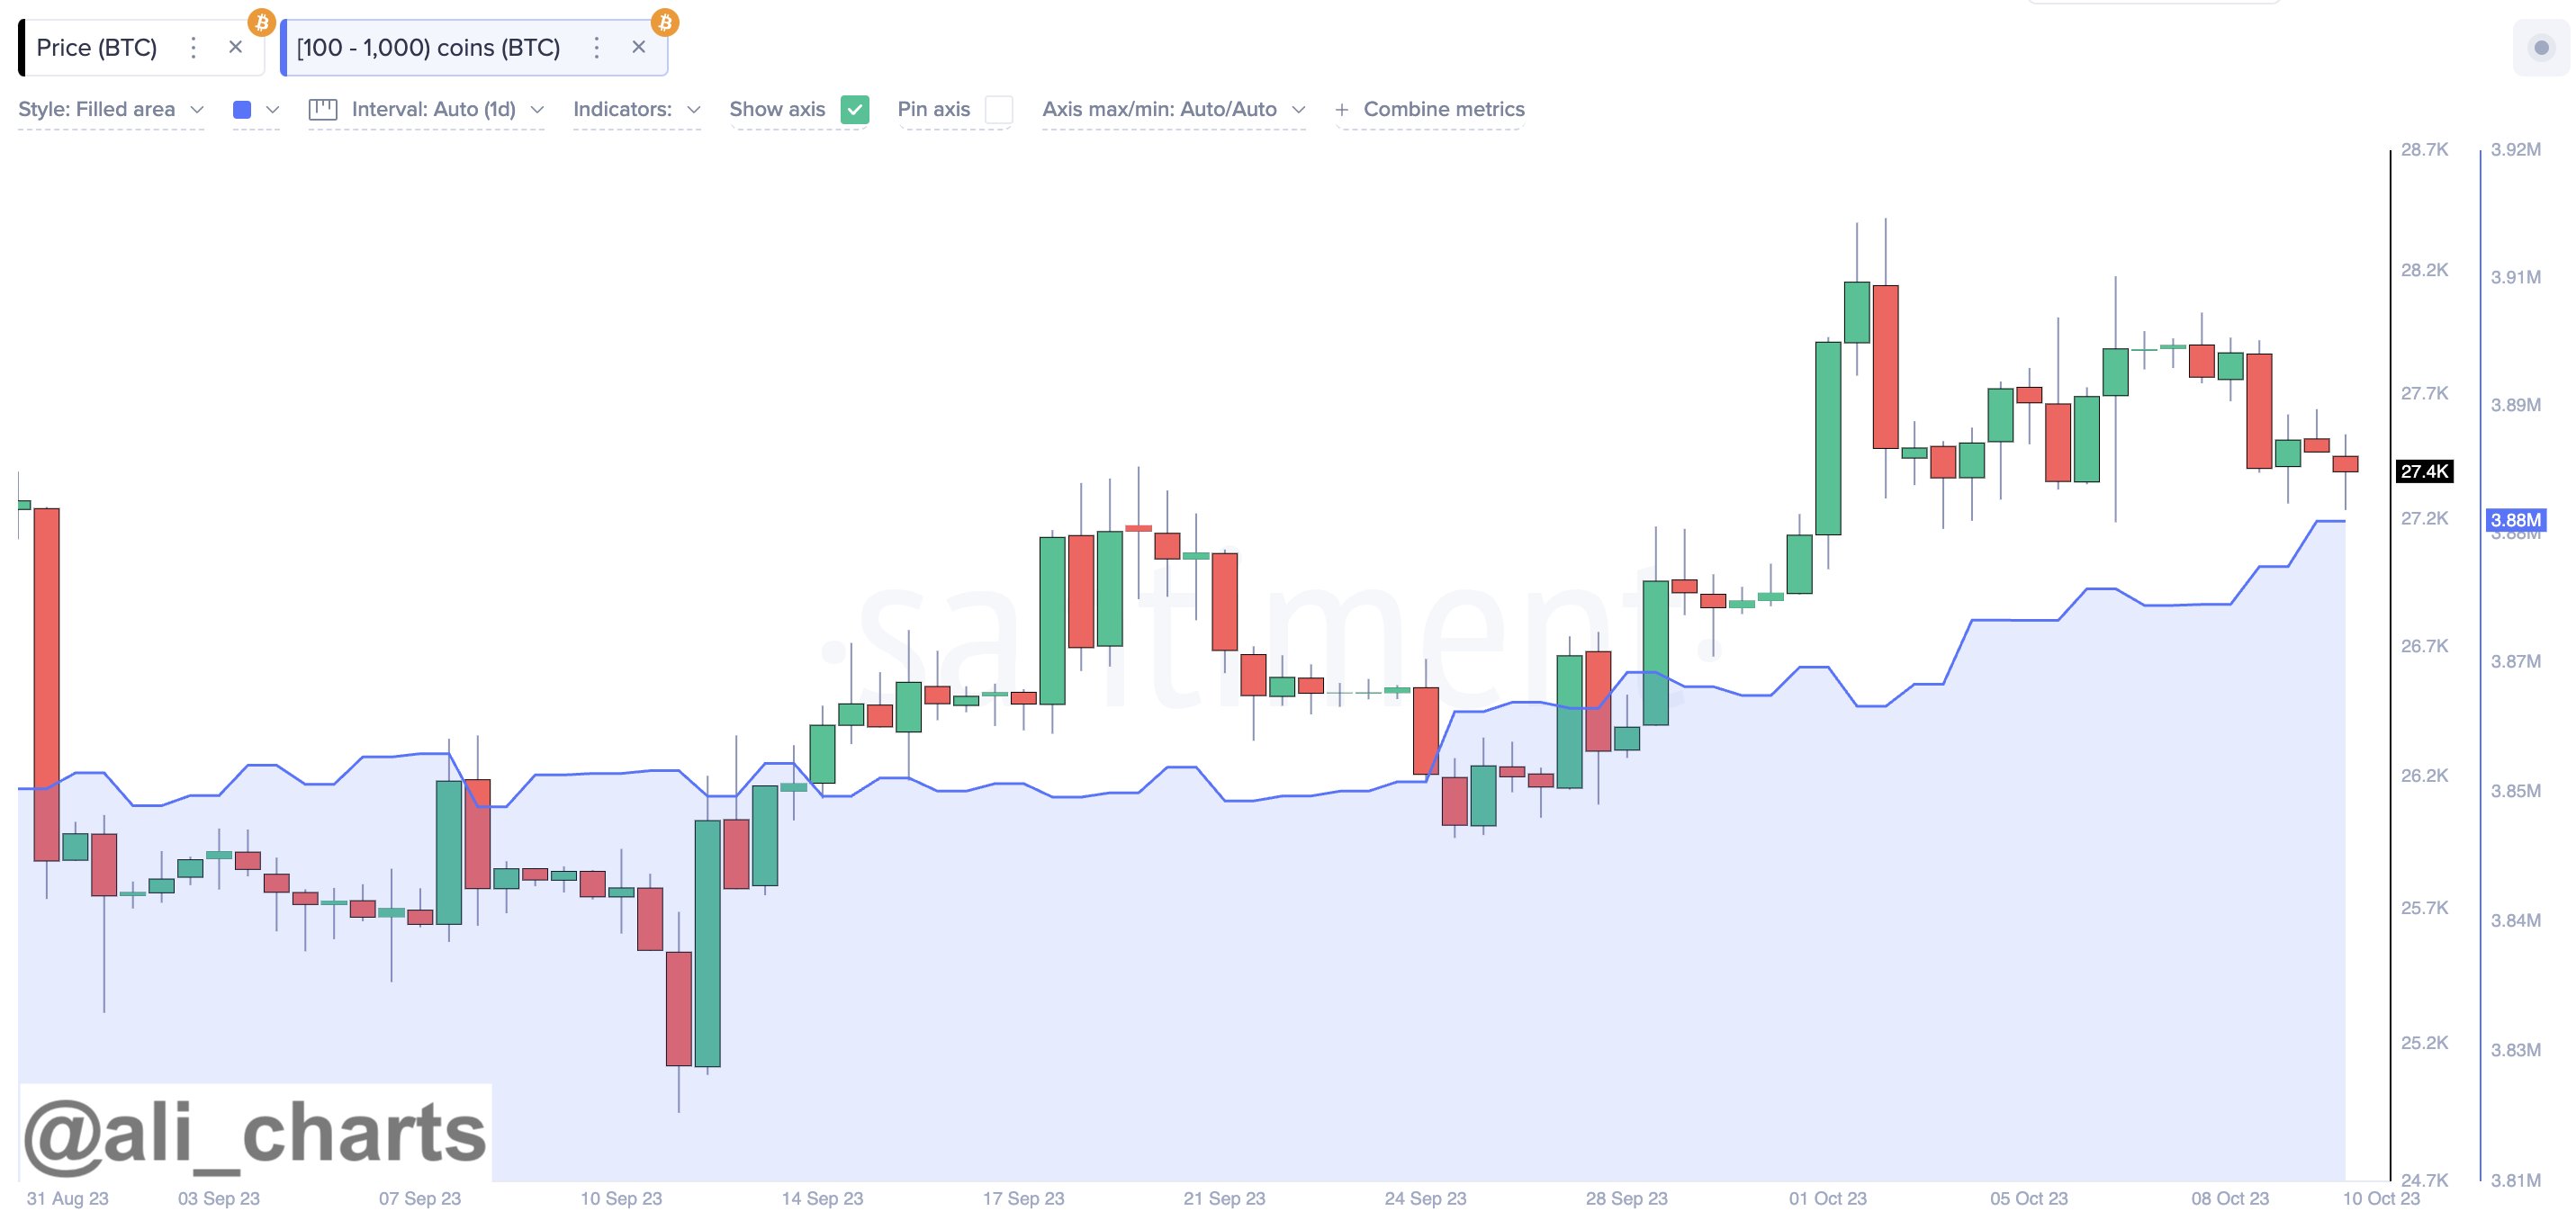
For now, one sign pointing to the chances of a rebound may be that the large investors have been buying recently, as an analyst on X pointed out.
Since the start of October, Bitcoin investors holding between 100 and 1,000 coins have purchased a combined 20,000 BTC worth around $533.6 million at the current exchange rate.
At the time of writing, Bitcoin is trading at around $26,700, down almost 5% in the past week.
U.S. regulators have targeted former Voyager Digital CEO Stephen Ehrlich with lawsuits claiming he engaged in fraud and deliberately misrepresented his customers’ government protections.

The legal action followed reports staff at the CFTC had completed an investigation concluding Stephen Ehrlich violated U.S. derivatives regulations.
The XRP price has had a rollercoaster growth trajectory which was mostly hindered by the US Securities and Exchange Commission (SEC) filing a lawsuit against Ripple. But a lot of the altcoin’s performances over the months have been rather predictable, and with its history, we can get an idea of what to expect for the XRP price this month.
In a heat map of historical XRP price data generated by NewsBTC, we can see how the month of October has usually gone in the past. The heat map shows XRP’s performance over the last eight years and the figures for October are some of the worst historically.
As shown in the image below, the month of October has historically seen more losses than gains when it comes to the XRP price. In fact, out of the last eight years, only two years have seen October record a positive return for the XRP price.
In the first four years of the altcoin’s life, we can see that the month of October was characterized by losses. Then in the fifth year in 2019, XRP saw its first profitable October with a 14.84% increase. Then from there, there is an alternating trend recorded with one year being profitable and the next being filled with losses.
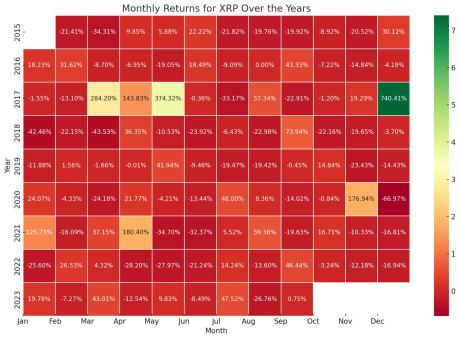
The year 2022 was no different, seeing 3.24% losses after the previous year saw October end with 16.71% gains. So if this holds, it could be that October 2023 would end on a good note. However, as the charts show, this month is already seeing XRP prices fall, so for it to finish strong, there would have to be a massive price reversal. Otherwise, October 2023 could stick to historical performance and end in the red.
As shown in this report from Bitcoinist, taking an average of the XRP price performance in October over the years shows that it is not a good month for the altcoin. The chart shared in the report reveals that historically, October is the third-worst month for the cryptocurrency.
The only months that have seen worse performance than October are the months of February with slightly higher loss numbers. Meanwhile, June takes the crown for the month with the worst returns as the last 7 seven years have seen the month end with losses.
On the other hand, December presents as the best month for the XRP price. This is followed by April being the second, with May and March snagging fourth and fifth place, respectively. January, November, and September are also profitable months but to a much lesser degree.
Trezor has produced a hardware wallet with a stripped-back design to appeal to less experienced crypto users, alongside two other new products.

An attempt to withdraw USDR stablecoins amid a liquidity crunch appears to have gone horribly wrong.
How can advisors support client interest in digital assets? Thanks to Miguel Kudry from L1 Advisors for taking us through examples in today’s Crypto for Advisors newsletter.
On-chain data shows Bitcoin has failed in its latest retest of a historically significant metric, a sign that a bearish trend might have taken over.
As pointed out by an analyst in a post on X, BTC is currently facing resistance at the short-term holder’s realized price. The “realized price” here refers to the cost basis or acquisition price of the average investor in the Bitcoin market.
When the spot price of the cryptocurrency is below this level, it means that the investors as a whole are currently in a state of net loss. On the other hand, the asset being above this metric suggests that the overall market is holding some profits right now.
In the context of the current discussion, the realized price of the entire BTC sector isn’t of relevance, but of only a particular segment: the “short-term holders” (STHs).
The STHs are the investors who purchased their coins within the past 155 days. The members of this group are generally weak in their conviction, and thus, they can be quite reactive to changes in the market.
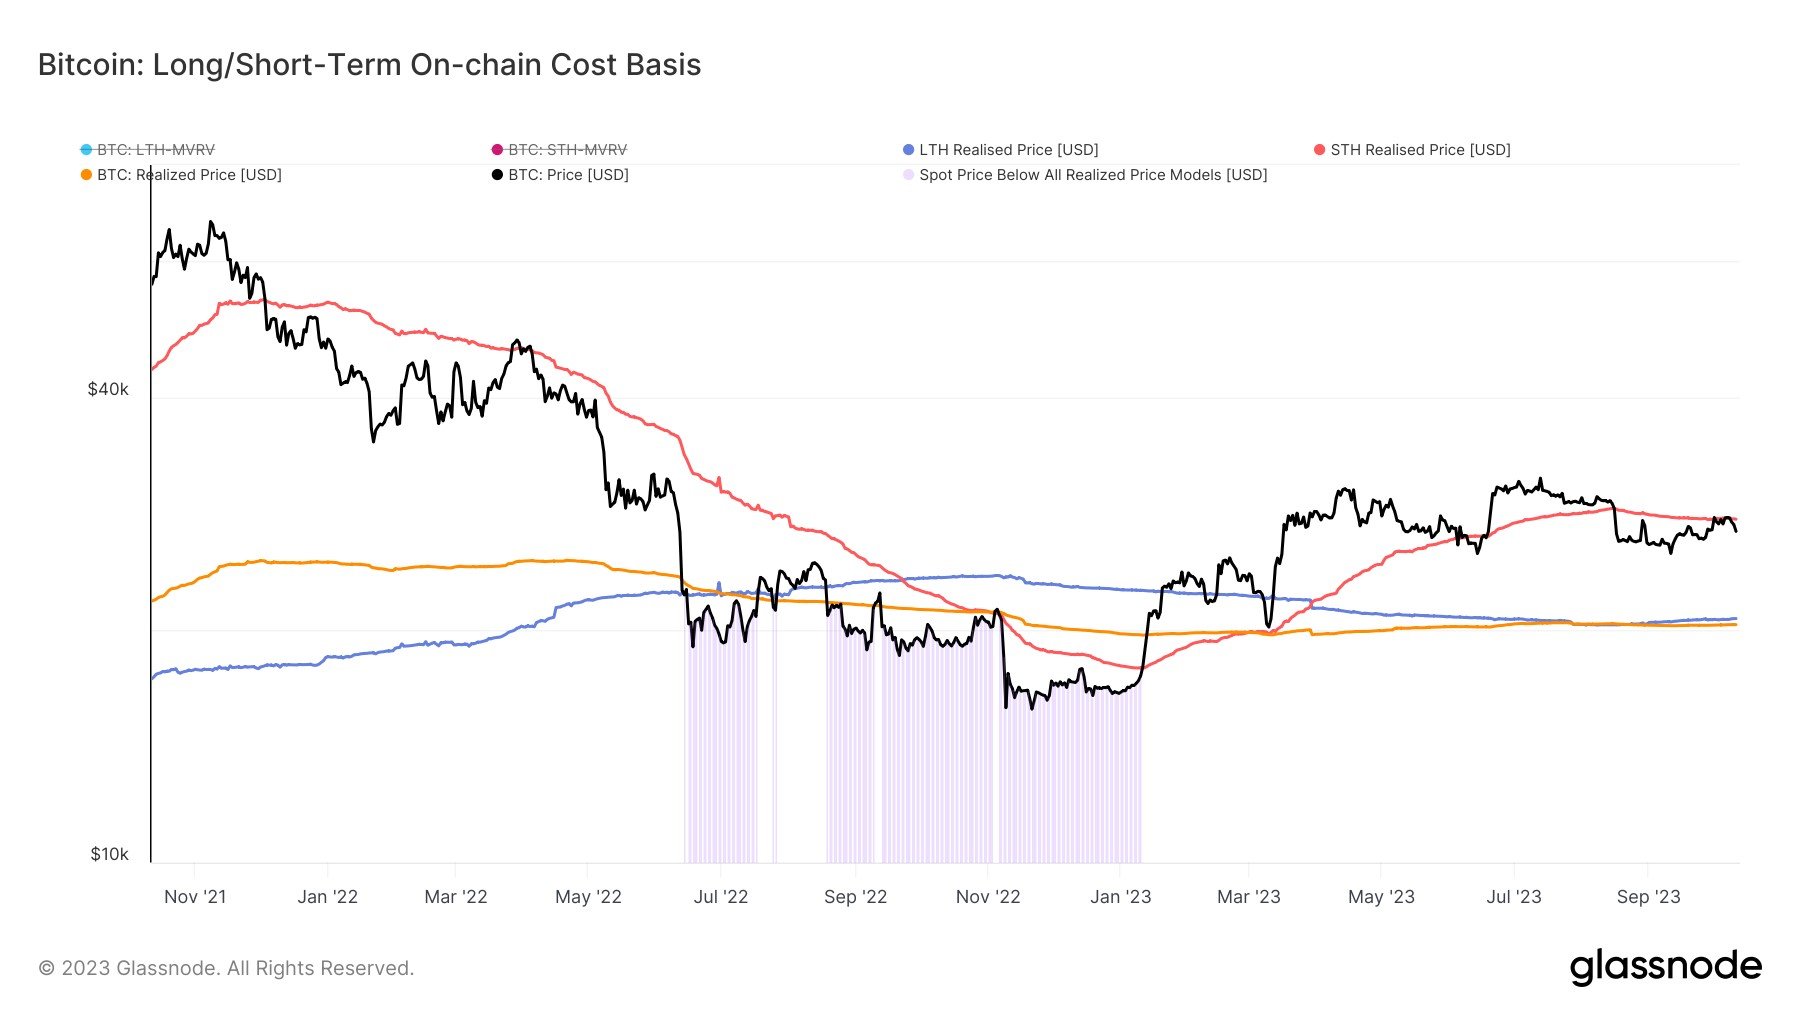
Now, here is a chart that shows the trend in the Bitcoin realized price specifically for these STHs over the past couple of years:
As displayed in the above graph, the Bitcoin short-term holder’s realized price is valued at about $27,800 right now. During its most recent attempt at recovery, BTC retested this line but ended up finding some major resistance at it.
The indicator actually has a lot of history of acting as both resistance and support for the spot price of the cryptocurrency. Generally, this line has helped the asset during bull rallies, while it has impeded it in bear markets.
From the chart, it’s visible that the asset’s price had found resistance at this mark and had remained under it throughout the bear market in 2022. With the rally that started in January of this year, though, the coin had finally managed to find a break.
The realized price of the STHs had then flipped towards being a support level, as it had propelled the asset during the retests in March and June. With the crash in August, however, Bitcoin once again slipped below the line and has been unable to climb back above it since.
Given the significance of the line, the latest retest of the indicator was quite important, so the fact that it ended in failure could be a worrying sign for the asset, as it may mean that a shift back towards a bearish trend might have occurred.
Retests like the one of the STH realized price can sometimes take a while to properly finish, but since Bitcoin has seen a steep decline towards the $26,700 level since the rejection, it may be confirmation that the asset was indeed rejected this time.