The decision, reported by Reuters, boosts the odds that Grayscale Investments will be able to turn its Grayscale Bitcoin Trust (GBTC) into a more investor-friendly ETF.
Cardano (ADA) Addresses In Loss Rise Over 94%, Is It Time To Jump Ship?
Cardano is down 45.6% from its yearly high of $0.4518 and is showing no signs of slowing down at the moment. Data has shown that at its current price, the majority of Cardano holders are losing money, further showing the state of the cryptocurrency’s price.
Cardano (ADA) addresses in loss is now over 94%, leaving many investors wondering if it’s time to cut their losses and move on.
Cardano (ADA) Addresses In Loss Rise Over 94%
Cardano (ADA) is currently the 8th largest crypto by market cap, with a market cap of $8.65 billion. However, all metrics have pointed to the cryptocurrency losing stream and struggling to receive inflow from investors.
For instance, ADA is down by 7.% in a 7-day time frame. Its trading volume has also fallen by 12.67% in the past 24 hours, showing a lack of interest in either buying or selling the cryptocurrency.
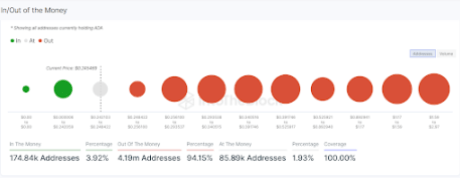
Data from IntoTheBlock’s In/Out of the Money metric has shown the number of Cardano addresses in red is now at 94.15%. The metric, which shows the number of addresses making profits and losses at a cryptocurrency’s current price, shows that the number of Cardano addresses in loss is now over 4.19 million.
Many ADA investors bought in near the peak hype during its all-time high. Of the 4.19 million addresses in loss, 691,480 addresses bought between $1.59 to $2.97, and 608,590 addresses bought between $1.17 to $1.59. On the other hand, only 174,840 Cardano addresses representing 3.92% of the total addresses, are currently at a profit.
Whale transactions have also been quiet on Cardano’s blockchain in the past 24 hours. Another IntoTheBlock metric shows the number of transactions with a value of $100,000 or greater has been in a freefall since May.
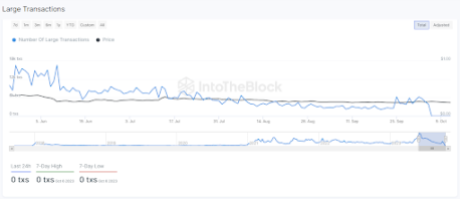 Source: IntoTheBlock
Is It Time To Jump Ship?
The low profitability of ADA holders is probably surprising, given the Cardano blockchain’s popularity. According to recent data released by blockchain analytics firm Santiment, the Cardano network is still the most popular among developers.
Cardano developers have also been actively building and introducing exciting innovations to the blockchain and ecosystem. One example of these developments is the updates to its Lace wallet.
Cardano’s founder, Charles Hoskinson, recently dismissed rumors of issues within the blockchain. And as long as developers remain dedicated to improving the network, Cardano will continue to progress as one of the biggest cryptocurrencies.
For long-term believers in ADA, the current low price could actually be an opportunity to stock up in anticipation for the next crypto bull market.
Bitcoin Price Rally On The Horizon? BTC Spot ETFs May Get The Green Light Today
In what could be a pivotal day for the Bitcoin price, the last day for the US Securities and Exchange Commission (SEC) to appeal the Grayscale Bitcoin (BTC) spot Exchange-Traded Funds (ETF) decision is approaching, and the crypto community is eagerly awaiting the outcome.
The implications of this decision are significant, as it could pave the way for the approval of several other spot Bitcoin ETFs.
Impending Approval Of All Proposed Bitcoin Spot ETFs?
According to crypto YouTuber Crypto Rover, if the SEC does not appeal the court’s ruling by the end of the day, it would potentially lose its ability to deny future applications, resulting in the likely approval of all proposed spot ETFs.
The current list of applicants seeking approval includes prominent names such as Grayscale Bitcoin Trust, Ark/21 Shares Bitcoin Trust, Bitwise Bitcoin ETF Trust, BlackRock Bitcoin ETF Trust, VanEck Bitcoin Trust, WisdomTree Bitcoin Trust, Valkyrie Bitcoin Fund, Invesco Galaxy Bitcoin ETF, and Fidelity Wise Origin Bitcoin Trust.
If all Bitcoin spot ETFs are approved, the move would mark a significant milestone in the mainstream adoption of cryptocurrencies.
Accepting these financial instruments would provide investors with a regulated and easily accessible avenue to gain exposure to Bitcoin’s price movements without directly owning the underlying asset.
The approval would also vote for confidence in the cryptocurrency market, attracting institutional investors and potentially injecting fresh capital into the space.
The approval of Bitcoin spot ETFs also can ignite a renewed sense of optimism and investor sentiment. The anticipation of such a development has already fueled speculation of a Bitcoin rally, with market participants eyeing a new annual high.
The thawing of the crypto winter and the approval of these ETFs could create a perfect storm for a Bitcoin price to surge, potentially breaching the $30,000 mark and beyond.
Bitcoin Price Awaiting ETF Relief
The largest cryptocurrency in the market is striving to reclaim the crucial $27,000 level, trading at $26,700. This level holds significant importance for bullish investors as it represents a key threshold to break the mid-term downtrend structure observed in BTC’s 1-day chart since its yearly high of $31,800 on July 13
Additionally, the failure of the Bitcoin price to hold its 200-day (yellow line) and 50-day (brown line) moving averages (MAs) as support lines is a cause for concern among bullish traders. These MAs, similar to the situation in March 2023, are currently converging.
However, the potential approval of a BTC spot ETF could provide much-needed relief to Bitcoin’s price. Forming a complete rally would require overcoming various resistance levels in such a scenario.
In the short term, Bitcoin’s price will likely face a significant obstacle at the $27,900 level, which was briefly surpassed on October 2nd. Furthermore, BTC encounters a 3-month resistance at $28,700, marking the final hurdle before reaching the $30,000 level, serving as another resistance line.
Nevertheless, the community anxiously awaits the approval of BTC spot ETFs, hoping that it will bring a sense of relief and bullish momentum for investors and Bitcoin’s price.
Featured image from Shutterstock, chart from TradingView.com
Microsoft’s Activision buy may see more metaverse in the office and crypto in gaming

More signs say the acquisition will boost metaverse applications in business than in gaming as CEO Nadella talks about productivity and metaverse enthusiast Kotick leaves Activision.
Price analysis 10/13: BTC, ETH, BNB, XRP, SOL, ADA, DOGE, TON, DOT, MATIC

Bitcoin trades in a predictable range, but will the sideways price action tempt altcoin traders to open new positions?
European regulators assess DeFi risks, Uniswap launches Android wallet: Finance Redefined

EU securities regulators have their eyes on DeFi, and the top 100 DeFi tokens had mixed price action over the past week, with most trading in a tight range.
Stablecoin Lender Liquity’s Token Gains 80% in Month as Activity Increases
Is Hamas Using Crypto to Attack Israel? We Don’t Know
Reports this week about multi-million dollar Hamas crypto financing may have left a faulty impression.
Man Makes A Fortune With $22 In Bitcoin: 3 Altcoins For October 2023 That Can Do This
Bitcoin’s history is filled with stories of people who put small, disposable amounts of money into the crypto and ended up making a fortune. This has been no different from the case of one Norwegian man, whose throwaway $22 Bitcoin investment has turned into a life-changing sum.
When Kristoffer Koch had originally invested in Bitcoin back in 2009, the cryptocurrency was only trading for a few cents. Koch, at the time, was intrigued which is why he said he made the purchase. He got 5,000 BTC for around $22 at the time, although this figure often varies.
Nevertheless, Koch ended up forgetting about this purchase until four years later when Bitcoin had blown up. By the time the Norwegian man got into his Bitcoin wallet, his initial $22 purchase had ballooned into $850,000. Upon seeing the life-changing sum, Koch revealed that he had used part of the money to buy himself a flat in Oslo.
As stories like these continue to make the rounds, a question on the lips of investors, especially those who came in later than the likes of Koch, is which cryptocurrencies could replicate such growth. So here are some picks that look good.
Fetch AI (FET) Brings AI To Crypto
The AI narrative is still holding strong both within and outside the crypto market and this has positioned some projects to be able to take advantage of its expected growth. Fetch AI’s native FET token has already shown the opportunity that lies in this space but that was only in a bear market. A bull market could see FET’s price rise further and do numbers.
The project is looking to democratize AI access through a crypto economy. This means users will be able to access AI in a completely decentralized and permissionless way unlike the AI products seen in traditional spheres.
Secret (SCRT) Challenges Bitcoin With Privacy
Presently, when the topic of privacy coins comes up, two names tend to pop up quickly, which include Monero’s XMR and Secret’s SCRT. Secret actually users ‘Secret Contracts’ to allow decentralized applications to offer completely private transactions.
As the demand for privacy grows among crypto users who constantly have to be aware of the government’s encroachment, SCRT’s value proposition becomes even more important. Added to its low $51 million market cap, SCRT could see a rally similar to that of Bitcoin.
Radiant Capital (RDNT) With Fragmented Liquidity
When it comes to carrying out transactions on-chain, liquidity becomes king, and this is where Radiant Capital (RDNT) comes in. The project is looking to consolidate fragmented liquidity in a bid to enhance the available liquidity for decentralized finance (DeFi) protocols.
This will work across a number of lending protocols regardless of the blockchain that they are on. So instead of hopping from one protocol to another, DeFi users can take advantage of this using a single protocol.
Radiant’s value proposition in a sector that is continuously evolving and growing could see it put on a Bitcoin-like rally. This could see its market cap go from its current $70 million to billions of dollars.
Ethereum’s New Low-Fee Regime May Put Its ‘Ultra Sound Money’ Thesis to Test
The Ethereum network’s revenue from fees dropped to its lowest level since April 2020 as speculative activity disappeared and users migrated to layer 2s, IntoTheBlock said.
Everything to Know About Sam Bankman-Fried’s Second Week in Court
Ethereum price drops to a 7-month low as data points to more downside

Eth price is at risk of trading below a key price support and multiple data point point to a bearish outlook for the altcoin’s price.
Hamas’ Crypto Ties May Lend Energy to Sen. Warren’s Money Laundering Bill
The revelations that the terrorist group behind last week’s attack on villages in southern Israel that left more than 1,200 Israelis dead was partially funded with cryptocurrency may lend additional weight to an effort from Sen. Elizabeth Warren (D-Mass.) and others to push for a law targeting money laundering and sanctions abuses in crypto.
SBF Trial: Crypto Lender BlockFi Believed Alameda Was Solvent Given Balance Sheet It Was Shown, CEO Testifies
BlockFi lost “a little over a billion dollars” due to its involvement with FTX and Alameda Research, Zac Prince said.
Sam Bankman-Fried’s legal team moves to pursue theory on FTX terms of service

Lawyers petitioned the court to allow them to question witnesses for the prosecution based on FTX’s terms of service, as well as preclude testimony from “lay fact witnesses”.
Have Traders Moved Past Dogecoin? Transactions Plunge 98% Since June
Data shows that Dogecoin transactions have dropped more than 98% since June, a sign that investors have lost interest in the meme coin.
Dogecoin 7-Day Transaction Count Has Dropped To Just 37,300
According to data from the market intelligence platform IntoTheBlock, activity on the DOGE network has really slowed down recently. The metric of interest here is the total number of transactions that the Dogecoin blockchain is observing every day.
When this indicator has a high value, it means that the investors are making a large amount of moves on the network right now. Such a trend implies that the holders have an active interest in trading the cryptocurrency.
On the other hand, low values imply the blockchain is only seeing a few daily transfers, which can be a sign that traders have no interest in using the meme coin currently.
Now, here is a chart that shows the trend in the 7-day average number of daily Dogecoin transactions over the past few months:
As displayed in the above graph, the Dogecoin blockchain observed a high amount of transaction activity during July and the first half of August.
As the second half of August kicked off, however, the indicator’s value saw a steep decline. The reason behind this sharp drop is likely to be the crash that the price of the meme coin saw at about the same time.
Before this crash, DOGE had been trading above the $0.076 mark, but after it, the asset plummeted toward the low $0.06 level. Till now, the coin hasn’t been able to recover from this plunge.
Rather, the memecoin’s situation has only become more dire recently, as its price has registered some drawdown even below these lows. From the chart, it’s visible that the transactions on the network have seen a similar fate, as they have dropped to pretty low levels now.
At present, the 7-day average number of daily transactions on the Dogecoin blockchain stands at 37,300, which is quite the plunge compared to the 616,000 spike seen in July.
The current levels are even worse when looking at a longer timespan, as IntoTheBlock notes that the asset had been enjoying 2.1 million 7-day average daily transfers just back in June.
Compared to this high in June, the network activity today has declined by more than 98%, which is a staggering figure. It would appear that almost no one wants to use Dogecoin right now, at least compared to the high interest the coin had seen a few months back.
Historically, rallies have been backed by a high amount of user activity, but as transfers have shown no signs of any recovery recently, it’s not surprising that the meme coin’s price hasn’t been able to display any momentum, either.
DOGE Price
Dogecoin has seen more bearish price action in the past few days as the asset’s value has now dropped below the $0.058 level.
U.S. House Speaker Drama Could Threaten to Unravel Crypto’s 2023 Chances
Republicans in the U.S. House of Representatives are sprinting toward the worst case scenario in their scramble for a new speaker of the House, and their infighting could worsen the prospects for crypto legislation this year.
SEC Deadline on Grayscale’s Bitcoin ETF Dispute Approaching at Midnight
The SEC has hours left to seek an appeal of the court order to erase the agency’s rejection of Grayscale’s trust-to-ETF conversion application.
Failed Bullish Pattern Could Send Ethereum Sub-$1000
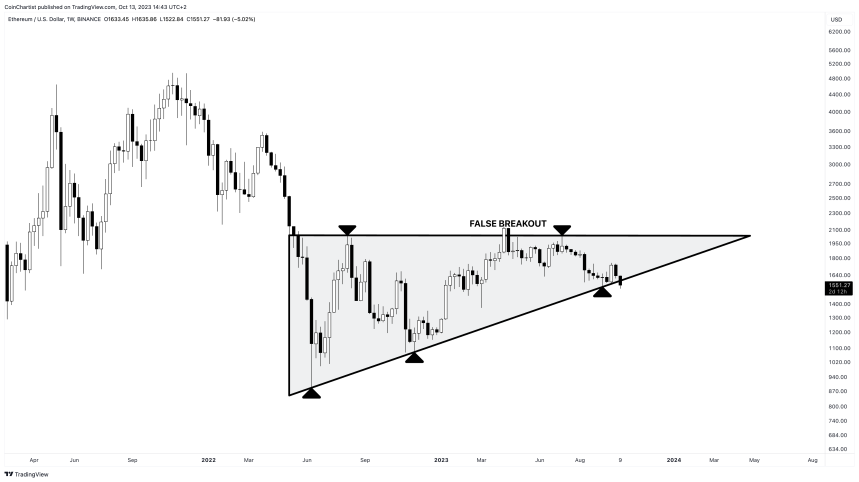
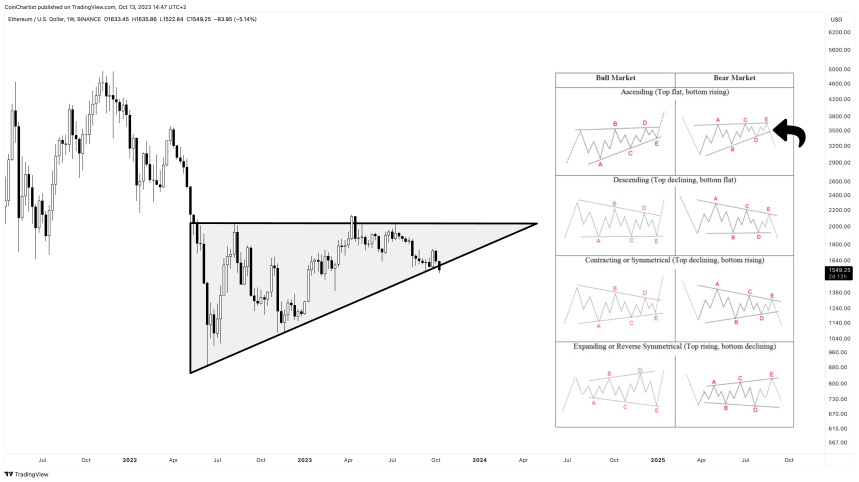
Ethereum price is trading at roughly $1,550 after failing to get back above $2,000 throughout the entirety of 2023 thus far. Increasingly higher lows during the year and a horizontal resistance zone had formed an ascending triangle – a potentially bullish chart pattern.
This pattern, however, is possibly failing. A busted pattern target could send the price per ETH sub-$1,000.
Ethereum Ascending Triangle Begins Breakdown: Target $700
Ethereum put in its bear market low back in June of 2022 while Bitcoin and other coins kept falling through the end of the year. Despite the early lead in a bear market recovery, ETH has underperformed against BTC in 2023. Now it is at risk of falling to a new low with a target of deep below $1,000 if a presumed bullish pattern breaks down instead of up.
ETHUSD has been trading in what appears to be a textbook ascending triangle pattern since its 2022 local low. A series of increasingly higher highs has created an upward slowing trend line. A horizontal resistance zone across $2,000 has kept price action at bay. Volume has been trending downward throughout the course of the pattern. Price is at roughly two-thirds to the triangle apex.
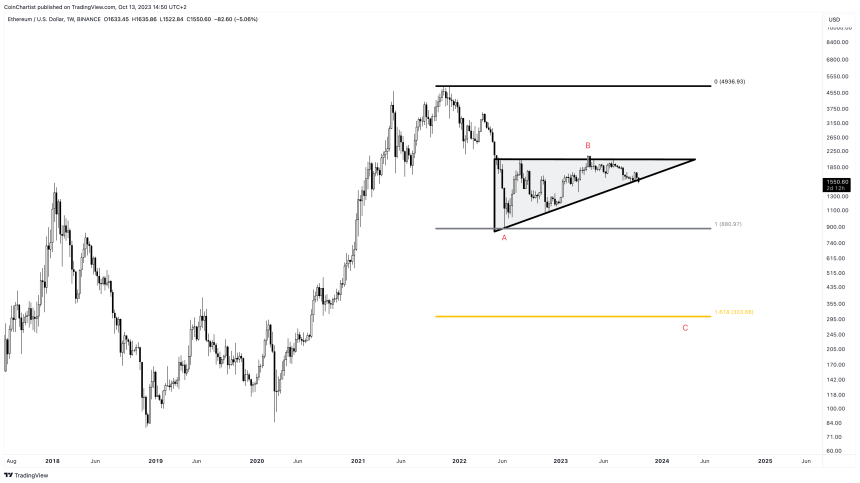
Ether even had positive news at its back: the launch of the first Ethereum Futures ETFs. Yet it has failed to produce any meaningful upside, and is now trying to move back down causing the bullish pattern to bust. If the pattern does break downward, it would have a target of around $700 per ETH based on the measure rule.
Elliott Wave Explained: Golden Fibonacci Extension Targets $300 ETH
Although the ascending triangle is considered a bullish chart pattern, it only has a roughly 63% probability of breaking out, per the Encyclopedia of Chart Patterns by Thomas Bulkowski. The remaining 37% of the time break down. But technical analysis is a broad study. An ascending triangle to one trader, could be barrier triangle to another.
A barrier triangle is simply an ascending or descending triangle as defined by Elliott Wave Principle. In Elliott Wave Principle, triangles are especially telling. They only appear before the final move in a sequence. Because Elliott Wave labels waves with the trend as 1 through 5, triangles are corrective and appear only in the wave 4 place – just prior to wave 5 which ends the sequence.
In a bear market, corrective structures are labeled ABC. Triangles themselves can appear during a B wave, which once again, is ahead of the final move in the ABC count. C wave targets are often found by projecting the 1.618 Fibonacci ratio from the A wave. This makes the target of the busted pattern somewhere around $300 per ETH. Between the measure rule and the Fibonacci extension target, Ethereum could be facing sub-$1,000 prices in the future.
THORSwap, Used by FTX Exploiter, Resumes Trading After Updating Terms to Exclude U.S.-Sanctioned Countries
THORSwap, the exchange that paused its platform last Friday following a series of trades related to the FTX hack, resumed its services on Friday with updated terms and conditions relating to users in sanctioned countries.


