Solana continues to face mounting selling pressure as it struggles to reclaim the $150 level, with broader market uncertainty weighing heavily on price action. Down nearly 60% from its all-time high, Solana reflects the weakness seen across the crypto sector, where fear and volatility have returned to dominate investor sentiment. As macroeconomic instability and risk-off behavior persist, bulls have been unable to regain control, and confidence remains shaky.
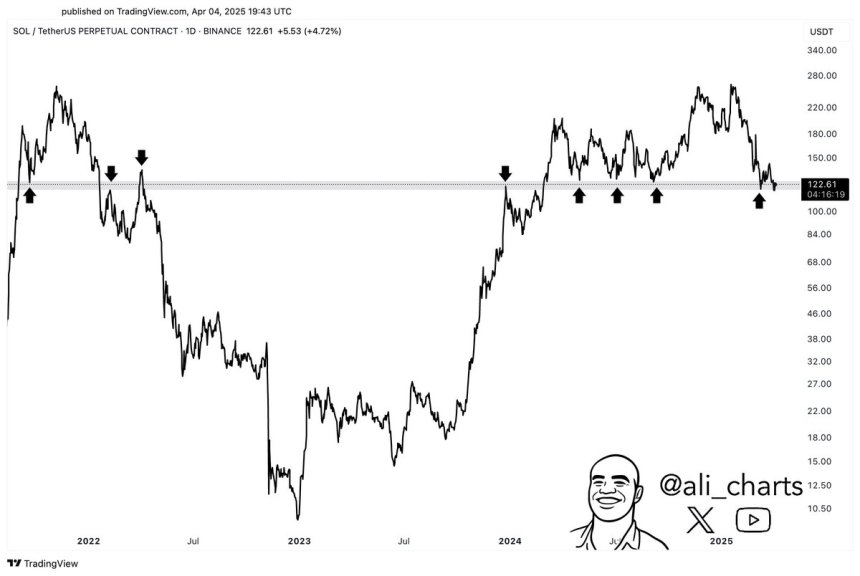
Top crypto analyst Ali Martinez recently shared an important technical analysis, identifying $120 as a critical make-or-break zone for Solana. According to Martinez, this level has historically marked major shifts in SOL’s price trajectory, often acting as the tipping point between recovery and further decline. With Solana now hovering dangerously close to this threshold, traders are watching closely to see whether it can hold or break.
If $120 fails to act as support, it could trigger a deeper correction. On the flip side, holding this level could offer bulls a base to mount a potential comeback — especially if market conditions stabilize. For now, Solana remains in a vulnerable position, and how it behaves around this key level may define its direction in the weeks ahead.
Solana Holds Critical Demand As Global Trade War Tensions Grow
Solana is trading at a critical demand zone as selling pressure intensifies across the crypto market, driven by escalating global tensions and trade war fears. On Liberation Day, US President Donald Trump announced sweeping new tariffs, sparking strong responses from major economies like China. The fallout has shaken investor confidence across all markets, including crypto, where risk assets are feeling the weight of heightened uncertainty and reduced appetite.
Solana (SOL) has been especially vulnerable, with price action slipping toward key support levels. Analysts warn that if current demand fails to hold, the downtrend could accelerate. The next few days will be crucial, as continued weakness into next week could confirm a bearish breakdown. Many traders are already preparing for more downside if the market doesn’t stabilize soon.
Martinez recently highlighted the importance of the current support zone. According to his analysis, the $120 level is a decisive make-or-break point for Solana. This zone has historically marked major trend reversals and shifts in momentum. A failure to hold above it could lead to a deeper correction, while a bounce from this level could spark a recovery.
With SOL already 60% down from its all-time highs, bulls are on the defensive. If they can defend $120, there’s still hope for a reversal — but losing it may signal that the broader bearish trend remains intact. In the days ahead, all eyes will be on Solana’s ability to hold the line as macro pressure continues to shape the crypto market’s direction.
Key Weekly Support Faces Breakdown Risk
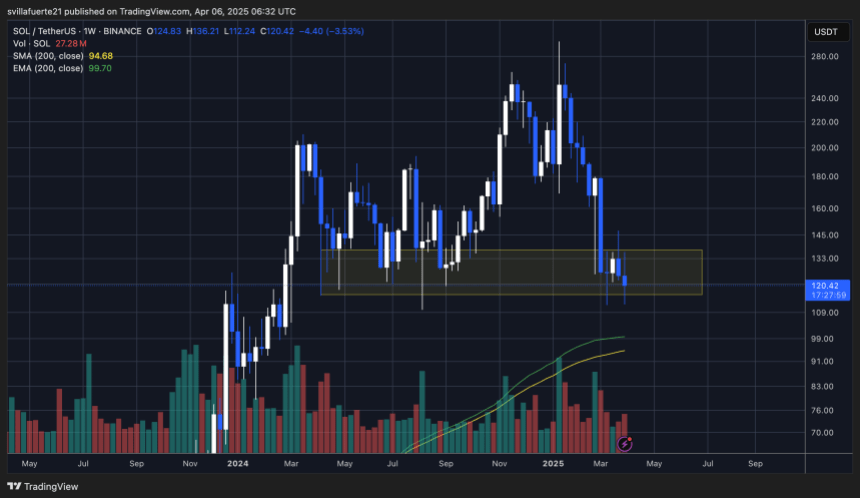
Solana is currently trading at $120, on track to record its lowest weekly close since February 2024. After weeks of selling pressure and repeated rejections below the $150 level, bulls are running out of time to defend key support. The inability to reclaim $150 — a major resistance zone — has kept SOL trapped in a bearish structure, with momentum firmly in favor of the bears.
For any hopes of a recovery rally to take shape, Solana must reclaim $150 in the coming days. That level remains the gateway to higher demand zones and a shift in short-term trend. However, if price action continues to weaken and $120 fails to hold, the next logical target is much lower — around the weekly 200-day MA and EMA, both converging near $95.
This would represent a critical breakdown and likely trigger additional downside pressure, particularly if broader market conditions remain fragile. With macroeconomic uncertainty and trade war tensions weighing heavily on sentiment, Solana’s position looks increasingly vulnerable. Unless bulls step in soon, SOL could be facing a deeper retracement as it tests long-term support zones not seen since late 2023.
Featured image from Dall-E, chart from TradingView
Grok 3 adjusts its predictions based on evolving market trends by analyzing real-time data patterns.
Combining technical analysis with sentiment data improves accuracy; Grok 3 effectively identifies potential trade opportunities.
Backtesting strategies before live trading is crucial; testing Grok 3’s prompts using historical data helps refine conditions and improve performance.
While Grok 3 can automate trades, human oversight remains critical in adapting to unexpected market conditions.
Crypto trading is complex. Prices can swing wildly, and even experienced traders struggle to keep up. That’s why automation tools are gaining attention, with many now exploring Grok 3, an advanced artificial intelligence (AI) model from xAI (founded by Elon Musk).
Grok 3 wasn’t built specifically for trading, but its ability to analyze data, spot patterns and interpret trends has encouraged traders to test it for automated strategies. The idea is simple: Let Grok 3 make data-driven decisions, removing the emotional guesswork that often leads to poor trades.
But does it actually work? Some traders report impressive results, while others find it unpredictable, especially in volatile markets.
This article digs into what happens when you automate crypto trades with Grok 3. From successful strategies to unexpected risks, you’ll get a clear picture of what to expect, plus actionable tips to improve your results.
What is Grok 3 and how does it relate to crypto trading?
Grok 3 is an AI model designed by xAI, an artificial intelligence company founded by Elon Musk. While its primary focus is natural language processing, some traders are now testing Grok 3 as a potential tool for improving crypto trading strategies. Unlike traditional trading bots operating on rigid rules, Grok 3’s flexible design allows it to analyze diverse data sources and uncover patterns that might be overlooked.
Why some traders are turning to Grok 3
Grok 3’s appeal lies in its ability to handle complex data, a crucial advantage in crypto markets, where price moves are often triggered by unexpected events or sentiment shifts.
Here’s where traders say Grok 3 has potential:
Identifying market sentiment trends: Crypto markets are heavily influenced by emotions like FOMO (fear of missing out) and FUD (fear, uncertainty, doubt). Grok 3 can analyze social media, news headlines and community discussions to assess changing sentiment, a key factor in crypto volatility.
Recognizing hidden patterns: Grok 3’s machine learning capabilities allow it to detect subtle correlations between indicators that traditional bots may overlook. For instance, Grok 3 may link an increase in social sentiment with rising whale activity to predict bullish momentum.
Flexible analysis based on prompts: Rather than following static rules like “Buy when RSI falls below 30,” Grok 3 enables traders to design more complex strategies using natural language instructions.
What happens when Grok 3 is used to automate crypto trades?
Grok 3 isn’t your typical crypto trading bot. It doesn’t place trades directly or integrate with exchanges on its own. But it can help traders build smarter, faster and more flexible automation systems. From writing trade logic to analyzing market sentiment, Grok 3 is already being used in the real world to streamline how crypto strategies are created and tested.
Instead of manually scripting every piece of logic, traders are now using Grok 3 to generate working code for bots. For example, a user asked Grok 3 to write token buy/sell logic with parameters like slippage, take-profit and gas priority fees. It generated a script that can be plugged into DeFi tools or expanded with 0x and Uniswap APIs.
Some traders use Grok 3 to build end-to-end bots tailored to niche tokens or specific strategies. In another example, Grok 3 was used to create an automated system that scans price action and triggers trades under strict conditions. It doesn’t just stop at buy/sell logic. Grok also writes portfolio rebalancing scripts and can simulate how positions would perform under different volatility conditions.
Here is an example of a prompt fed into Grok 3, along with the output received.
Grok 3’s response: High-frequency trading bot framework for Solana (SOL)
Below is a structured outline for a high-frequency trading bot framework designed for Solana (SOL), focusing on one-minute price fluctuations, risk management and trade execution. This outline provides a modular structure with placeholders for key components, avoiding specific implementation details as requested.
1. Core configuration
Purpose: Define global settings and constants for the bot.
Components:
Solana network endpoint (e.g., mainnet RPC URL)
Wallet configuration (private key or keypair for trading)
Trading pair (e.g., SOL/USDC)
Timeframe (one-minute candlestick data)
Trade size ($100 per position)
Max trades (10 concurrent or sequential positions)
Profit target ($50 total)
Max loss per trade ($20)
2. Data acquisition module
Purpose: Fetch and process real-time SOL price data.
Components:
WebSocket connection to Solana blockchain or exchange API (e.g., Serum, Raydium, or centralized exchange like Binance)
1-minute OHLCV (Open, High, Low, Close, Volume) data stream
Data buffer for storing recent price history
Error handling for connection drops or latency
3. Volatility analysis module
Purpose: Assess SOL’s price volatility to inform trade decisions.
Components:
Placeholder: Calculate short-term volatility (e.g., standard deviation or ATR over one-minute candles)
This framework assumes integration with Solana’s ecosystem (e.g., using a DEX or liquidity pool). Adjust the execution module if targeting a centralized exchange.
Volatility analysis and signal generation are left as placeholders for customization (e.g., technical indicators or machine learning models).
Risk management is strict to align with the $50 profit goal and $20 max loss per trade, ensuring the bot operates within defined boundaries.
Caution! The above is a tailored outline shaped by the user’s prompt, targeting one-minute price fluctuations, risk management and trade execution. Its output varies with prompt detail, as specificity sharpens results. Moreover, placeholders like volatility analysis await user customization, reflecting Grok 3’s adaptive learning. It’s a conceptual guide, not code, and success hinges on implementation and market conditions. For deeper refinement, such as Solana-specific tweaks, users can provide more context. Grok 3 adjusts using their input and its latest insights.
Let’s learn the general steps required to set up Grok 3 for automated crypto trading.
How to set up Grok 3 for automated crypto trading
Setting up Grok 3 for AI-powered crypto trading automation isn’t as straightforward as installing a typical trading bot. Since Grok 3 wasn’t built for direct trading, it requires thoughtful setup, integration and customization. Below is a practical guide to setting up Grok 3 effectively for automated crypto trading with AI (artificial intelligence).
Step 1: Choosing a compatible trading platform
Since Grok 3 doesn’t connect directly to crypto exchanges, it requires integration with third-party platforms that support API automation. Platforms like:
3Commas: Ideal for executing trades via automated strategies.
TradingView: Used for generating trade signals using Pine Script.
CryptoHopper: Offers custom strategy-building tools with API integration.
Ensure that the chosen platform offers robust API support for managing trade execution, setting risk controls and tracking performance.
Step 2: Integrating Grok 3 with the trading platform
API integration via automation tools: Platforms like Zapier or Make.com can connect Grok 3’s analysis to trading platforms.
Custom Python scripts: For tech-savvy traders, Grok 3’s insights can be processed through Python scripts that execute trades based on Grok 3’s recommendations.
No-code automation tools: Services like IFTTT can trigger basic trading actions based on Grok 3’s sentiment analysis.
Step 3: Defining trading strategies with Grok 3
Grok 3’s success hinges on well-defined strategies. Unlike traditional bots that rely solely on technical signals, Grok 3 crypto trading bot can combine multiple factors, including:
Technical indicators: RSI, MACD, Bollinger Bands, etc.
Sentiment analysis: Social media trends, influencer opinions and news headlines
Position limits: Restricts trade size to reduce exposure in uncertain markets.
Trailing stops: Locks in profits during upward trends while minimizing downside risk.
Example of risk control prompt: “Write a code to handle buying and selling a token with the given parameters, including priority fees, slippage, and a take-profit mechanism.”
Please note that the output shown above is not complete and is provided for illustration purposes only.
Step 6: Ongoing monitoring and strategy refinement
Grok 3’s strength lies in its adaptability, but it requires ongoing monitoring to ensure optimal results. Regularly review:
Performance data: Assess win rates, profit margins and signal accuracy.
Market conditions: Adjust strategy if major shifts (e.g., regulatory changes or macroeconomic factors) impact sentiment or momentum.
Despite its strengths, Grok 3 has limitations that traders must consider.
Data loss: Crypto trading thrives on accurate and real-time data. However, crypto trading automation with Grok 3 has been reported to lose chunks of data, miscount words and provide incorrect time references, which can be detrimental in a fast-moving market and result in inaccurate signal detection, delayed responses to market events and flawed strategy execution.
No direct exchange integration: Unlike purpose-built trading bots, Grok 3 doesn’t connect directly to crypto exchanges. Traders must rely on third-party platforms to execute trades.
Forgetfulness: One of the biggest frustrations highlighted by some users is Grok 3’s “retrograde amnesia,” when it forgets everything from previous sessions. For crypto traders, this is a nightmare. Imagine building a trading strategy and needing Grok 3 to remember past trends and conversations, only for it to start fresh each session.
Bias: Grok 3 may deliver biased responses, potentially relying on incomplete or skewed sources. For traders who depend on unbiased sentiment analysis to gauge market mood, this shift could lead to misleading insights and poor decision-making.
Slower execution speed: Since Grok 3 processes information based on detailed prompts, its trade signals may lag behind fast-moving price changes.
Prompt dependence: Grok 3’s accuracy depends heavily on well-structured prompts. Vague or incomplete instructions often produce unreliable results.
While Grok-3 and other AI systems offer powerful tools for automating crypto trades, caution is essential. Their performance depends heavily on the quality of data and the strategies they’re programmed with, meaning unexpected market shifts or flawed inputs can lead to significant losses.
Remember, AI lacks human intuition and may struggle with unprecedented events, so relying solely on it without oversight is risky. Always test strategies with small amounts first and get help from experts before making large investments.
Nearly 400,000 creditors of the bankrupt cryptocurrency exchange FTX risk missing out on $2.5 billion in repayments after failing to begin the mandatory Know Your Customer (KYC) verification process.
Roughly 392,000 FTX creditors have failed to complete or at least take the first steps of the mandatory Know Your Customer verification, according to an April 2 court filing in the US Bankruptcy Court for the District of Delaware.
FTX users originally had until March 3 to begin the verification process to collect their claims.
“If a holder of a claim listed on Schedule 1 attached thereto did not commence the KYC submission process with respect to such claim on or prior to March 3, 2025, at 4:00 pm (ET) (the “KYC Commencing Deadline”), 2 such claim shall be disallowed and expunged in its entirety,” the filing states.
The KYC deadline has been extended to June 1, 2025, giving users another chance to verify their identity and claim eligibility. Those who fail to meet the new deadline may have their claims permanently disqualified.
According to the court documents, claims under $50,000 could account for roughly $655 million in disallowed repayments, while claims over $50,000 could amount to $1.9 billion — bringing the total at-risk funds to more than $2.5 billion.
The next round of FTX creditor repayments is set for May 30, 2025, with over $11 billion expected to be repaid to creditors with claims of over $50,000.
Under FTX’s recovery plan, 98% of creditors are expected to receive at least 118% of their original claim value in cash.
Many FTX users have reported problems with the KYC process.
However, users who were unable to submit their KYC documentation can resubmit their application and restart the verification process, according to an April 5 X post from Sunil, FTX creditor and Customer Ad-Hoc Committee member.
Impacted users should email FTX support (support@ftx.com) to receive a ticket number, then log in to the support portal, create an account, and re-upload the necessary KYC documents.
The crypto industry is still recovering from the collapse of FTX and more than 130 subsidiaries launched a series of insolvencies that led to the industry’s longest-ever crypto winter, which saw Bitcoin’s (BTC) price bottom out at around $16,000.
While not a “market-moving catalyst” in itself, the beginning of the FTX repayments is a positive sign for the maturation of the crypto industry, which may see a “significant portion” reinvested into cryptocurrencies, Alvin Kan, chief operating officer at Bitget Wallet, told Cointelegraph.
Despite a widespread weekly gain in the crypto market, Chainlink (LINK) remains under significant bearish pressure printing losses across multiple time frames. Since hitting a local price peak of $29.28 in December, the altcoin has slipped into a downtrend losing over 56% since then. Amid this negative performance, top crypto analyst Ali Martinez postulates LINK could soon experience some short-term price gain.
LINK Recovery Depends On Critical Trendline Support
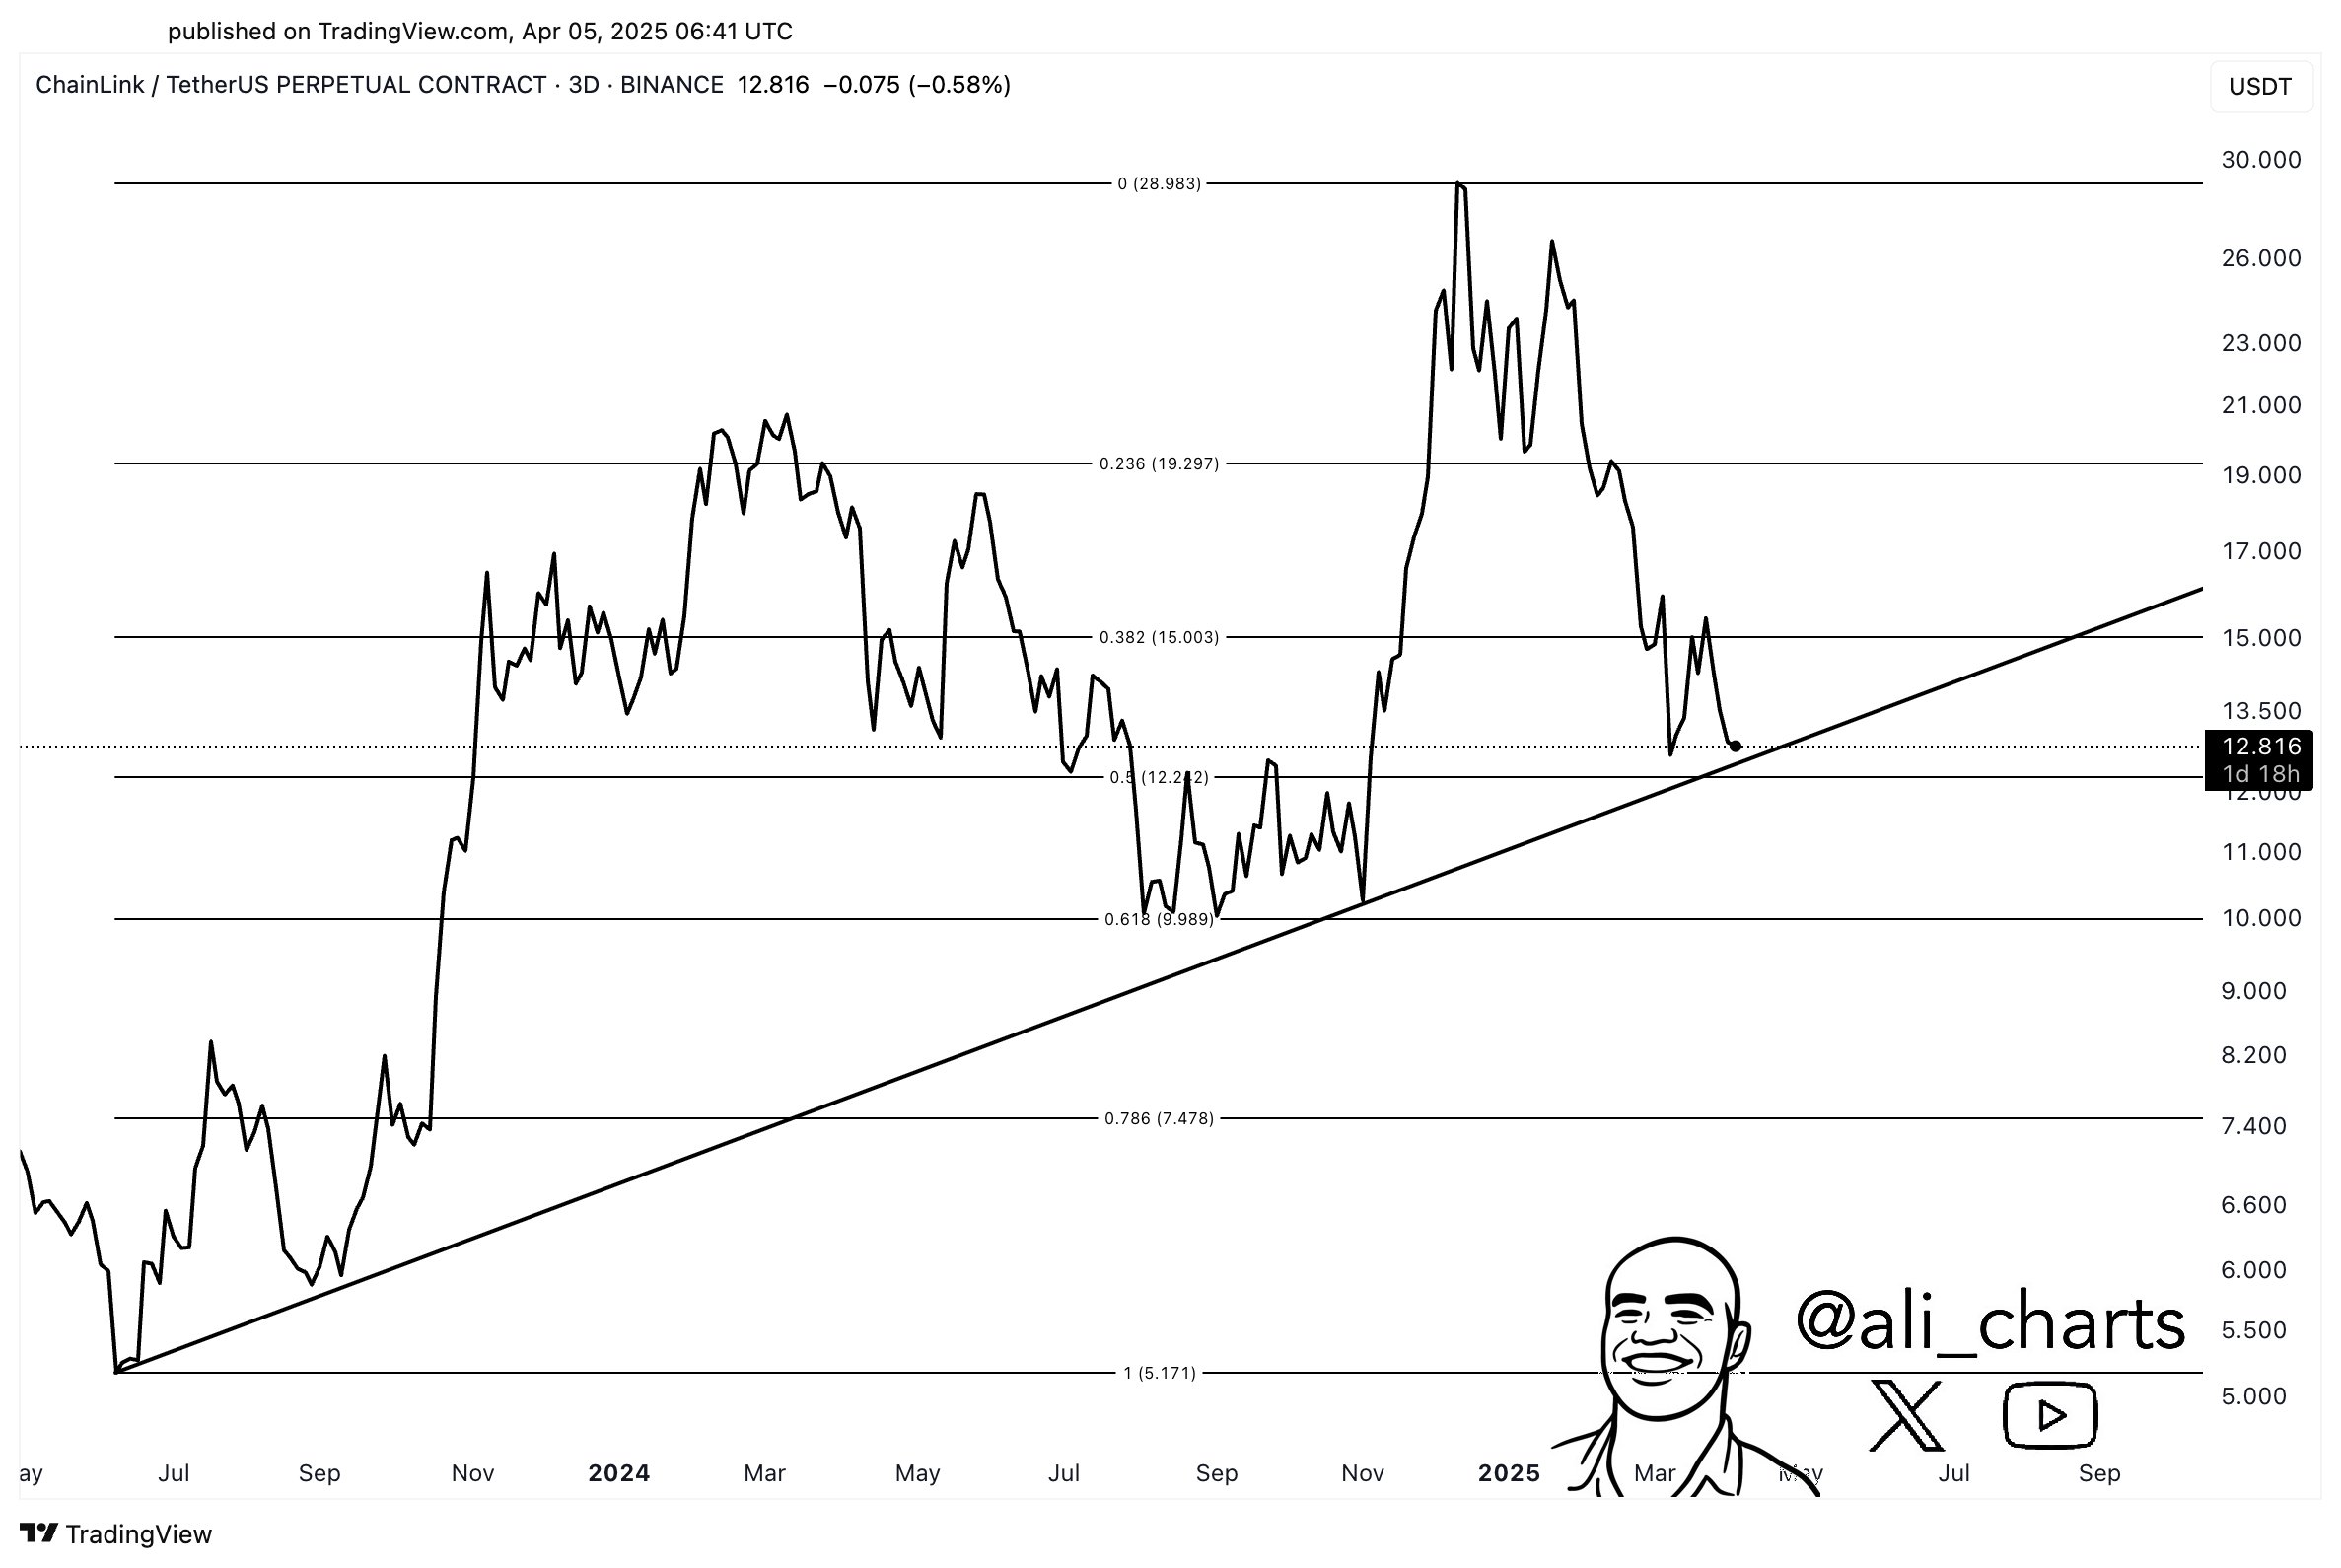
In a recent post on X, Martinez shares a positive technical outlook on LINK hinting the altcoin is likely to experience an upswing. This price forecast is based on a crucial ascending trendline that has acted as price support since mid-2023, ensuring a consistent formation of higher lows and higher highs.
Based on the trading chart by Martinez, Chainlink is currently heading for a retest with the identified trendline near the 0.5 Fibonacci retracement level at $12.00. If LINK bulls can induce a sufficient surge in demand at this level, the following price bounce could ignite a bullish reversal. Looking at historical price patterns, such a price rally could drive Chainlink’s price to around $19, which represents the next resistance zone.
In the presence of robust buying pressure, the altcoin could even rise as high as $30 suggesting a potential 147% price increase on current market prices. On the other hand, a failure to stay above $12.00 would cause an initial price decline to around $10.00, with the potential to trade as low as $5.00.
Chainlink Integrated Into PayPal’s Ecosystem
In other news, prominent American payment platform PayPal Holdings has announced the inclusion of Chainlink in its crypto offerings. In a statement released on April 4, PayPal stated that users will now be able to buy, hold, send, and receive Chainlink and Solana (SOL) on both their PayPal and Venmo wallets.
This development marks a significant step in the mainstream integration of LINK which is crucial to driving token demand in the future. In addition to both tokens, PayPal also offers users access to Bitcoin (BTC), Ethereum (ETH), Litecoin (LTC), and Bitcoin Cash (BCH).
At press time, LINK continues to trade at $12.91 reflecting a 0.62% decline in the past 24 hours. On larger time frames, the token maintains a bearish form with losses of 5.03% and 21.81% in the past seven and thirty days respectively.
According to data from Coincodex, investor sentiments in the LINK market remain highly bearish with a Fear & Greed Index of 26 signaling near-extreme fear. However, the analysts at this firm foresee a price rebound similar to Martinez’s with a forecast of $15.32 in five days and $17.46 in a month.
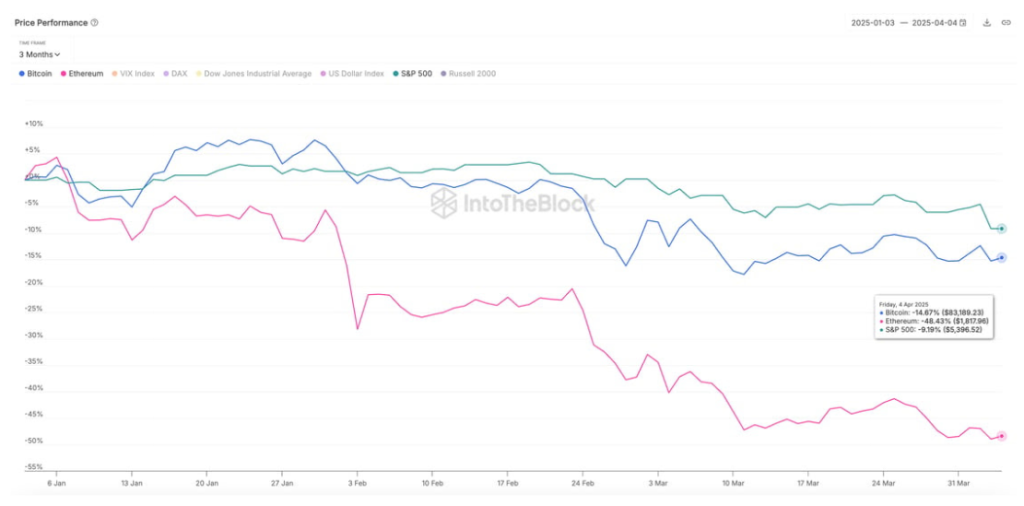
Ethereum and Bitcoin went through very different trajectories in the first quarter of 2025, and the divergence could not be more obvious. According to data from on-chain analytics firm IntoTheBlock, Ethereum underperformed significantly, dropping nearly 50% in value over the past three months.
Bitcoin, though also correcting, saw a smaller decline below 15%. This reflects a broader trend in the crypto market where inflows and interest went toward Bitcoin and a few altcoins, leaving Ethereum struggling to regain momentum.
Ethereum’s Underperformance Vs. Bitcoin In Q1
Bitcoin began Q1 on a notably bullish trajectory due to increasing institutional interest and strong inflows into Spot Bitcoin ETFs, a combination which pushed the price to a new all-time high of $108,786 on January 20. This price marked the peak of a steady upward movement that has placed Bitcoin firmly in the spotlight since October 2023.
However, a pronounced downtrend followed this peak, particularly in March, when the Bitcoin price dipped below $80,000 for the first time since November 2024. An already struggling Ethereum price fared much worse and broke below a strong support of $1,900.
Bitcoin has shown resilience since this break, bouncing back above $83,000 and even recently touching $87,000. On the other hand, Ethereum continues to trade below $1,900 and is now at risk of losing $1,800 and breaking below.
According to data from Cryptorank, Ethereum closed Q1 2025 with a 45.3% decrease from its quarterly open. This marks the second-worst Q1 performance for Ethereum, behind a 47.5% decline in Q1 2018. Bitcoin, on the other hand, ended Q1 2025 with an 11.7% decrease from its opening price.
Ethereum Price Direction: $1,800 On Crosshairs With Cautious Bullishness
Ethereum’s decline has been amplified by a visible drop in trading interest and inflows even in Spot Ethereum ETFs. Most of the attention has been on Bitcoin, with Solana, Dogecoin, and XRP taking the most significant share of interest in the altcoin market.
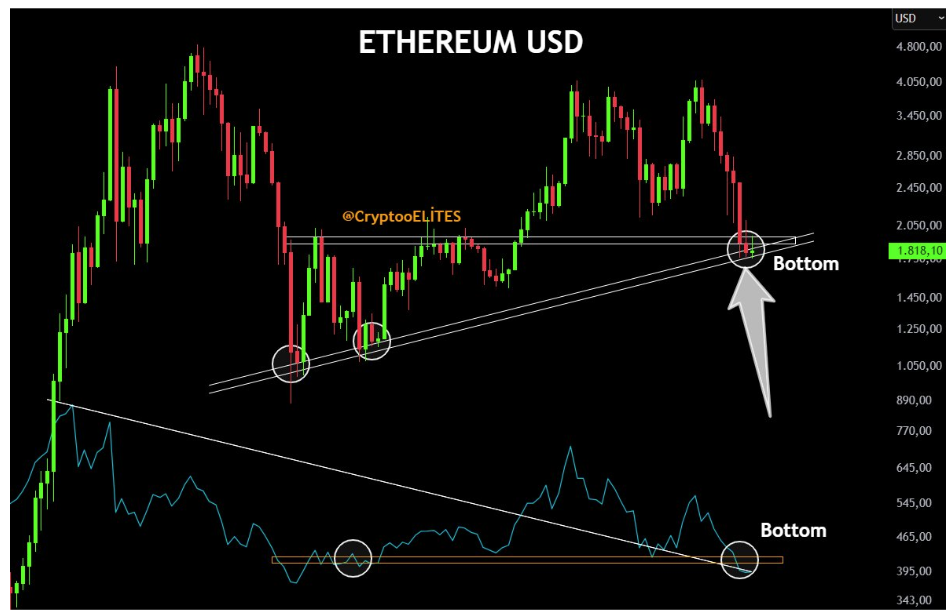
Nonetheless, many crypto analysts are still bullish on Ethereum and are on the outlook of a bounce as it is now nearing a bottom around $1,800. According to a crypto analyst (@CryptoELlTES ) on social media platform X, Ethereum at $1,800 is the bottom.
This outlook is based on this level, which acted as resistance in the 2022 bear market and is expected to flip to become support. Another analyst (Crypto Fella) noted that a reversal at this point “would be very good for alts,” suggesting a possible broader market recovery for altcoins if Ethereum finds solid footing here.
Bitcoin’s (BTC) recent stability amid Nasdaq turmoil driven by tariffs has generated excitement among market participants regarding the cryptocurrency’s potential as a haven asset. Still, the bulls might want to keep an eye on the bond market where dynamics that characterized the COVID crash of March 2020 may be emerging.
Nasdaq, Wall Street’s tech-heavy index known to be positively correlated to bitcoin, has dropped 11% since President Donald Trump on Wednesday announced reciprocal tariffs on 180 nations, escalating trade tensions and drawing retaliatory levies from China. Other U.S. indices and global markets have also taken a beating alongside sharp losses in the risk currencies like the Australian dollar and a pullback in gold.
BTC has largely remained stable, continuing to trade above $80,000, and its resilience is being viewed as a sign of its evolution into a macro hedge.
“The S&P 500 is down roughly 5% this week as investors brace for trade-driven earnings headwinds. Bitcoin, meanwhile, has shown impressive resilience. After briefly dipping below $82,000, it rebounded quickly, reinforcing its status as a macro hedge in times of macroeconomic stress. Its relative strength could continue to attract institutional inflows if broad market volatility persists,” David Hernandez, crypto investment specialist at 21Shares, told CoinDesk in an email.
The perception of stability could quickly transform into a self-fulfilling prophecy, solidifying BTC’s position as a haven asset for years to come, as MacroScope noted on X.
Treasury basis trade risks
However, sharp downside volatility in the short term cannot be ruled out, especially as the “Treasury market basis trade” faces risks due to heightened turbulence in bond prices.
The basis trade involves highly leveraged hedge funds, reportedly operating at leverage ratios of 50-to-1, exploiting minor price discrepancies between Treasury futures and securities. This trade blew up in mid-March 2020 as coronavirus threatened to derail the global economy, leading to a “dash for cash” that saw investors sell almost every asset for dollar liquidity. On March 12, 2020, BTC fell by nearly 40%.
“When market volatility spikes – as it is now – it unearths highly leveraged carry trades vulnerable to big market moves. The blowup in the US Treasury market in March 2020, which disrupted basis carry trades, is a recent example. Risk of leveraged carry trade blowups is high…,” Robin Brooks, managing director and chief economist at the International Institute of Finance, said.
The risk is real because, the size of the basis trade as of March end was $1 trillion, double the tally in March 2020. The positioning is such that a one basis point move in Treasury yields (which move opposite to prices) would lead to a $600 million shift in the value of their bets, according to ZeroHedge.
So, increased volatility in the Treasury yields could cause a COVID-like blowup, leading to a widespread selling of all assets, including bitcoin, to obtain cash.
On Friday, the MOVE index, which represents the options-based implied or expected 30-day volatility in the U.S. Treasury market, jumped 12% to 125.70, the highest since Nov. 4, according to data source TradingView.
The gravity of the situation is underscored by a recent Brookings Institution paper, which advises the Federal Reserve to consider targeted interventions in the U.S. Treasury market, specifically supporting hedge funds engaged in basis trading during times of severe market stress.
Renowned market analyst Egrag Crypto has shared another puzzling XRP price prediction stating the altcoin is at a major technical crossroads. This development follows a resilient price performance in the past week during which XRP gained by 2.07% as the broader crypto market stands bullish despite the announcement of new US trade tariffs.
Ascending Wedge Signals Incoming Volatility — Which Way Will XRP Break?
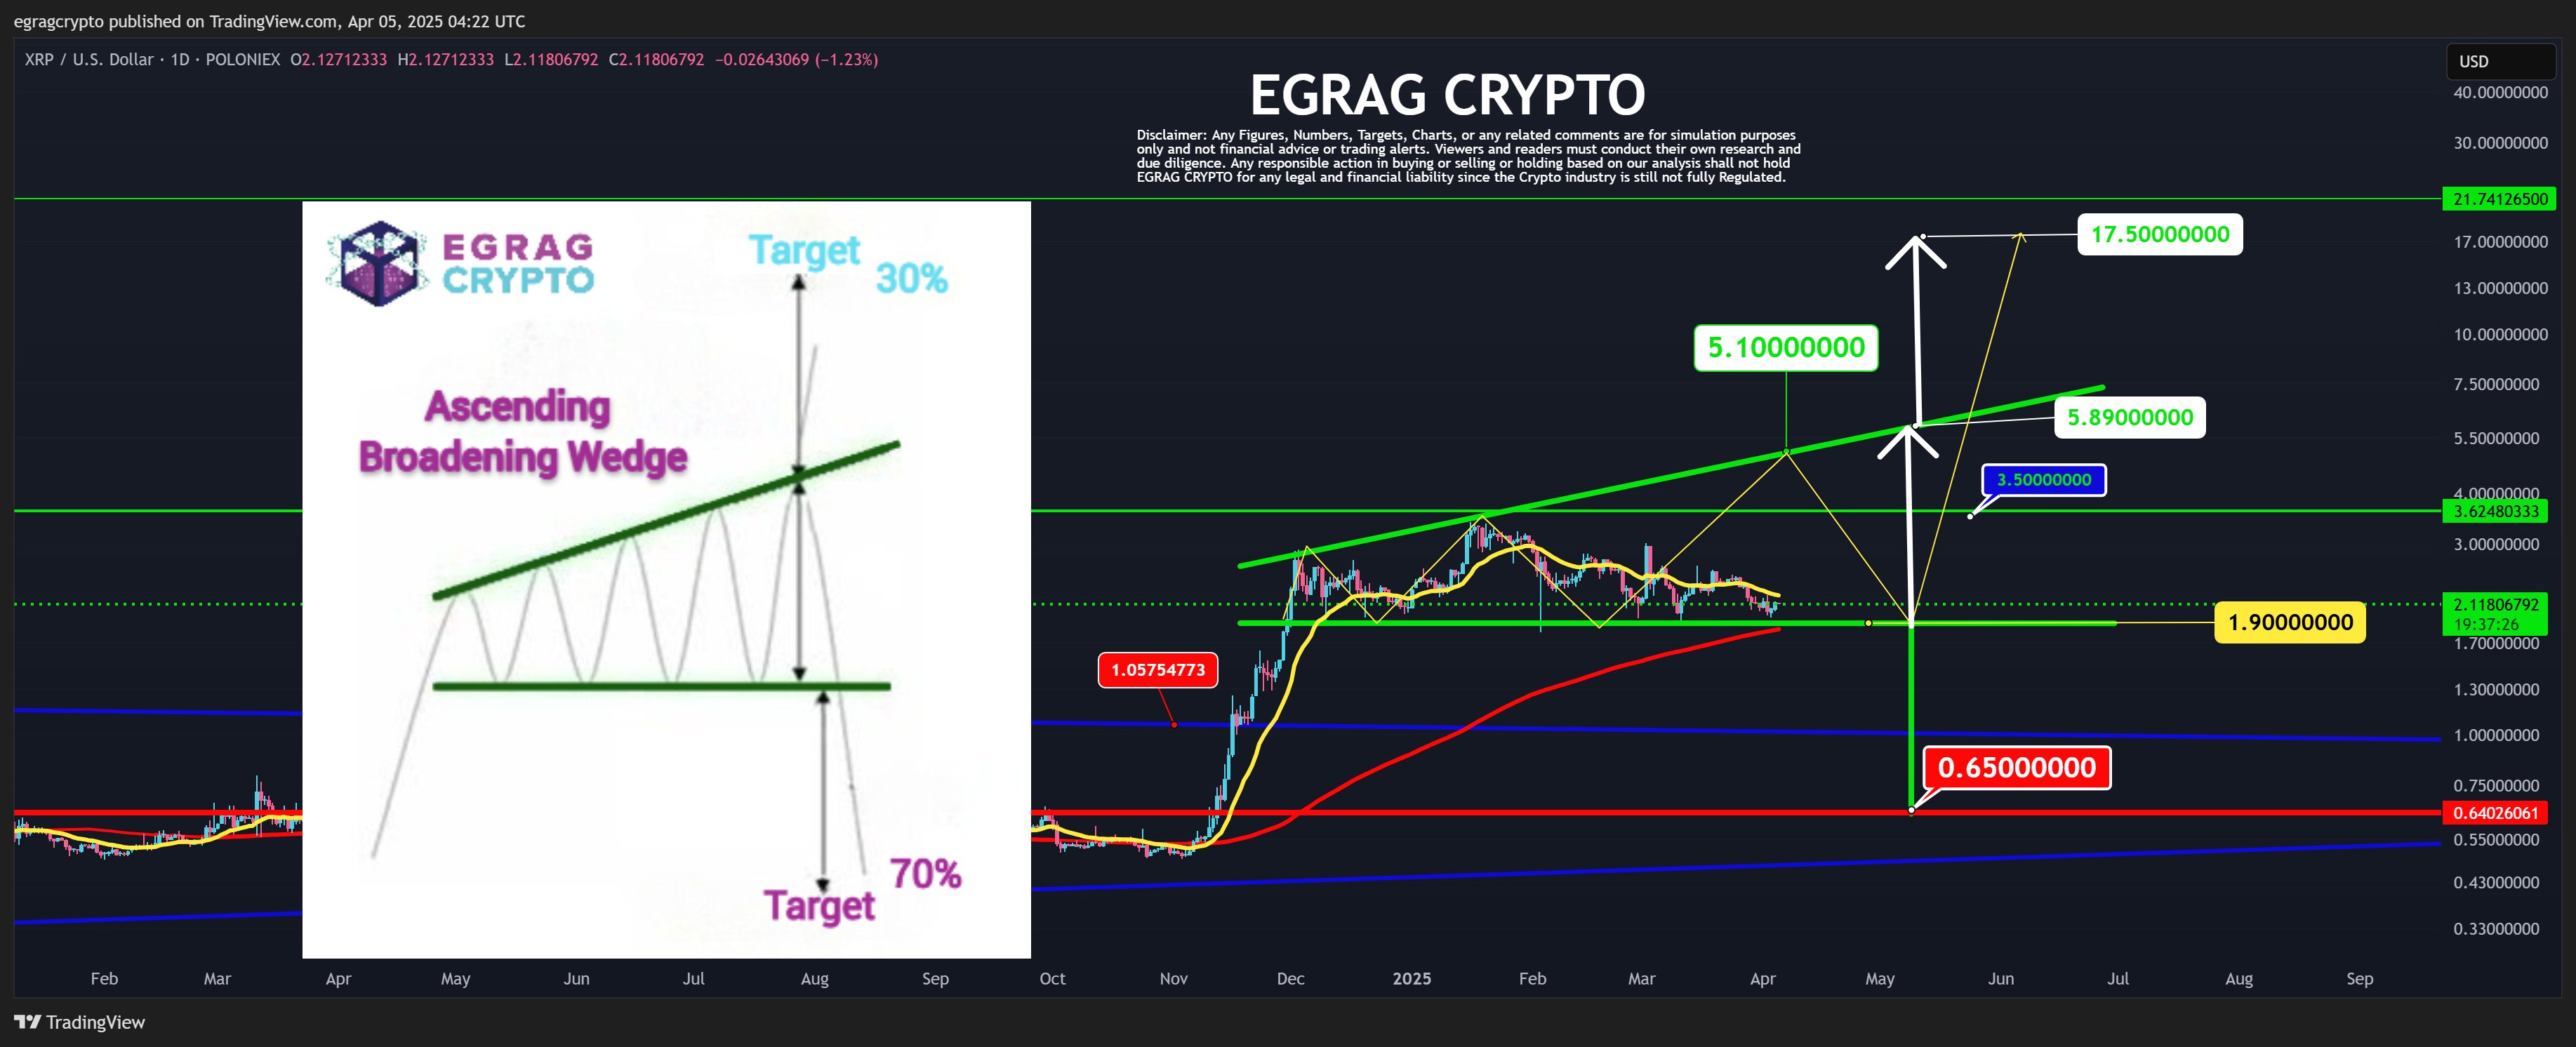
In an X post on April 5, Egrag Crypto issued a dual price forecast on the XRP market based on the potential implications of a forming Ascending Broadening Wedge pattern. Also known as the megaphone pattern, the chart formation signals increasing volatility and investor indecisions. It looks like a widening triangle with two diverging trendlines, as seen in the chart below.
The Ascending Broadening Wedge presents high unpredictability and offers a 70% chance of a downside breakout and a 30% probability of an upside breakout. However, despite this statistical bias, the analyst postulates the chances of an upside remain valid if certain conditions are met.
According to the analyst, XRP must first close above $3.50 for a bullish scenario to start taking shape. In doing so, the altcoin would surpass the local peak of the current bull cycle and confirm intentions of an upward momentum. Following this move, XRP bulls should then aim for the $5 range—another key resistance level that could determine the asset’s next major move.
Interestingly, Egrag explains that a failure to convincingly close above $5 would only be a critical development that completes the formation of the Ascending Wedge Pattern and increases the likelihood of a breakout. If this rejection occurs, XRP is expected to retest the $1.90 area and make a second push toward the $5, this time breaking through and closing above $6.
Egrag states the breakout above $6 would validate the bullish run and likely spark a surge toward double-digit territory with a potential target at $17.50 based on the Ascending Wedge Pattern. However, should XRP bulls fail to meet these conditions or follow this sequence, the historical 70% chance of a breakdown points to a downside target of around $0.65.
XRP Price Overview
At the time of writing, XRP trades at $2.14 reflecting a price gain of 0.60% in the past day. Meanwhile, the token’s trading volume is down by 62.92% in the past day indicating a fall in market engagement and a declining buying pressure following the recent market gain. In making any significant uptrend, XRP bulls must first reclaim the following resistances at $2.47 and $2.61 while avoiding any slip below the $2 support zone.
Crypto-friendly billionaire investor Bill Ackman is considering the possibility that US President Donald Trump may pause or push back the implementation of his controversial proposed tariffs on April 7.
“One would have to imagine that President Donald Trump’s phone has been ringing off the hook. The practical reality is that there is insufficient time for him to make deals before the tariffs are scheduled to take effect,” Ackman, founder of Pershing Square Capital Management, said in an April 5 X post.
Trump may postpone tariffs to make more deals, says Ackman
“I would, therefore, not be surprised to wake up Monday with an announcement from the President that he was postponing the implementation of the tariffs to give him time to make deals,” Ackman added.
On April 2, Trump signed an executive order establishing reciprocal tariffs on trading partners and a 10% baseline tariff on all imports from all countries, which took effect on April 5. Harsher tariffs targeting countries with which the US has the largest trade deficits are scheduled to kick in on April 9.
Ackman — who famously said “crypto is here to stay” after the FTX collapse in November 2022 — said Trump captured the attention of the world and US trading partners, backing the tariffs as necessary after what he called an “unfair tariff regime” that hurt US workers and economy “over many decades.”
Following Trump’s announcement on April 2, the US stock market shed more value during the April 4 trading session than the entire crypto market is currently worth. The fact that crypto held up better than the US stock market caught the attention of both crypto industry supporters and skeptics.
Prominent crypto voices such as BitMEX co-founder Arthur Hayes and Gemini co-founder Cameron Winklevoss also recently showed their support for Trump’s tariffs.
Ackman said a pause would be a logical move by Trump — not just to allow time for closing potential deals but also to give companies of all sizes “time to prepare for changes.” He added:
“The risk of not doing so is that the massive increase in uncertainty drives the economy into a recession, potentially a severe one.”
Ackman said April 7 will be “one of the more interesting days” in US economic history.
Following the downturn in the United States’ traditional markets, there has been increased commentary about the crypto bull cycle and its current phase. Nonetheless, the Bitcoin market has remained relatively steady compared to the blue-chip stocks in the US equities market over the past few days.
The price action of Bitcoin has been disappointing yet again this weekend, slipping below the $83,000 mark in the early hours of Saturday, April 5. A prominent crypto analyst has emerged with fresh insight on the future trajectory of the premier cryptocurrency.
BTC Price At Risk Of Sales Pressure?
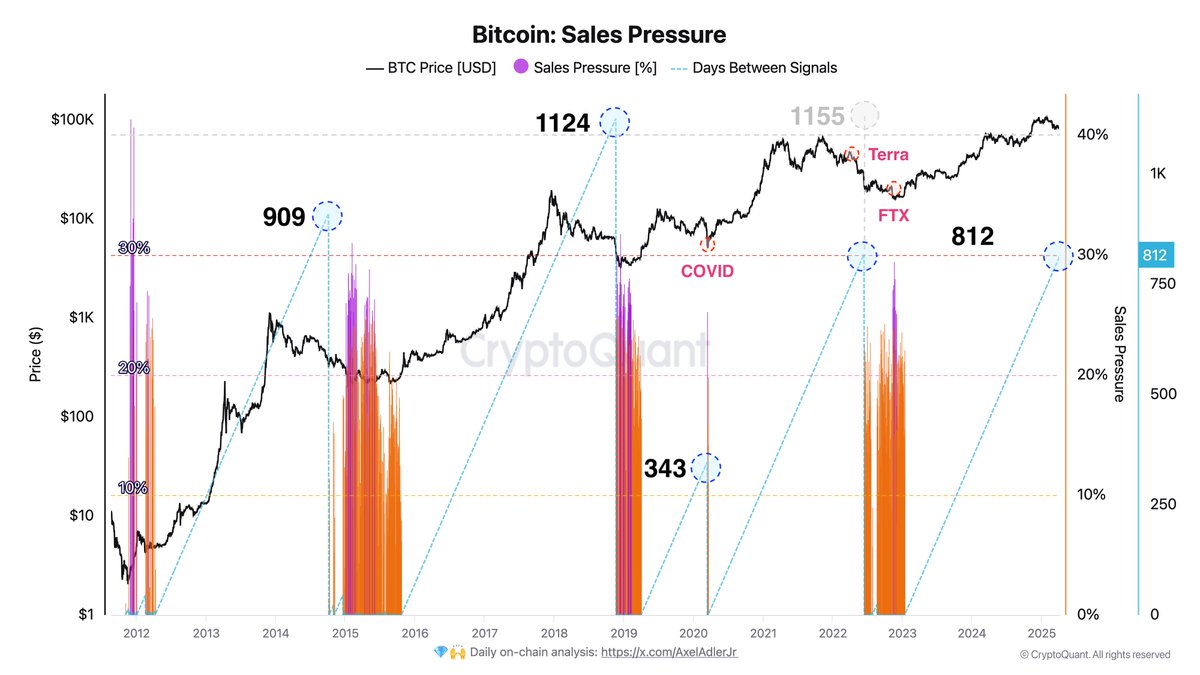
In a recent post on the X platform, crypto analyst Axel Adler Jr. reviewed how the Bitcoin price is faring amid the turbulent macroeconomic headwinds. The relevant on-chain indicator here is the Bitcoin Sales Pressure model, which combines the Net Unrealized Profit/Loss (NUPL) and Spent Output Profit Ratio (SOPR) metrics.
Based on the NUPL and SOPR indicators, the Bitcoin Sales Pressure model tracks when long-term holders may begin selling off their assets, often marking cyclical tops or the start of downward pressure in the market. According to Adler Jr., genuine sales pressure for a digital asset may emerge after 800 days.
The analyst noted:
If, during a bullish rally, no serious negative event akin to a “Black Swan” occurs – triggering fear and forced selling – it could take over 1000 days for sales pressure to develop.
As observed in the chart above, the indicator has reached the 800-day mark, which suggests an increased risk for genuine sales pressure. However, the Bitcoin price has been displaying strength despite the brewing global trade war weighing down on the US equities market. Adler Jr. attributed BTC’s show of resilience to institutional buying, the lack of sales pressure in the spot market, and neutral sentiment in the futures market.
The stock market atmosphere does not seem set for recovery, especially with the VIX (volatility index) rising above 30 while the S&P 500 falling by more than 4%. Crossing these thresholds has been historically associated with further downward pressure for the stock market.
In response to the dwindling market sentiment, US President Donald Trump is believed to have called on the Federal Reserve to resume aggressive monetary stimulus. “We all understand that this could stimulate market growth,” Adler Jr. added.
Bitcoin Price At A Glance
As of this writing, the price of BTC stands at around $83,350, reflecting an almost 1% jump in the past 24 hours.
Bitcoin has maintained its price above $80,000 despite a massive sell-off in US stocks last week, sparking debate about its changing relationship with traditional risk assets.
Bitcoin Holds Ground While Stocks Tumble
The US stock market lost $2.85 trillion on April 3, followed by another staggering drop of $3.25 trillion by the end of Friday’s trading session. According to market analysts, this represents the worst two-day market decline in five years. The sell-off came in response to US President Donald Trump’s tariff increases, which sent investors rushing to pull their money out of stocks.
But while stocks fell, Bitcoin took a different path. The cryptocurrency remained stable, even seeing price increases during this period. As of the latest trading data, BTC is priced at $83,205, showing a 1.3% increase over the past week.
Crypto Market Welcomes $5.4 Billion In Fresh Money
In what some market watchers call a surprising turn, cryptocurrency markets received about $5.4 billion in new investments on Friday alone. This happened at the exact time investors were pulling billions from stocks, suggesting a possible shift in how people view the top crypto during uncertain times.
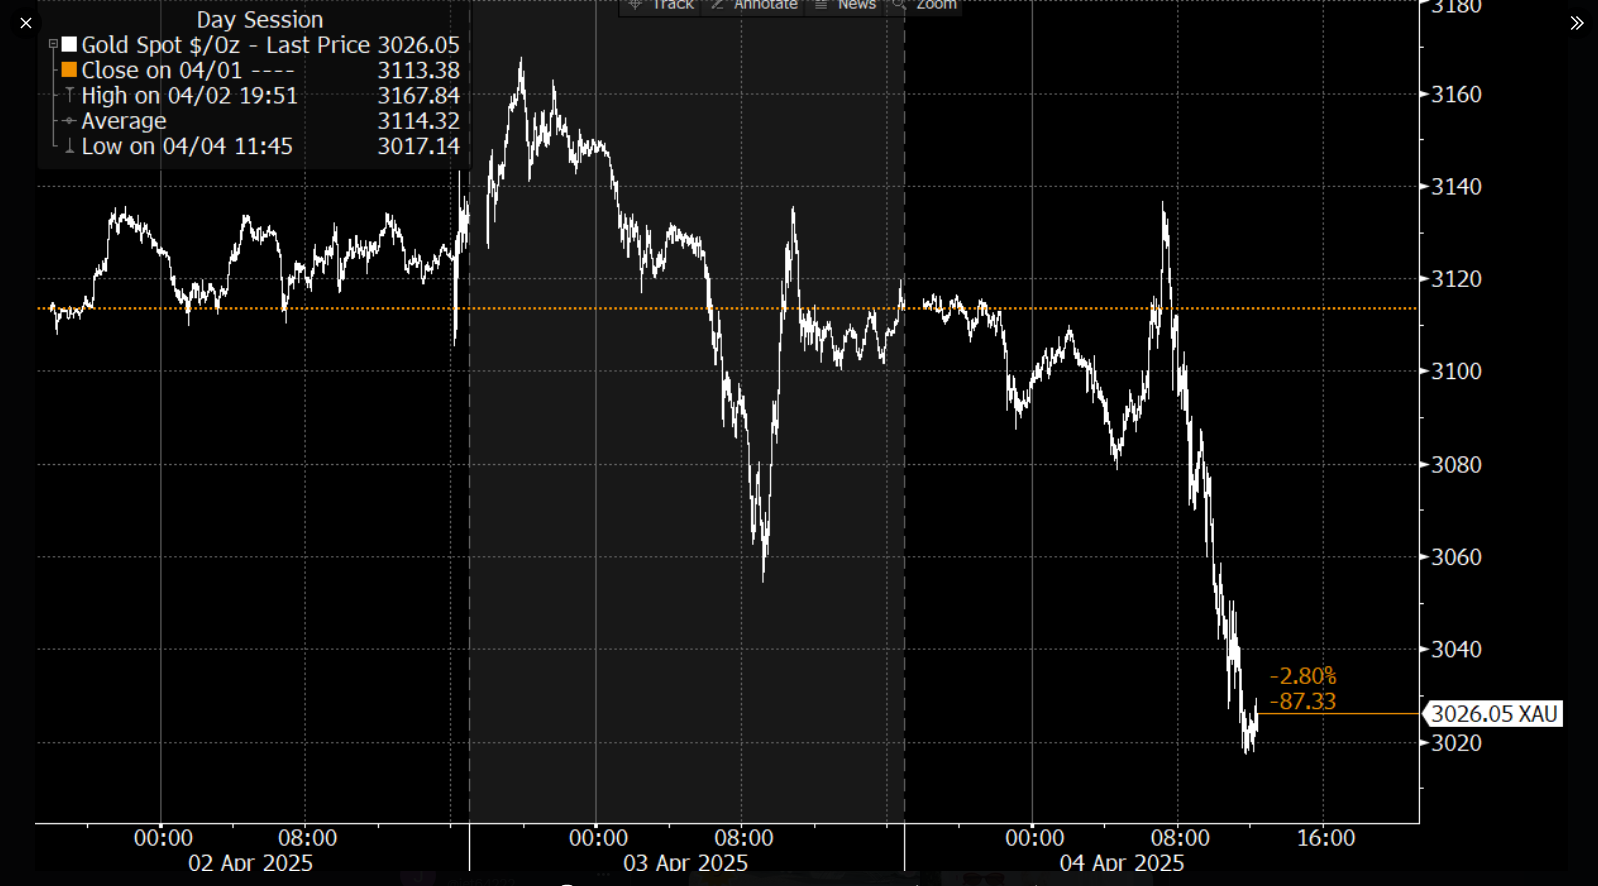
Even gold, which had recently hit a record high of $3,167 on April 3, dropped sharply to around $3,000 during Friday’s market troubles. Based on reports, Bitcoin’s price stability while both stocks and gold fell has caught the attention of many financial experts.
Market Experts Express Surprise At Crypto’s Performance
Bloomberg ETF analyst James Seyffart highlighted Bitcoin’s unexpected strength in an X post on April 4. He wrote that he was “genuinely shocked” by Bitcoin’s ability to remain above $80,000 while other assets fell.
Genuinely shocked a bit by Bitcoin’s resilience. Would not have guessed it would hold above $80k in this type of broader market selloff of risk assets…
Adam Back, co-founder of Blockstream, suggested this might signal that Bitcoin is finally breaking its pattern of following stock market movements. He proposed that market makers might be taking advantage of limited cash in the system to adjust Bitcoin’s typical correlation with stocks.
#bitcoin decoupling finally. was thinking the coupling was fake. maybe market makers using bitcoin market shortage of fiat liquidity to auto-correlate bitcoin, noticeable on US market open.
Companies Continue To Buy Bitcoin Despite Market Fears
According to the report, Bitcoin’s price stability might be linked to ongoing purchases by major companies. Strategy has returned to buying Bitcoin weekly after a brief pause, now in its third consecutive week of acquisitions.
Game retailer GameStop made headlines recently when it disclosed Bitcoin as its primary treasury asset. The company is seeking to raise $1.3 billion to acquire more Bitcoin, a Bloomberg analyst said.
These institutional purchasing trends might be generating sufficient demand to sustain Bitcoin prices despite pressure on conventional markets. Ongoing institutional demand indicates increasing confidence in Bitcoin as a store of value amidst market uncertainty.
Featured image from Gemini Imagen, chart from TradingView
The White House AI and crypto czar David Sacks says Meta’s release of its latest AI model, Llama 4, has pushed the United States into the lead in the global race for artificial intelligence dominance.
“For the US to win the AI race, we have to win in open source too, and Llama 4 puts us back in the lead,” Sacks said in an April 5 X post, as speculation continues to mount over the US and China competing for the top spot in the global AI race.
Sacks has been outspoken about the AI race since taking on his role following US President Donald Trump’s inauguration on Jan. 20. Just over a week into the job, Sacks said he is “confident in the US, but we can’t be complacent.”
Llama 4 “best in their class for multimodality,” says Meta
Sack’s latest comment came after Meta’s AI division said in an X post on the same day that it is introducing the fourth generation of its Llama models, Llama 4 Scout and Llama 4 Maverick.
“Our most advanced models yet and the best in their class for multimodality,” Meta said.
Meta said its Llama 4 Scout model has 17 billion active parameters and uses 16 experts.
The company claims it outperforms rival large language models — Gemma 3, Gemini 2.0 Flash-lite, and Mistral 3.1 — “across a broad range of widely accepted benchmarks.”
Meanwhile, Llama 4 Maverick also has 17 billion active parameters but is configured with 128 experts. Meta claimed the Maverick model can outperform GPT-4o and Gemini 2.0 Flash “across a broad range of widely accepted benchmarks.”
Llama 4 Maverick instruction-tuned benchmarks. Source: Meta
It also said Maverick can perform similarly to DeepSeek v3 on “reasoning and coding tasks” despite using only half the active parameters.
Less than a year ago, in July 2024, Meta CEO Mark Zuckerberg said that in 2025, he expects Llama models to become “the most advanced in the industry.” It has been just over two years since Meta first released the limited version of Llama 1 in February 2023.
At the time, Meta said it was “blown away” by the demand, receiving over 100,000 requests for access.
It’s been exactly a month since the Bitcoin price lost the $90,000 level, falling to around $77,000 in a single move. The premier cryptocurrency has yet to recover from this downturn, struggling to break out of the $82,000 – $87,000 range over the past few weeks.
As of this writing, the price of Bitcoin is hovering around the $83,000 level, reflecting a mere 1% decline in the past 24 hours. According to data from CoinGecko, BTC’s value has barely changed over the past seven days.
Here’s How Bitcoin Price Could Jump 15%
Popular crypto analyst Ali Martinez took to the X platform to share an exciting analysis of the price of Bitcoin. According to the online pundit, the market leader seems primed for a 15% move to the upside over the coming days.
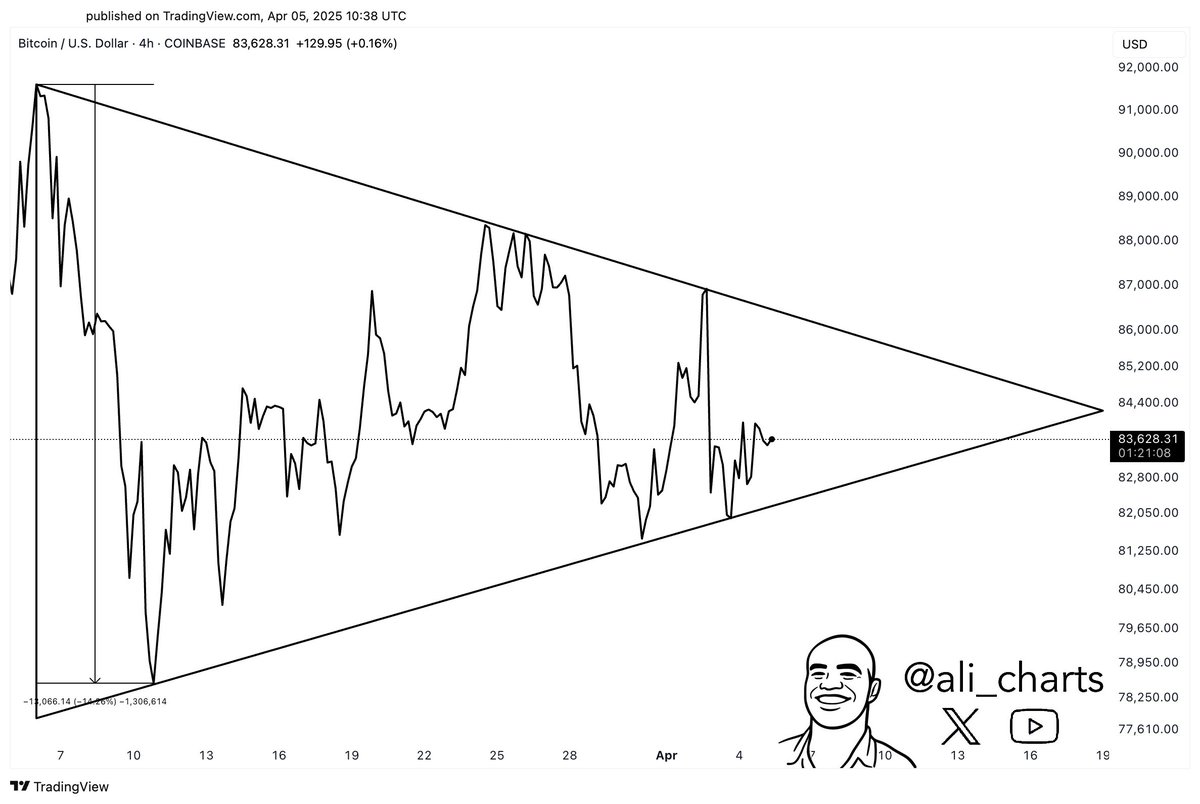
This bullish prediction is based on the formation of a symmetrical triangle on the four-hour Bitcoin price chart. The symmetrical triangle is a technical analysis pattern characterized by a diagonal falling upper trendline (connecting the swing highs) and a diagonally rising lower trendline (along the swing lows).
With its price narrowing towards the apex of the triangle, there is a likelihood that BTC will breach the upper trendline for a breakout. According to Martinez, if the Bitcoin price successfully breaks out of this pattern, investors could see the premier cryptocurrency register a bullish 15% move to around $95,000.
$87,000 Could Prove Pivotal To This BTC Move
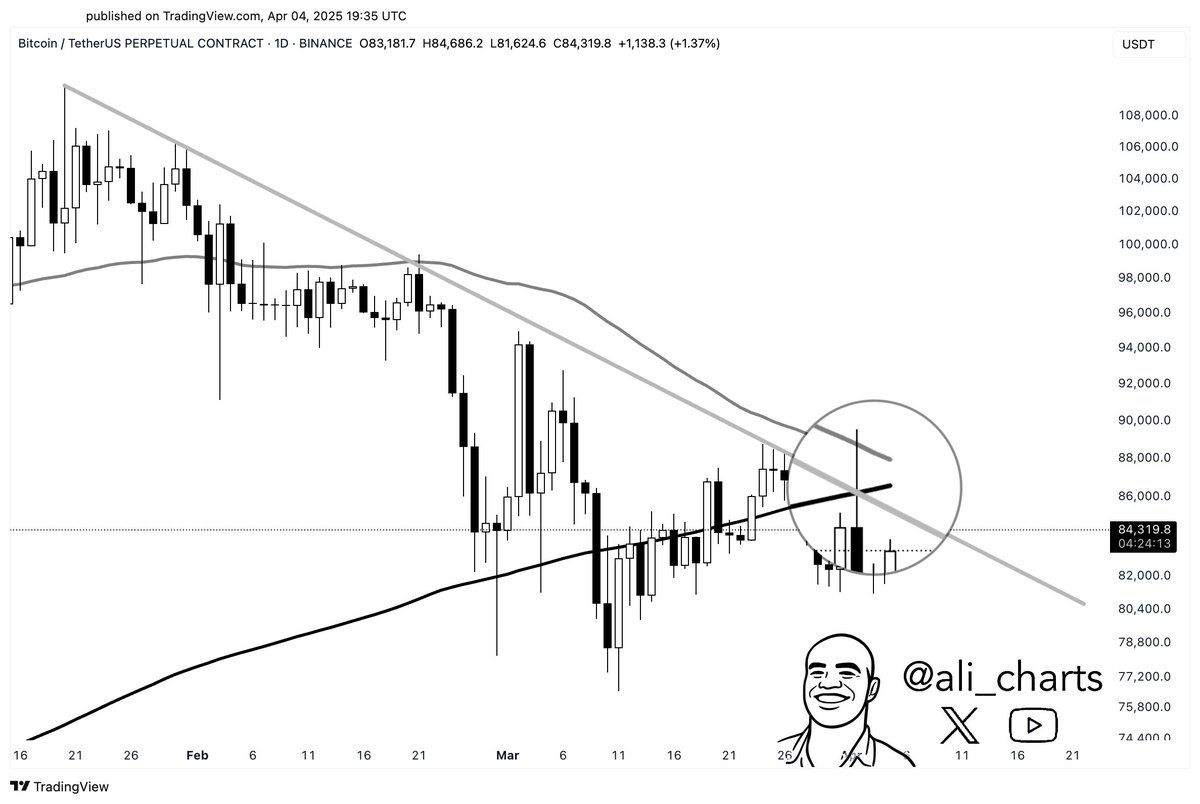
Martinez revealed in a separate post that the Bitcoin price might need to overcome a major resistance level to resume its bull run. This is based on the formation of a “confluence zone,” which represents a price range where multiple technical resistance levels meet.
This confluence range seemingly forming on the daily timeframe of the Bitcoin price chart would consist of the 50-day and 200-day moving averages (MAs) and a descending trendline. The 50-day moving average acts as a gauge of short- to mid-term trend direction and as a dynamic support and resistance level.
Similarly, the 200-day MA is used as a long-term trend indicator, with a break above it considered a major bullish reversal signal. Meanwhile, the Bitcoin price has been forming lower highs (connected by a descending trendline) since reaching the all-time high of $108,786.
As mentioned earlier, the Bitcoin price has been trading in a consolidation range over the past few weeks, with the bulls unable to make a sustained upward run. However, the recent show of strength in the face of growing macroeconomic uncertainty somewhat strengthens a bullish case for the flagship cryptocurrency.
In any case, investors might want to pay extra attention to $87,000, as the convergence of three technical resistance indicators increases the likelihood of a price rejection at the level. Moreover, the Bitcoin price had already tried breaching this mark in the past week before correcting back to around $82,000.
Despite the recent crypto crash that sent most digital assets tumbling, Ethereum (ETH), Solana (SOL) and Cardano (ADA) have managed to hold their ground. According to latest reports, these three cryptocurrencies are now leading the charts as the most trending coins in the market after the crash.
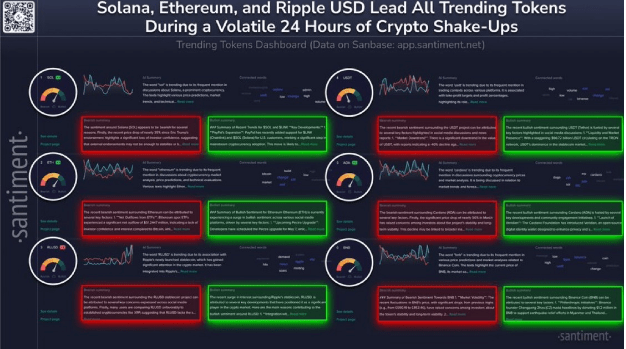
Santiment Unveils Top Trending Cryptos
The crypto market took a significant hit after fears of new tariffs implemented by United States President Donald Trump rattled investors and sent digital assets plunging across the board. However, while US stock markets closed, signs of recovery began to emerge across specific cryptocurrencies, with Ethereum, Solana, and Cardano leading the post-crash chatter.
According to an X (formerly Twitter) post by Santiment, a market intelligence platform, Solana is now back in the headlines as market analysts closely watch its price action following its crash.
The popular meme coin is seeing an increased level of speculative predictions, market trends, and technical chart breakdowns. As a result, SOL is recapturing the attention of retail and institutional investors. There’s also been notable activity within the Solana network as anticipation for a price rebound or breakout keeps spreading.
Ethereum is also trending in the crypto market, not just for its prolonged price slump and reaction to the crypto crash, but its ongoing transition to Ethereum 2.0 — a key upgrade focused on scalability and energy efficiency.
Santiment notes that analysts are highlighting Ethereum’s network performance during the market stress, showcasing an increase in discussions about the cryptocurrency’s market analysis. There have also been increased price predictions, technical evaluations, and talks about the cryptocurrency’s scalability and adoption.
Just like Solana and Ethereum, Cardano is seeing renewed attention as traders assess the cryptocurrency’s position in the broader market. There has been an influx of mentions surrounding Cardano’s market trends, with users speculating on its future price action and potential investments. Forecasts for the ADA price also range widely, with social media buzz and speculative posts fueling the cryptocurrency’s presence on trending charts.
While not as widely discussed as ETH, SOL, and ADA, Binance Coin (BNB) has also been showing up in technical forecasts. Santiment reveals that analysts are tracking BNB’s trading ranges and potential price movements, making it a focal point for investors and traders.
Stablecoins Join List Of Trending Assets
In addition to the altcoins above, Santiment has disclosed that stablecoins have also joined the list of top trending assets. While Ethereum, Solana, and Cardano experienced major declines after the crypto crash, stablecoins, as their names imply, remained stable against the dollar.
Ripple’s newly launched stablecoin RLUSD is trending due to its association with the crypto payments company, which gained significant attention following the completion of its legal battle with the US Securities and Exchange Commission. The stablecoin has been integrated into Ripple’s payment system, improving cross-border transactions and attracting institutional interest.
There has also been a significant increase in adoption and trading volume, with crypto exchange Kraken reporting an 87% surge in the latter and a $10 billion growth in the former.
Featured image from Gemini Imagen, chart from TradingView
Traders on the Kalshi prediction market place the odds of a US recession in 2025 at 61%, following the sweeping tariff order signed by President Donald Trump on April 2.
Kalshi uses the standard criteria of a recession, two business quarters of negative gross domestic product (GDP) growth, as reported by the United States Department of Commerce.
Odds of a US recession on the prediction platform have nearly doubled since March 20 and mirror the current 2025 US recession odds on Polymarket, which traders on the platform currently place at 60%.
The macroeconomic outlook for 2025 deteriorated rapidly following US President Donald Trump’s sweeping tariff order and the ensuing sell-off in capital markets, sparking fears of a prolonged bear market.
Odds of US recession in 2025 top 60% on the Kalshi prediction market. Source: kalshi
Trump’s executive order throws markets in disarray
The US President’s executive order established a 10% baseline tariff rate for all countries and different “reciprocal” tariff rates on trading partners with existing tariffs on US import goods.
Trump’s announcement triggered an immediate stock market sell-off, wiping away over $5 trillion in shareholder value in a matter of days.
Pompliano cited the reduction in 10-year US Treasury bonds as evidence that the President’s strategy of forcing a recession to impact rates is working.
Interest rates on 10-year US Treasury bonds declined from approximately 4.66% in January 2025 to just 4.00% on April 5. President Trump is also pressuring Federal Reserve chairman Jerome Powell to lower short-term interest rates.
“This would be a perfect time for Fed chairman Jerome Powell to cut interest rates,” Trump wrote in an April 4 Truth Social post.
Market prices of Cardano (ADA) increased by over 3% on Friday amid a general bullish wave in the crypto market. However, this minor uptick only follows the largely negative performance earlier seen in the week. Notably, popular crypto analyst Ali Martinez postulates the ninth-largest cryptocurrency could still experience steeper market losses if certain technical support fails to hold.
Cardano Critical Support Break Could Lead To 36% Decline
In a recent post on X, Martinez shares a cautionary insight on the current ADA market structure hinting at a potential price fall. Based on the Fibonacci retracement levels, Martinez’s analysis indicates that Cardano still trades near a vital support zone despite recent gains.
The Fibonacci retracement levels are horizontal lines commonly used to identify potential support and resistance zones. They are based on the Fibonacci sequence and are widely used in anticipating a price fall, gain, consolidation, or reversal.
Looking at the chart below, ADA currently trades at $0.66 which is just above the 50% Fibonacci retracement level at $0.63 – a price zone that has acted as a resilient support level in recent weeks. Ali Martinez warns a daily close below $0.63 would signal a bearish shift in market control at this level paving the way for a further decline.
In this case, Cardano could fall to test the next significant support at the 61.8% Fibonacci retracement level around $0.53. If the selling pressure prevails at this zone, ADA prices could potentially slide to $0.42 representing the 78.6% Fibonacci retracement level.
What Next For ADA?
Cardano has struggled to maintain a prolonged bullish form after reaching a local peak of $1.30 in early December 2024. Since then, ADA prices have been in a corrective phase alongside the broader crypto market.
For ADA bulls, defending the $0.63 price level is crucial to sustaining any valid bullish outlook. However, a successful price reclaim of the $0.78-$0.80 price zone would signal an impending price rally and market rebound for the altcoin.
At the time of writing, Cardano trades at $0.66 as earlier stated. Amid recent gains, ADA is down by 5.00% on its weekly chart and 33.58% on its monthly chart reflecting a domineering bearish influence in recent weeks.
Meanwhile, daily trading volume has gained by 19.56% in the past 24 hours indicating a rise in market interest. This development suggests the recent price rally might be sustainable due to a strong conviction among buyers.
Tony “The Bull” Severino has issued a cautionary reminder to the crypto community not to fall into the trap of comparing Bitcoin’s current cycle with its historic 2017 bull run. According to the technical analyst, a critical indicator on the monthly chart paints a very different picture from the one many investors hope for. Severino’s warning comes as Bitcoin continues to consolidate between $81,000 and $84,500, with the buying trend suggesting that it might be topping out.
Stochastic Oscillator Says Bitcoin No Longer In Same Phase As 2017
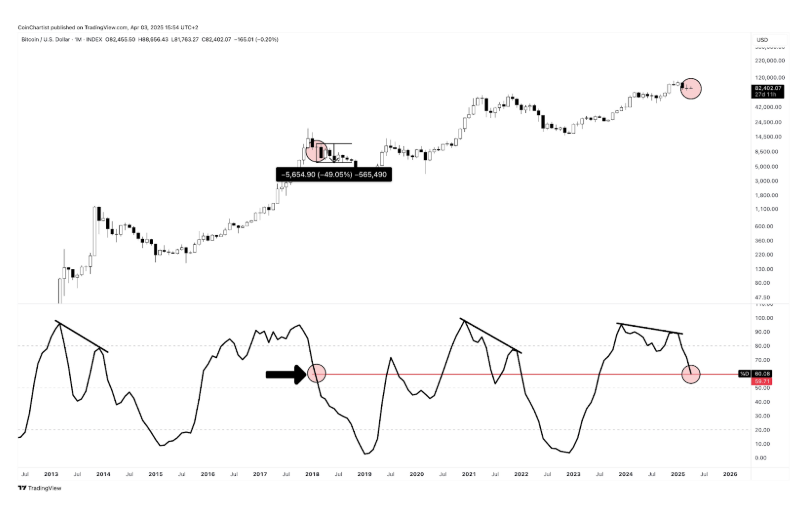
At the core of Severino’s argument is the stochastic oscillator, a momentum indicator commonly used by technical analysts to analyze whether a cryptocurrency is overbought or oversold relative to its recent price range. When applied to Bitcoin on the monthly candlestick timeframe, the oscillator offers a broader view of long-term momentum trends stretching back to 2013. In the chart shared by Severino, this timeframe includes every major bull and bear cycle, with many recurring patterns.
His outlook is in response to market participants who link the 1-month Bitcoin stochastic oscillator’s movement to its past levels in 2017 as a sign of what they expect in the current market. As seen in the chart below, the oscillator has been undergoing the same 2017 downtrend since the beginning of 2025. At the time of writing, the oscillator is sitting around 60, the same level it fell to during the correction in the 2017 bull market.
However, he argues that this level has little in common with the 2017 bull run’s momentum peak and aligns more closely with the beginning of the 2018 bear market. During that point in the cycle, Bitcoin suffered a staggering 49% drop within a single month, from wick high to wick low.
Severino implies that any current similarities to the 2017 bull market are misleading from a bullish technical standpoint, as the implication is that the leading cryptocurrency is at risk of entering a similar corrective or bearish phase now.
Bitcoin Price Can Break Either Way
Recent price action has seen Bitcoin struggling to receive strong inflows and buying momentum. On-chain data shows that many short-term holders have halted their buying activity due to the extended consolidation, which does not bode well for bullish prospects. Furthermore, the realized price model says the ongoing correction may still have weeks to run.
Nonetheless, Bitcoin has managed to hold and reject a break below $80,000 amid the recent turmoil that shook the markets. The announcement of US President Donald Trump’s proposed tariffs rattled markets, causing volatility not only in crypto but across major US equity markets.
As the Dow Jones, S&P 500, and NASDAQ pulled back in response, Bitcoin also slipped toward the $81,000 level. However, unlike its equity counterparts, it has since rebounded and reclaimed ground above $83,000, which can be interpreted as early signs of decoupling from traditional financial indices.
This is actually wild to see— for the first time, Bitcoin is decoupling right before our eyes pic.twitter.com/b4G3HWqWBo
Staff at the U.S. Securities and Exchange Commission (SEC) are reviewing past crypto-related guidance to determine whether it still reflects the agency’s current priorities, according to a statement from acting chairman Mark Uyeda, posted on social media platform X.
Among several key documents, the SEC staff’s statement on funds registered under the Investment Company Act Investing in the bitcoin futures market is under review, according to the X post. Other documents include digital assets “investment contracts,” and custody frameworks. The reviews could result in more clarification for regulatory frameworks around the digital assets sector.
It is worth noting that the statement is coming from SEC staff and not from Commissioner Hester Peirce, making it less binding. However, it still shows the SEC’s willingness to ease pressure on the digital assets sector since the agency was taken over by President Donald Trump-appointed leadership.
The move is part of interim Chairman Mark Uyeda’s efforts to overhaul the regulator’s crypto position. That includes throwing out most of the prominent enforcement cases the agency had pursued against digital asset businesses.
Prominent market analyst and XRP enthusiast Egrag Crypto has rolled out a robust bullish prediction for the XRP market. Amid recent gains, Egrag Crypto postulates that XRP could surge to around $5 but not without resistance at certain price levels. At press time, the popular altcoin continues to trade around $2.12 reflecting a 3.99% gain in the past day amid a widespread price bounce in the crypto market.
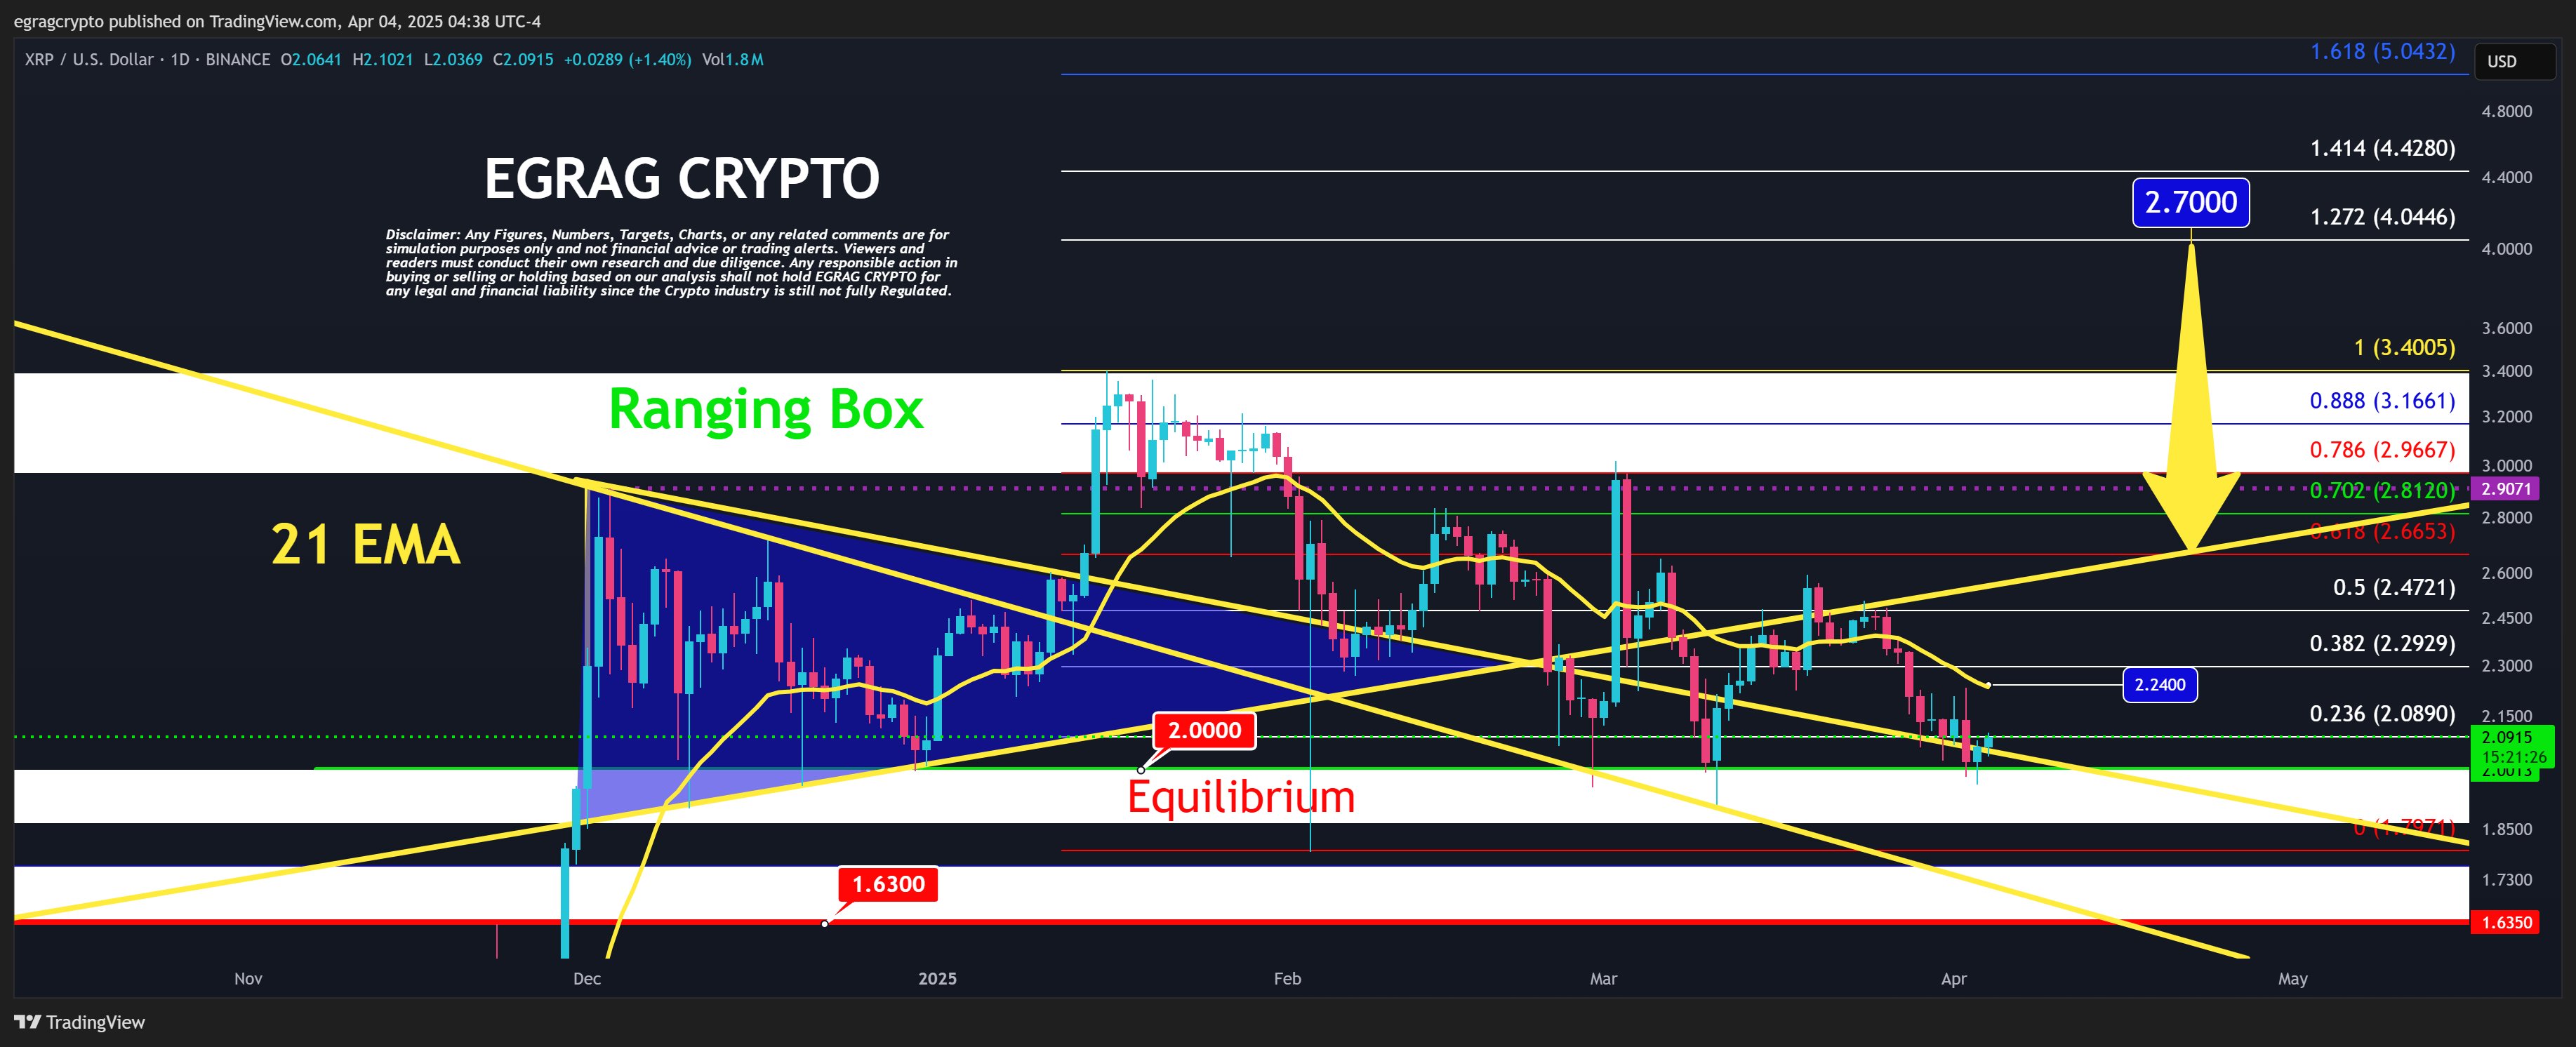
Fibonacci Levels Reveal $2.70 As Key To Major XRP Rally – Details
In an X post on Friday, Egrag shares a positive technical outlook on the XRP market suggesting a potential massive price rally. This projected bullish run comes in multiple phases each barred by the clearance of a new resistance level.
To show any signs of a price uptrend, the market analyst states that XRP bulls must first reclaim the $2.24 price level which aligns with the 21-day exponential moving average – a key trend indicator. Egrag explains that a daily close above this level would show sufficient base demand to kickstart a price recovery.
Thereafter, another successful XRP daily price close above $2.30 would solidify bullish intent signaling a stronger upside continuation. This is because this price level represents the Fib. 0.382, which is a key retracement zone in technical analysis and typically acts as a resistance in a downtrend and support in an uptrend.
Moving on, the next crucial resistance lies at $2.47 which aligns with Fib. 0.5. A convincing breakout above this price resistance zone would further increase the potential of a sustained uptrend. However, the strongest signal for a major rally and a new all-time high price will come only after XRP closes above $2.70 which coincides with both the yellow resistance line and the Fib. 0.618.
Interestingly, Fib. 0.618, known as the golden ratio, is considered another important Fibonacci level that acts as support in an uptrend, and failure to break past which could signal a price reversal and halt the uptrend. However, if XRP successfully surpasses the listed resistance zones, Egrag forecasts a potential surge to $5.00 at Fib. 1.618, representing a 133% gain from the current market price and signaling strong potential for new price discovery.
As earlier stated, XRP currently trades around $2.12 following the minor gains in the past day. Based on the daily trading chart, the altcoin remains far below its 100-day simple moving average suggesting a dominant bearish force. However, the Relative Strength Index (RSI) which stands at 42.69 moving upward, signals the potential for more price growth before a possible reversal. With a market cap of $123.06 billion, XRP continues to rank as the fourth largest cryptocurrency.
Solana’s native token SOL (SOL) dropped by 9% between March 28 and April 4, but several key metrics grew during the same period. Despite SOL’s price downturn, the Solana network continues to outpace competitors, maintaining its second-place position in deposits and trading volume. Traders now wonder how long it will take for SOL’s price to reflect this onchain strength.
Solana outperforms rivals in TVL deposits and DEX volumes
Investor’s declining interest in SOL could be linked to the April 4 staking unlock of 1.79 million SOL, worth over $200 million. The selling pressure is clear, as these tokens were staked in April 2021, when SOL traded near $23. Another factor is the decline in interest for memecoins, which had been a major driver of new user adoption on Solana. With fewer speculative inflows, growth in activity may not translate to immediate price gains.
Several meme-themed cryptocurrencies, including WIF, PENGU, POPCAT, AI16Z, BOME, and ACT, saw declines of 20% or more over the past seven days. Yet, despite worsening market conditions, the Solana network outperformed some competitors. Its Total Value Locked (TVL) rose to the highest level since June 2022, while decentralized exchange (DEX) volumes showed notable resilience.
Solana Total Vale Locked (TVL), SOL. Source: DefiLlama
Deposits in Solana network’s DApps rose to 53.8 million SOL on April 2, marking a 14% increase from the previous month. In US dollar terms, the $6.5 billion total stands $780 million ahead of its closest competitor, BNB Chain. Solana’s top DApps by TVL include Jito (liquid staking), Jupiter (leading DEX), and Kamino (lending and liquidity platform).
Solana gains support for scalability, and Web3 focus despite MEV concerns
While not yet a direct threat to Ethereum’s $50 billion TVL, Solana’s onchain data shows greater resilience compared to BNB Chain, Tron, and Ethereum layer-2 networks like Base and Arbitrum. In decentralized exchange (DEX) volumes, Solana holds a 24% market share, while BNB Chain accounts for 12% and Base captures 10%, according to data from DefiLlama.
While Ethereum has regained the lead in DEX volumes, Solana has shown strong resilience following the memecoin bubble burst. For context, Raydium’s weekly volumes dropped 95% from the $42.9 billion all-time high reached in mid-January. Still, Solana has demonstrated that traders appreciate its focus on base layer scalability and integrated Web3 user experience despite ongoing criticism related to maximum extractable value (MEV).
In short, MEV occurs when validators reorder transactions for profit. This practice is not unique to Solana, but some market participants—such as user Cbb0fe, a self-proclaimed decentralized finance (DeFi) liquidity provider—have raised concerns about insider gatekeeping. While not stated directly, the criticism likely refers to incentives provided by Solana Labs to offset the high investment and maintenance costs required by certain validators.
Supporters of changing Solana’s token emissions argue that rewards earned through MEV already provide sufficient incentives for validators to secure the network, eliminating the need for further inflationary pressure on SOL. Meanwhile, Loring Harkness, a core contributor to Shutter Network, advocates for encrypting transactions before they enter the mempool as a way to prevent validators from manipulating their order.
Solana’s growth in TVL and resilience in DEX market share may not be enough for SOL to retest the $200 level seen in mid-February. However, it has firmly secured its second-place position behind Ethereum as a leading platform for decentralized applications, supported by consistent activity, infrastructure development, and growing interest from both developers and users.
This article is for general information purposes and is not intended to be and should not be taken as legal or investment advice. The views, thoughts, and opinions expressed here are the author’s alone and do not necessarily reflect or represent the views and opinions of Cointelegraph.
XRP (XRP) price has plunged more than 35% since reaching a multi-year high of $3.40 in January — and the downtrend may deepen in April as new bearish signals emerge.
Let’s examine these catalysts in detail.
XRP nears a classic technical breakdown
XRP’s recent price action is flashing a classic bearish reversal signal dubbed “inverse cup and handle formation.”
The inverse cup and handle is a bearish chart pattern that signals fading buyer momentum after an uptrend. It resembles an upside-down teacup, with the “cup” marking a rounded decline and the “handle” forming after a brief consolidation.
A break below the handle’s support typically confirms the pattern, often leading to a drop equal to the cup’s height.
In XRP’s case, the rounded “cup” topped around March 19 and completed its curved decline by the end of the month. The ongoing sideways price movement between $2.05 and $2.20 forms the “handle.”
A breakdown below this horizontal consolidation range could validate the bearish structure, opening the door for a potential move toward the $1.58 support area — as suggested by the measured move projection shown on the chart above.
In other words, XRP can decline by over 25% in April if the inverse cup and handle setup plays out as intended.
Adding to the sell-off risk is data from the volume profile visible range (VPVR) indicator, which shows the point of control (POC) around $2.10–$2.20 — a key support zone. A breakdown below this high-volume area could trigger a sharper drop, as lower volume levels below have offered little historical support in recent history.
Conversely, a strong close above the 50-period 4-hour EMA (red line) near $2.14 could invalidate the inverse cup-and-handle pattern. Such a breakout may shift momentum in favor of the bulls, potentially paving the way for a rally toward the 200-period 4-hour EMA (blue line) around $2.28.
During XRP’s sharp price boom in Q4 2024, whale activity flipped deeply negative, indicating large entities were distributing into strength and selling the local tops. The trend has continued into 2025, with the total whale flow remaining firmly below zero.
This divergence between rising prices and declining whale support suggests weakening institutional conviction and raises concerns over XRP’s near-term price stability unless accumulation resumes.
This article does not contain investment advice or recommendations. Every investment and trading move involves risk, and readers should conduct their own research when making a decision.


 Bitcoin Price Can Break Either Way