Bitcoin Market Sentiment Worsens as Bull Score Index Drops to 10

Bitcoin’s price appears to have resumed its downward trajectory after briefly recovering to the $87,000 level earlier this week. At the time of writing, Bitcoin has experienced a 5.7% decline in the past 24 hours, bringing its price significantly below recent highs.

Currently, BTC is down approximately 24.7% from its all-time high recorded above $109,000 in January, highlighting ongoing bearish pressure in the market.

As Bitcoin continues to navigate turbulent market conditions, analysts are paying close attention to various indicators to predict the asset’s next move.

Bull Score Index and Spent Output Age Bands Indicator

CryptoQuant analyst Julio Moreno recently highlighted the significance of the CryptoQuant Bull Score Index, a tool designed to measure market sentiment for Bitcoin.

According to Moreno, the Bull Score Index has been flashing bearish signals—below the critical threshold of 40—since Bitcoin traded around $96,000. At present, the Index has dropped even further, reaching a remarkably low level of 10, indicating severely bearish market conditions.

Bitcoin Bull Score Index.

The Bull Score Index is a metric developed to quantify the bullish or bearish sentiment of the Bitcoin market. Scores closer to 100 indicate highly bullish sentiment, suggesting strong buying momentum, while scores approaching 0 indicate overwhelmingly bearish conditions, with significant selling pressure and negative market sentiment.

With the index now at 10, investor confidence appears notably weakened, pointing towards caution in the short term. Adding to these bearish signals, another CryptoQuant analyst, Maartunn, reported increased activity among older BTC holders, known as “Spent Output Age Bands.”

This indicator measures the age of Bitcoin that is actively being moved or transacted. When a large volume of older coins (coins held for several years) is moved, it typically suggests that long-term holders might be preparing to sell.

Maartunn noted that over 1,057 BTC aged between 7 to 10 years recently moved, pushing this indicator above the critical 50 threshold, signifying potential increased selling pressure from long-term investors.

Contrasting Views from Technical Indicators

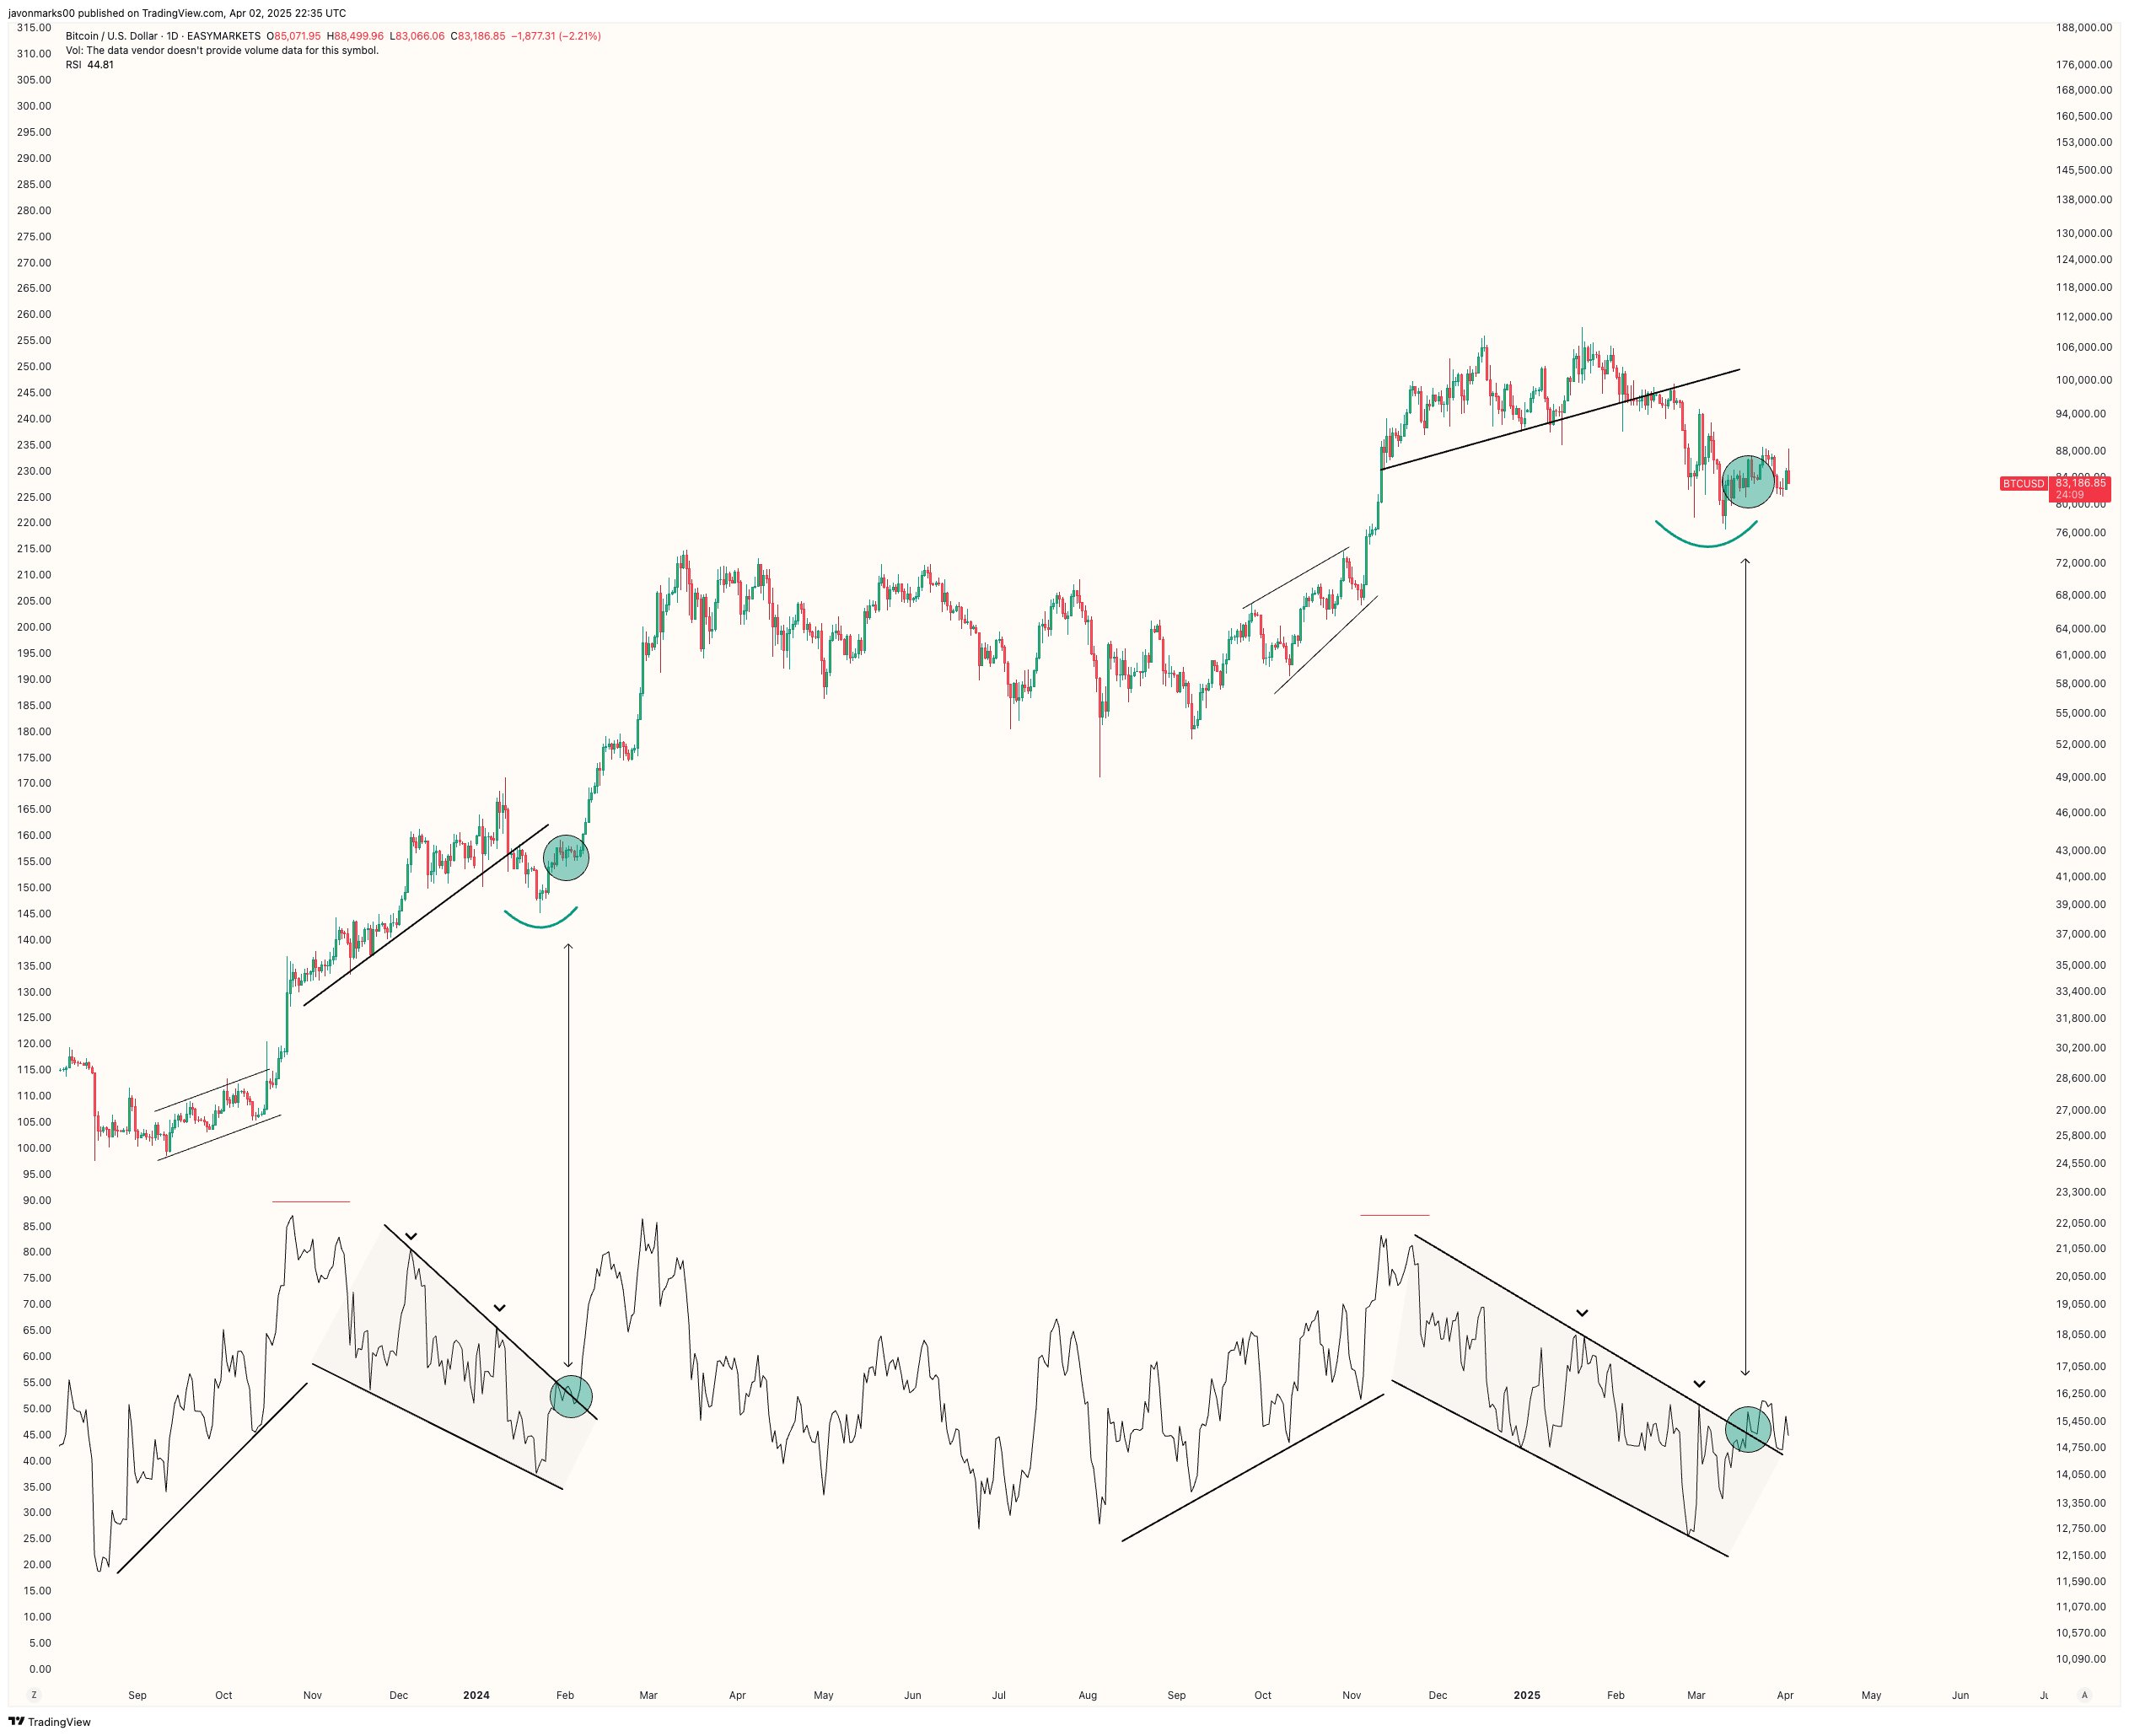
Despite these bearish warnings, some analysts remain optimistic about Bitcoin’s potential near-term performance. Crypto analyst Javon Marks has pointed to the Relative Strength Index (RSI), a momentum indicator that measures the speed and change of recent price movements, to justify his bullish stance.

Bitcoin price and RSI.

A breakout in the RSI typically signals growing bullish momentum and could precede significant price increases. According to Marks, Bitcoin’s daily RSI has recently held its breakout level, similar to previous bullish occurrences that have historically preceded significant upward moves.

However, another analyst known as Titan of Crypto has issued a cautionary note. Titan stressed that Bitcoin needs to maintain its position within a key support channel and keep the weekly RSI above important support levels to avoid further correction.

If Bitcoin fails to hold these levels, Titan predicts that a deeper market downturn could ensue, causing additional challenges for traders and investors.

Bitcoin (BTC) price chart on TradingView

Featured image created with DALL-E, Chart from TradingView

Arthur Hayes loves tariffs as printed money pain is good for Bitcoin

Arthur Hayes loves tariffs as printed money pain is good for Bitcoin

BitMEX co-founder Arthur Hayes says US President Donald Trump’s tariffs may rattle the global economy in some ways, but that same disruption could be exactly what Bitcoin needs to rally.

“Global imbalances will be corrected, and the pain papered over with printed money, which is good for BTC,” Hayes said in an April 3 X post.

Several factors contribute to Bitcoin’s potential pump

“Some of y’all are running scurred, but I LOVE TARIFFS,” Hayes said. 

His comments come just a day after it was announced that the Trump administration will hit all countries with a 10% tariff starting April 5, with some countries facing even larger rates, such as China facing a 34% tariff, the European Union 20%, and Japan 24%. 

Hayes explained that tariffs positively impact Bitcoin’s (BTC) price for several reasons. 

Cryptocurrencies, Markets

Bitcoin is trading at $83,150 at the time of publication. Source: CoinMarketCap

One of them, he said, is the “weakening” of the US Dollar Index (DXY), as overseas investors continue to sell off US stocks and “bring money home.” 

April 3 marked “the largest single-day point loss for the Nasdaq 100 in history,” according to the trading resource account The Kobeissi Letter.

“The index lost a total of -1060 points and came just 1.5% away from triggering the first circuit breaker since March 2020,” The Kobeissi Letter said.

“This is good for BTC and gold over the medium term.”

Hayes also said that the stringent tariff placed on China may weaken the yuan (CNY). “With a 65% effective tariff levied, China could respond by allowing CNY to weaken past 8.00,” Hayes said. 

A weakening yuan may force the hand of Chinese investors to look at riskier assets such as Bitcoin to preserve their wealth.

Meanwhile, Hayes said that “we need Fed easing,” noting that the two-year Treasury yield “dumped” following the tariff announcement. 

Related: Bitcoin sales at $109K all-time high ‘significantly below’ cycle tops — Glassnode

He explained this as a signal that markets expect the Federal Reserve to cut rates and potentially restart quantitative easing (QE) to offset the negative economic impact. 

Fed rate cuts increase liquidity, also making riskier assets like crypto more attractive to investors.

Cryptocurrencies, Markets

Source: Arthur Hayes

Meanwhile, Jeff Park, head of alpha strategies at Bitwise Invest, has long argued that Trump’s tariffs will ultimately benefit Bitcoin.

He said on Feb. 3 that in a “world of weaker dollar and weaker US rates…risk assets in the US will fly through the roof beyond your wildest imagination.”

“Bookmark this and revisit as the financial war unravels, sending Bitcoin violently higher,” Parks said on Feb. 3.

Magazine: XRP win leaves Ripple a ‘bad actor’ with no crypto legal precedent set

This article does not contain investment advice or recommendations. Every investment and trading move involves risk, and readers should conduct their own research when making a decision.

Fortnite doubles down on crypto joke with another secret ‘Dill Bits’ location

Fortnite doubles down on crypto joke with another secret ‘Dill Bits’ location

Online battle royale shooter Fortnite has just added a new secret “Dill Bits” server mine location to its latest map update — prompting a small spike in an otherwise obscure memecoin.

Videos on social media show a new “Dill Bit” server farm location in the game — made to look like a cryptocurrency mining operation. There are other locations on the map where it has appeared.

Players in the game can collect Dill Bits by destroying the equipment. It’s a unique resource that is typically hard to obtain.

Dill Bits memecoin spikes

Solana-based memecoin Dill Bits, inspired by the Fortnite in-game currency, spiked 200% to $0.0005 on April 4 as the crypto community also took notice of the latest addition.

Fortnite introduced Dill Bits as an in-game currency in February as a jest toward crypto. However, these can only be used to buy in-game items. 

At the time, the announcement of the in-game currency prompted an anonymous crypto user to create their own version of the token on Solana.

The recent spike is nowhere near previous surges, however. When the memecoin first launched in February, it surged 4,500% in price to reach a market cap of $4.8 million.

Another huge spike for the memecoin occurred on March 9, after Fortnite released a video promoting its latest “Rugpull” storyline, which saw the token pump over 4,000% in just a few minutes again.

Fortnite doubles down on crypto joke with another secret ‘Dill Bits’ location

DB price spike. Source: DEX Screener

The underground Bitcoin mine shows banks of green servers with the Dill Bit logo, which looks very similar to Bitcoin’s.

Another player posted a YouTube video on April 1 showing all of the secret locations on the map, explaining that if the servers are destroyed in the game, they may drop Dill Bits. 

“Wow. Bitcoin really becoming mainstream for a game like Fortnite to add this little easter egg,” commented one player on Reddit after becoming aware of the secret location on April 3.

The gimmick is not likely new for Fortnite players, as other hidden server mines have been discovered in other parts of the map since the in-game currency was introduced. 

According to the official Fortnite Wiki, the new Dill Bits Mining Server is an “Unnamed Location in Fortnite: Battle Royale, that was added in Chapter 6: Season 2 to the island Oninoshima near Outlaw Oasis.” It is a “small cave containing servers mining the cryptocurrency called Dill Bits,” it states

Fortnite doubles down on crypto joke with another secret ‘Dill Bits’ location

New secret location in Fortnite. Source: Reddit

The online battle royale platform developed by Epic Games released its most recent update on April 1, which included a new Mortal Kombat collaboration, quests, skins and map updates. 

Related: Epic wants Fortnite, Minecraft, Roblox to become interoperable metaverse

Fortnite’s in-game cryptocurrency

Dill Bits, Fortnite’s in-game currency, can be spent “at one of three Black Markets around the map, offering a selection of Mythic and Legendary items,” and “Boons” that grant extra abilities, the Fortnite team explained at the time. 

An in-game description calls Dill Bits “a bulky and confusing crypto coin you never knew you needed. These coins are ideal for shady black-market trades.”

Magazine: Web3 gaming activity surges 386% — Wen bull run? Web3 Gamer

EU could fine Elon Musk’s X $1B over illicit content, disinformation

EU could fine Elon Musk’s X $1B over illicit content, disinformation

European Union regulators are reportedly mulling a $1 billion fine against Elon Musk’s X, taking into account revenue from his other ventures, including Tesla and SpaceX, according to The New York Times.

EU regulators allege that X has violated the Digital Services Act and will use a section of the act to calculate a fine based on revenue that includes other companies Musk controls, according to an April 3 report by the newspaper, which cited four people with knowledge of the plan.

Under the Digital Services Act, which came into law in October 2022 to police social media companies and “prevent illegal and harmful activities online,” companies can be fined up to 6% of global revenue for violations.

A spokesman for the European Commission, the bloc’s executive branch, declined to comment on this case to The New York Times but did say it would “continue to enforce our laws fairly and without discrimination toward all companies operating in the EU.”

In a statement, X’s Global Government Affairs team said that if the reports about the EU’s plans are accurate, it “represents an unprecedented act of political censorship and an attack on free speech.”

“X has gone above and beyond to comply with the EU’s Digital Services Act, and we will use every option at our disposal to defend our business, keep our users safe, and protect freedom of speech in Europe,” X’s global government affairs team said.

European Union, Elon Musk

Source: Global Government Affairs

Along with the fine, the EU regulators could reportedly demand product changes at X, with the full scope of any penalties to be announced in the coming months. 

Still, a settlement could be reached if the social media platform agrees to changes that satisfy regulators, according to the Times. 

One of the officials who spoke to the Times also said that X is facing a second investigation alleging the platform’s approach to policing user-generated content has made it a hub of illegal hate speech and disinformation, which could result in more penalties.

X EU investigation ongoing since 2023

The EU investigation began in 2023. A preliminary ruling in July 2024 found X had violated the Digital Services Act by refusing to provide data to outside researchers, provide adequate transparency about advertisers, or verify the authenticity of users who have a verified account.

Related: Musk says he found ‘magic money computers’ printing money ‘out of thin air’

X responded to the ruling with hundreds of points of dispute, and Musk said at the time he was offered a deal, alleging that EU regulators told him if he secretly suppressed certain content, X would escape fines. 

Thierry Breton, the former EU commissioner for internal market, said in a July 12 X post in 2024 that there was no secret deal and that X’s team had asked for the “Commission to explain the process for settlement and to clarify our concerns,” and its response was in line with “established regulatory procedures.” 

Musk replied he was looking “forward to a very public battle in court so that the people of Europe can know the truth.”

European Union, Elon Musk

Source: Thierry Breton

Magazine: XRP win leaves Ripple a ‘bad actor’ with no crypto legal precedent set

Coinbase Institutional files for XRP futures trading with CFTC

Coinbase Institutional files for XRP futures trading with CFTC

US crypto exchange Coinbase has filed with the US Commodity Futures Trading Commission (CFTC) to launch futures contracts for Ripple’s XRP token.

“We’re excited to announce that Coinbase Derivatives has filed with the CFTC to self-certify XRP futures — bringing a regulated, capital-efficient way to gain exposure to one of the most liquid digital assets,” stated Coinbase Institutional on April 3. 

The firm added that it anticipates the contract going live on April 21.

According to the certification filing, the XRP (XRP) futures contract will be a monthly cash-settled and margined contract trading under the symbol XRL.

The contract tracks XRP’s price and is settled in US dollars. Each contract represents 10,000 XRP, currently worth about $20,000 at $2 per token.

Contracts can be traded for the current month and two months ahead, and trading will be paused as a safety measure if spot XRP prices move more than 10% in an hour. 

“The exchange has spoken with FCMs (Futures Commission Merchants) and market participants who support the decision to launch a XRP contract,” the firm stated. 

Coinbase is not the first to launch XRP futures in the United States. In March, Chicago-based crypto exchange Bitnomial announced the launch of the “first-ever CFTC-regulated XRP futures in the US.” 

XRP futures trading is available on many of the world’s leading centralized crypto exchanges, such as Binance, OKX, Bybit and BitMEX. 

Funding rates remain negative

In late March, Cointelegraph reported that XRP derivatives’ funding rates had flipped negative as investor sentiment turned bearish. 

Related: XRP funding rate flips negative — Will smart traders flip long or short?

Funding rates are periodic payments between traders in perpetual futures markets that help keep the futures price aligned with the spot price. Positive funding rates mean that long traders (buyers) pay short traders, while negative funding rates mean short traders (sellers) pay long traders. 

When funding rates go negative, it means short traders are willing to pay a premium to maintain their positions, indicating strong conviction from bearish derivatives traders. 

XRP funding rates remained negative on major derivatives exchanges as of April 4, according to CoinGlass. 

Coinbase Institutional files for XRP futures trading with CFTC

XRP OI-weighted funding rates. Source: CoinGlass

Magazine: XRP win leaves Ripple a ‘bad actor’ with no crypto legal precedent set

BTC, ETH, XRP Set For a Near-Term Bounce as Attention Turns to Rate Cuts

An oversold market and reactions to U.S. tariffs may be a thing of the past with traders now eying new economic data and rate cuts in the coming months — with expectations of a bitcoin bounce in the near term.

Crypto markets saw high volatility on Wednesday and Thursday in the run-up to the tariff announcement, where President Donald Trump levied a minimum 10% fee on all imports to the country.

Major tokens bitcoin (BTC), ether (ETH), Solana’s SOL, XRP (XRP), and others, zoomed ahead of the speech and slumped as global markets fell, reversing all gains from the start of the week.

Markets have since shown an uptick in prices on Friday morning, with BTC steady above $83,100, ETH retaking $1,800 and XRP, SOL and ADA rising over 2%.

Ahead of Trump’s speech, investors transferred larger volumes of Bitcoin, ETH, and XRP into exchanges, suggesting a growing intent to sell, per a CryptoQuant note shared with CoinDesk on Thursday. Bitcoin transactions surged to as much as 2,500 BTC in a single block just hours after Trump began speaking.

In the U.S., Coinbase also saw a rise in bitcoin deposits, particularly from large holders.

Similarly, ETH inflows into exchanges spiked to an hourly peak of approximately 80,000 ETH. XRP transfers into Binance jumped to 130 million in one hour, up from under 10 million XRP per hour throughout most of the previous day.

These rising exchange inflows reflected investor willingness to exit positions amid growing economic uncertainty, CryptoQuant said, with demand for Bitcoin and ETH declining in the perpetual futures market as traders closed their long positions to take profits.

But with headwinds behind and a new economic data set to be released later Friday could provide the impetus for a short-term relief in markets.

Attention is on the non-farm payroll report scheduled for a Friday release. The monthly U.S. economic indicator released by the Bureau of Labor Statistics shows the change in employment, reflecting job creation, unemployment trends, and wage growth, offering insight into economic health.

“Investors are bracing for signs of softness in the U.S. labour market,” Singapore-based QCP Capital said in a Telegram broadcast earlier Friday. “ A weaker-than-expected print would bolster the case for further Fed rate cuts this year, as policymakers attempt to cushion a decelerating economy.”

Data shows markets are pricing in four rate cuts in 2025 — 0.25 bps each in June, July, September and December. Rate cuts occur when a central bank, like the Federal Reserve, lowers interest rates to stimulate economic growth by making borrowing cheaper.

Bitcoin, and the broader market, tend to react positively to rate cuts, as lower rates reduce the appeal of traditional investments like bonds, driving investors toward alternatives like BTC. Additionally, a weaker dollar can enhance BTC’s value as a hedge against inflation or currency devaluation.

QCP Capital said it continues to observe elevated volatility in the short term, with more buyers of downside protection.

“That said, with positioning now light and risk assets largely oversold, the stage may be set for a near-term bounce,” the fund said.

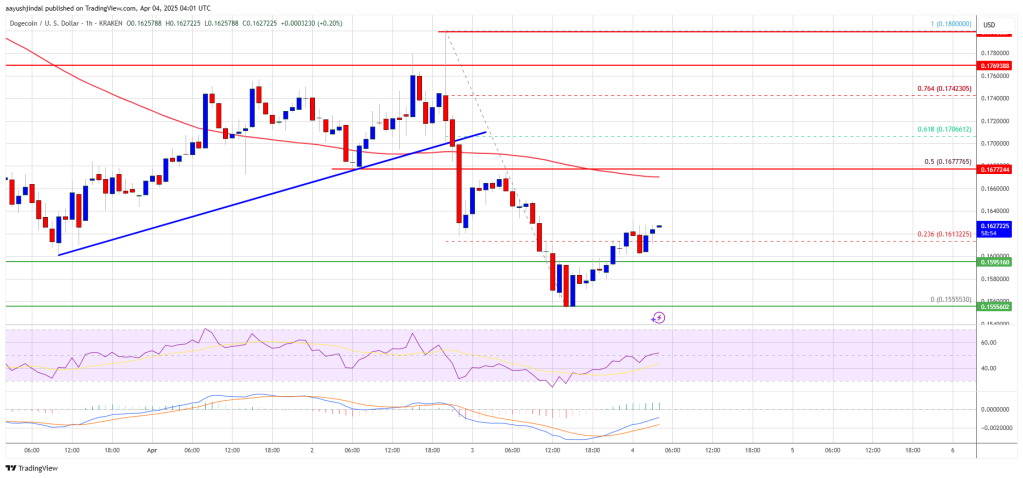
Dogecoin (DOGE) Bleeds Further—Fresh Weekly Lows Test Investor Patience

Dogecoin started a fresh decline from the $0.180 zone against the US Dollar. DOGE is consolidating and might struggle to recover above $0.1680.

  • DOGE price started a fresh decline below the $0.1750 and $0.170 levels.
  • The price is trading below the $0.1680 level and the 100-hourly simple moving average.
  • There was a break below a key bullish trend line forming with support at $0.170 on the hourly chart of the DOGE/USD pair (data source from Kraken).
  • The price could extend losses if it breaks the $0.1550 support zone.

Dogecoin Price Dips Again

Dogecoin price started a fresh decline after it failed to clear $0.180, like Bitcoin and Ethereum. DOGE dipped below the $0.1750 and $0.1720 support levels.

There was a break below a key bullish trend line forming with support at $0.170 on the hourly chart of the DOGE/USD pair. The bears were able to push the price below the $0.1620 support level. It even traded close to the $0.1550 support.

A low was formed at $0.1555 and the price is now consolidating losses. There was a minor move above the 23.6% Fib retracement level of the downward move from the $0.180 swing high to the $0.1555 low.

Dogecoin price is now trading below the $0.170 level and the 100-hourly simple moving average. Immediate resistance on the upside is near the $0.1650 level. The first major resistance for the bulls could be near the $0.1680 level. It is near the 50% Fib retracement level of the downward move from the $0.180 swing high to the $0.1555 low.

Dogecoin Price

The next major resistance is near the $0.1740 level. A close above the $0.1740 resistance might send the price toward the $0.180 resistance. Any more gains might send the price toward the $0.1880 level. The next major stop for the bulls might be $0.1950.

Another Decline In DOGE?

If DOGE’s price fails to climb above the $0.170 level, it could start another decline. Initial support on the downside is near the $0.160 level. The next major support is near the $0.1550 level.

The main support sits at $0.150. If there is a downside break below the $0.150 support, the price could decline further. In the stated case, the price might decline toward the $0.1320 level or even $0.120 in the near term.

Technical Indicators

Hourly MACD – The MACD for DOGE/USD is now losing momentum in the bearish zone.

Hourly RSI (Relative Strength Index) – The RSI for DOGE/USD is now above the 50 level.

Major Support Levels – $0.1600 and $0.1550.

Major Resistance Levels – $0.1680 and $0.1740.

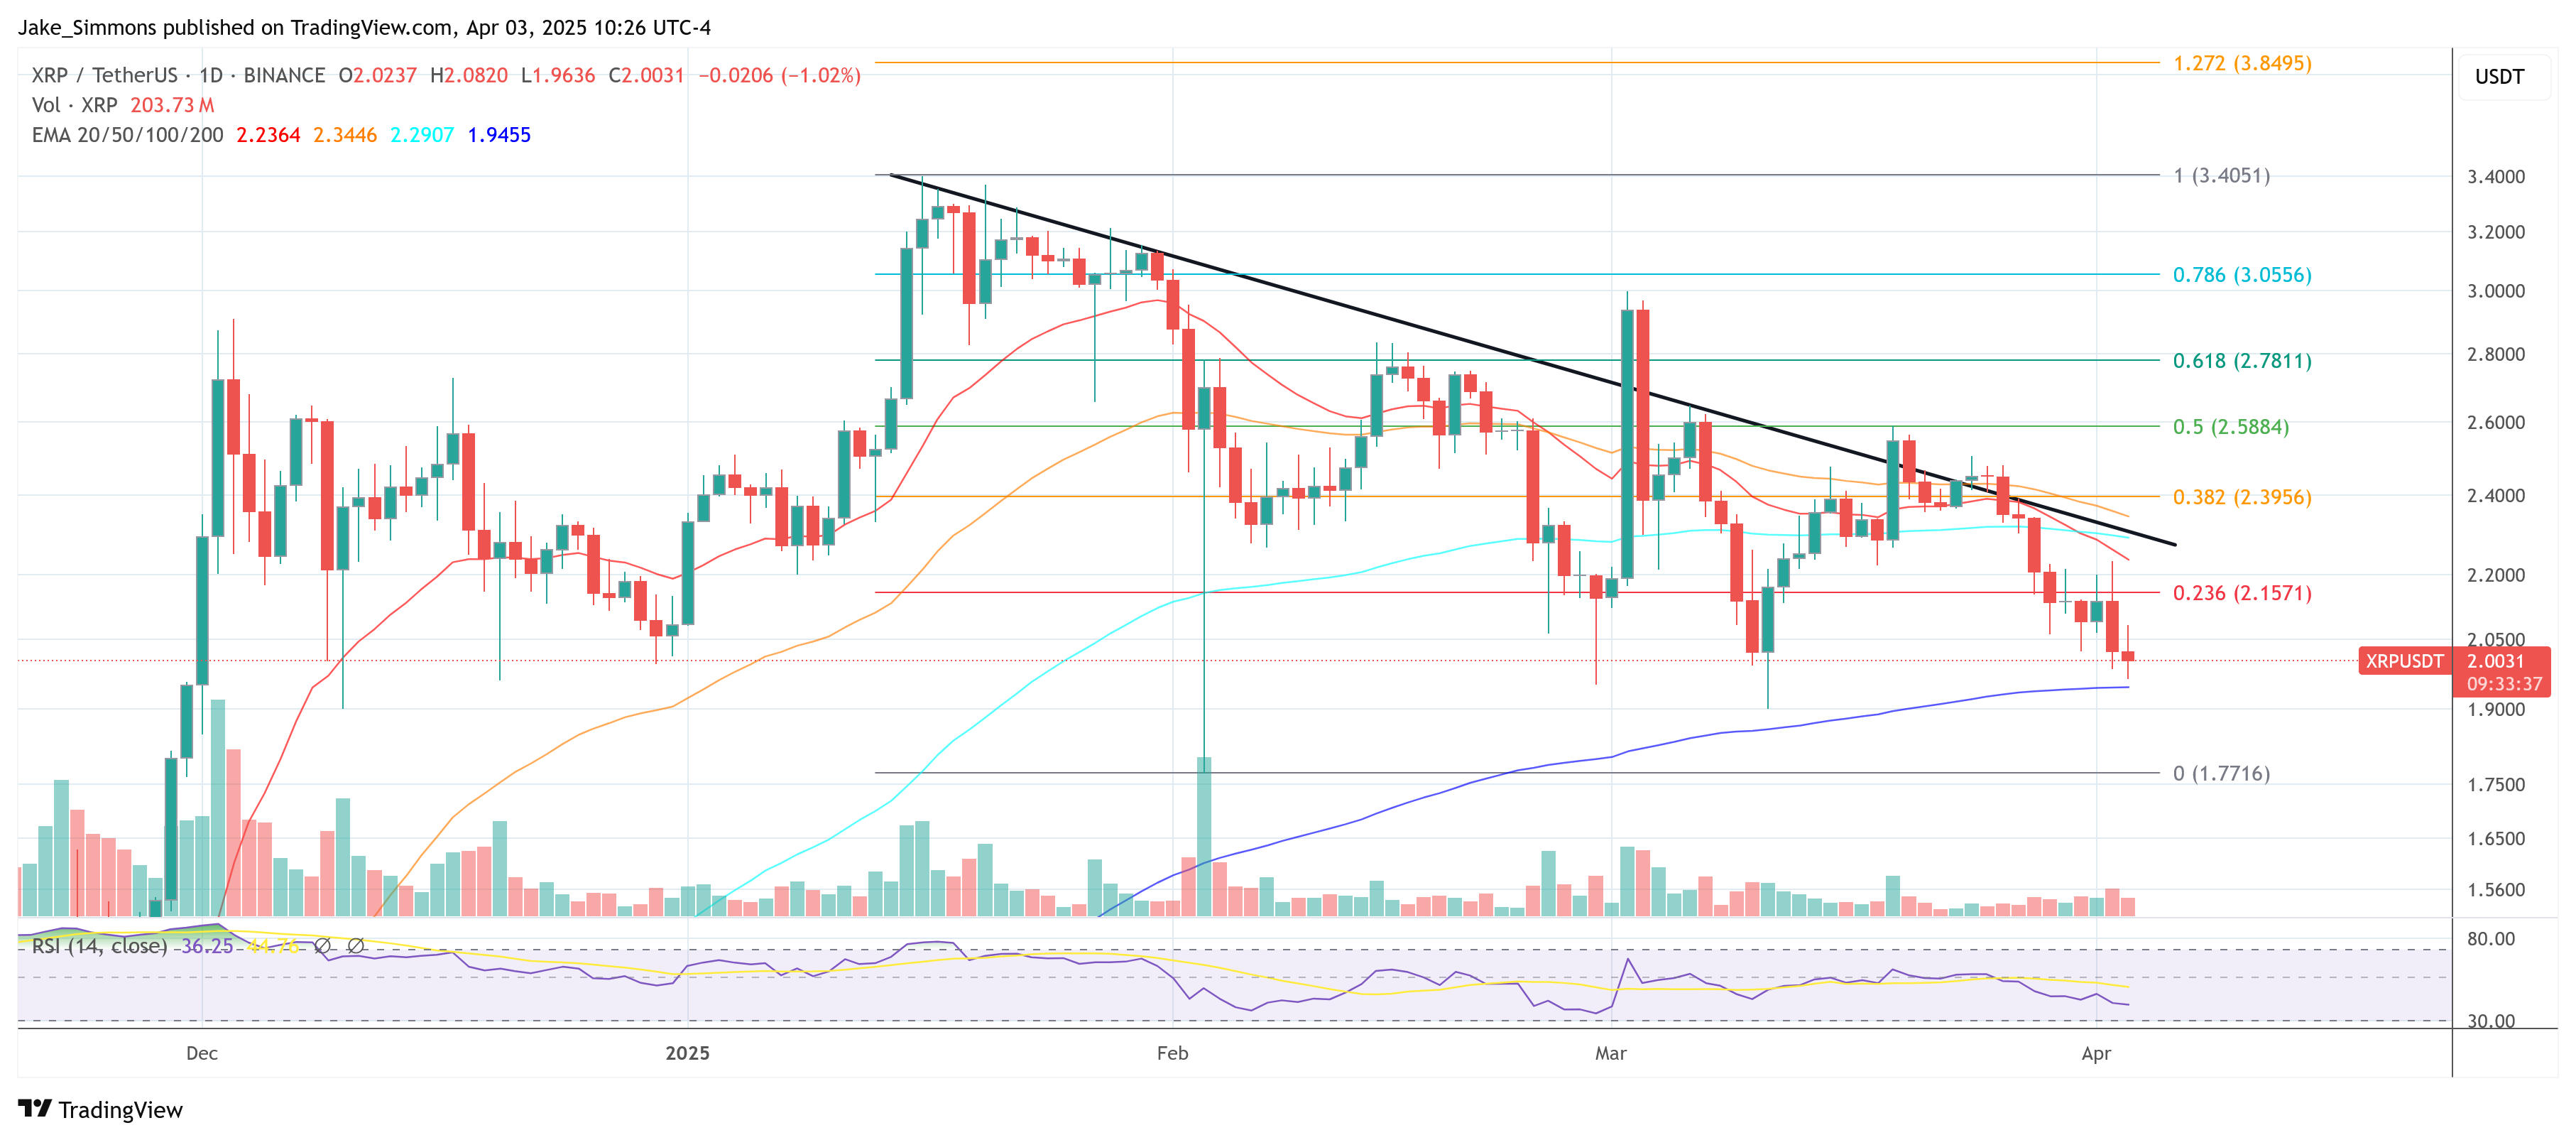
XRP Breakout Alert! Could This Surge Send The Altcoin To $3?

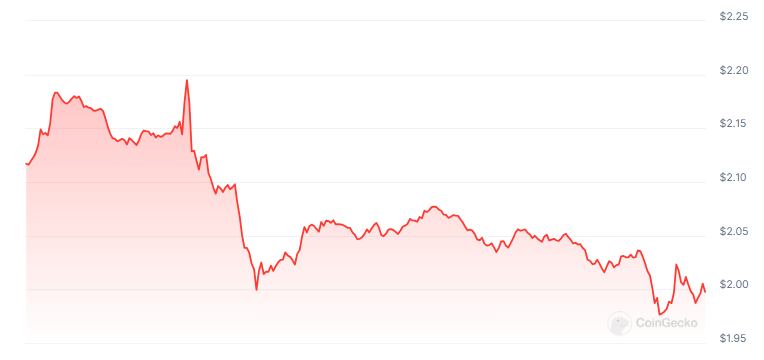
XRP is probing critical support levels as the cryptocurrency market struggles with chronic volatility. The digital asset currently trades at $1.98, a daily trading volume of $10.50 billion and market value of $115 billion. Over the last 24 hours, XRP has declined by 7.7%, which mirrors larger market trends.

Bitcoin’s Roller Coaster Affects Altcoin Market

Bitcoin’s recent price move to $81,700 and subsequent sharp pullback has sent ripple effects throughout other cryptocurrencies. The move has sent investors into fear, with pressure on XRP and other alternative digital currencies. Traders are now observing key price levels to see if support will break or hold.

Macroeconomic Factors Add To Market Tension

Political events are creating a second level of unpredictability in the prices of cryptocurrency. In its report, agreed-on retaliatory tariffs by US President Donald Trump– with the aim to increase government revenues and establish what he calls “fairer international commerce” — have spurred fears of an impending trade war. These are some of the reasons behind today’s crypto market volatility.

Analyst Foresees Possible Test Of Lower Support

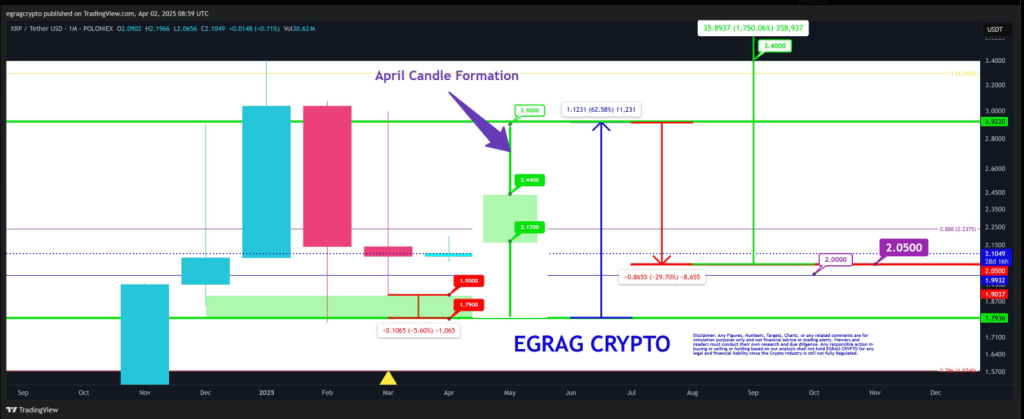
In spite of the present downward pressure, one market observer envisions potential upside in the future. Crypto analyst Egrag Crypto predicts XRP will enter a testing period, possibly falling to the $1.90 to $1.79 levels before trying to move upward toward $2.80 to $3.00. According to this analysis, if prices hit the anticipated bottom, a rally of as much as 70% might ensue.

Lull Period Pre-Surge

The price history of the cryptocurrency depicts cycles of protracted periods of quietness preceded by explosive bursts. With recent market conditions contributing to a perfect storm of inputs, investors are closely watching price charts for subtle early indications of XRP’s next big move.

RP has tended to catch investors off guard with unanticipated action, and April could be a decisive month for the coin. Traders are bracing for a few different scenarios: more consolidation, a breakout, or a sudden market change.

April May Mark End Of Consolidation

Meanwhile, several market watchers define XRP’s present trend as a period of consolidation that usually precedes considerable price action. According to analysts, this phase could end soon, potentially propelling XRP into more robust positive momentum.

A final test around the $2 level may be used as a springboard for what some expect to be a major breakthrough.

While near-term uncertainty exists, the long-term picture is cautiously optimistic from the perspective of market observers. Technical signals alongside economic fundamentals indicate a phase of heightened price activity in the next few weeks.

Featured image from Gemini Imagen, chart from TradingView

Altcoins are set for one last big rally, but just a few will benefit — Analyst

Altcoins are set for one last big rally, but just a few will benefit — Analyst

Altcoins may have just one last rally this cycle, but only those with real utility and strong network activity will see price gains, according to an analyst. 

“I think there will be one more breadth thrust from altcoins. The question is, is it a sustained rally that we will see for six to twelve months,” Real Vision chief crypto analyst Jamie Coutts told Real Vision co-founder Raoul Pal on an April 3 X livestream.

Network activity will be the ‘north star’ for how to trade crypto

“At this stage, I am not too sure, but I do believe that quality altcoins where activity returns, activity drives prices …we will definitely see a recovery in some of these more high-quality names,” Coutts said.

Cointelegraph reported in January that there were over 36 million altcoins in existence. However, Ethereum still holds the majority share of total value locked (TVL) with 55.56%, followed by Solana (6.89%), Bitcoin (5.77%), BNB Smart Chain (5.68%), and Tron (5.54%), according to CoinGecko data.

Coutts said traders should watch where the network activity “is gravitating” and use that as their “north star” for how to trade in crypto, adding he sees an altcoin market upswing within the next two months. 

“I’m expecting by June to see altcoins really start to pick up again. Predicated on the fact that Bitcoin is back at all-time highs by that point.”

On March 28, Coutts told Cointelegraph that Bitcoin could reach all-time highs before the end of Q2 regardless of whether there is more clarity on US President Donald Trump’s tariffs and potential recession concerns.

Cryptocurrencies, Markets

The total crypto market cap is down around 8% over the past 30 days. Source: CoinMarketCap

Blockchain network activity across the board has recently experienced sharp declines amid a broader crypto market downturn. On Feb. 21, Cointelegraph reported that the number of active addresses on the Solana (SOL) network fell to a weekly average of 9.5 million in February, down nearly 40% from the 15.6 million active addresses in November 2024.

Altcoin indicators are flashing red

Meanwhile, several key indicators the crypto industry uses to determine an incoming altcoin season suggest it’s still nowhere in sight.

Capriole Investments’ Altcoin Speculation Index has dropped to 12%, down 53% since Dec. 25, the same period during which Ether fell 49% from $3,490, according to CoinMarketCap data.

Related: When will altseason arrive? Experts reveal what’s holding back altcoins

CoinMarketCap’s Altcoin Season Index, which measures the top 100 cryptocurrencies against Bitcoin’s performance over the past 90 days, is reading a score of 14 out of 100, leaning toward a more Bitcoin-dominated market, referring to it as “Bitcoin Season.”

Cryptocurrencies, Markets

The Altcoin Season Index Chart is sitting at 14 at the time of publication. Source: CoinMarketCap

However, while Bitcoin dominance — a level often watched for retracements that signal an altcoin season — sits at 62.84%, some analysts argue it’s no longer as relevant as a signal for altcoin season.

CryptoQuant CEO Ki Young Yu recently said that Bitcoin Dominance “no longer defines altseason — trading volume does.”

Magazine: New ‘MemeStrategy’ Bitcoin firm by 9GAG, jailed CEO’s $3.5M bonus: Asia Express

This article does not contain investment advice or recommendations. Every investment and trading move involves risk, and readers should conduct their own research when making a decision.

XRP Battle Heats Up—Can Bulls Turn the Tide?

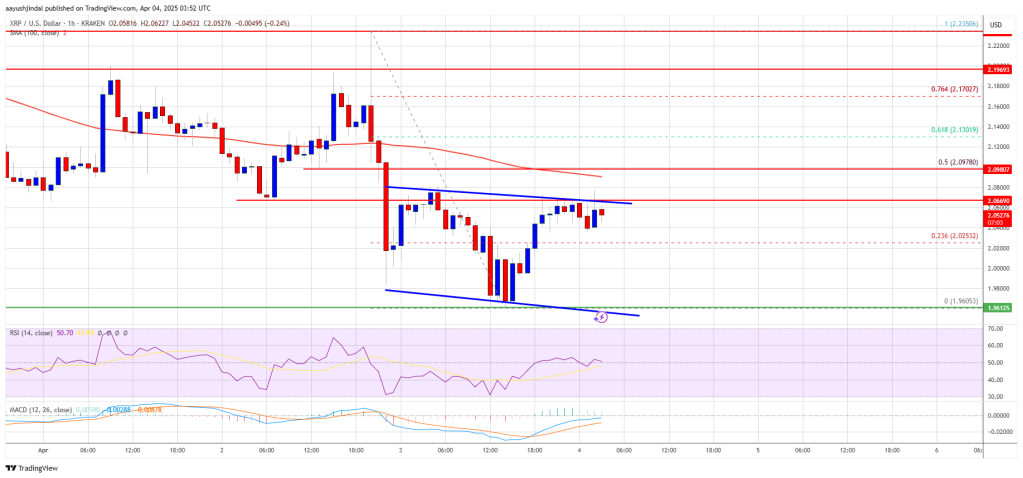
XRP price started a fresh decline below the $2.050 zone. The price is now consolidating and might face hurdles near the $2.10 level.

  • XRP price started a fresh decline below the $2.120 and $2.050 levels.
  • The price is now trading below $2.10 and the 100-hourly Simple Moving Average.
  • There is a short-term declining channel forming with resistance at $2.0680 on the hourly chart of the XRP/USD pair (data source from Kraken).
  • The pair might extend losses if it fails to clear the $2.10 resistance zone.

XRP Price Attempts Recovery

XRP price extended losses below the $2.050 support level, like Bitcoin and Ethereum. The price declined below the $2.00 and $1.980 support levels. A low was formed at $1.960 and the price is attempting a recovery wave.

There was a move above the $2.00 and $2.020 levels. The price surpassed the 23.6% Fib retracement level of the downward move from the $2.235 swing high to the $1.960 low. However, the bears are active below the $2.10 resistance zone.

The price is now trading below $2.10 and the 100-hourly Simple Moving Average. On the upside, the price might face resistance near the $2.070 level. There is also a short-term declining channel forming with resistance at $2.0680 on the hourly chart of the XRP/USD pair.

The first major resistance is near the $2.10 level. It is near the 50% Fib retracement level of the downward move from the $2.235 swing high to the $1.960 low. The next resistance is $2.120.

XRP Price

A clear move above the $2.120 resistance might send the price toward the $2.180 resistance. Any more gains might send the price toward the $2.2350 resistance or even $2.40 in the near term. The next major hurdle for the bulls might be $2.50.

Another Decline?

If XRP fails to clear the $2.10 resistance zone, it could start another decline. Initial support on the downside is near the $2.00 level. The next major support is near the $1.960 level.

If there is a downside break and a close below the $1.960 level, the price might continue to decline toward the $1.920 support. The next major support sits near the $1.90 zone.

Technical Indicators

Hourly MACD – The MACD for XRP/USD is now losing pace in the bearish zone.

Hourly RSI (Relative Strength Index) – The RSI for XRP/USD is now above the 50 level.

Major Support Levels – $2.00 and $1.960.

Major Resistance Levels – $2.10 and $2.120.

Is Ethereum Repeating Its 2020 Trend Reversal? Analyst Predicts ETH To ‘Explode’ In Q2 2025

Although sentiment toward Ethereum (ETH) remains largely pessimistic, crypto analyst Mister Crypto predicts that the second-largest cryptocurrency by market cap could be on the verge of a parabolic rally, mirroring its historical price action from 2020.

Ethereum About To Witness A Change Of Fortune?

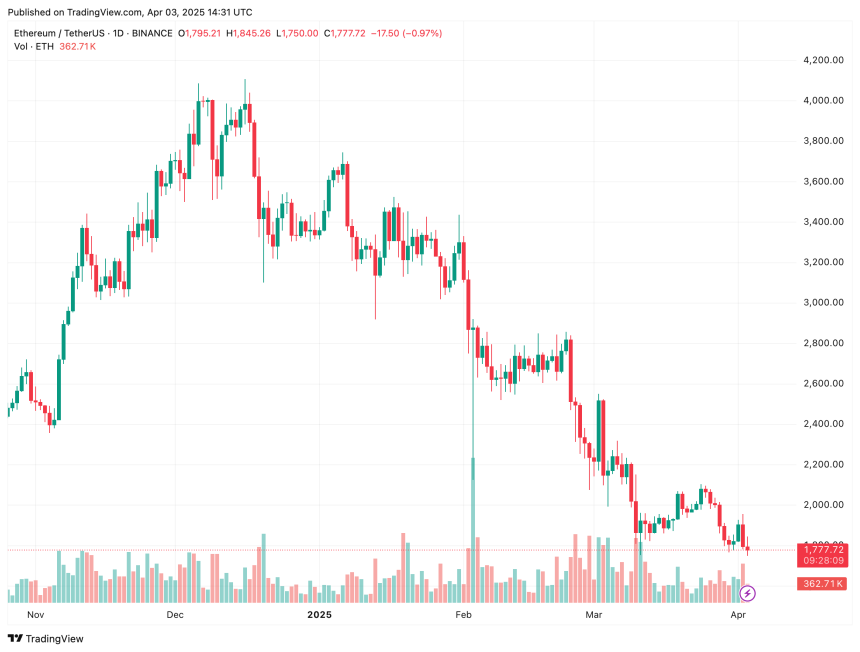
Following US President Donald Trump’s highly anticipated reciprocal tariff announcement, the crypto market took a sharp plunge, wiping out over $140 billion in the past 24 hours. During this period, ETH tumbled by 5% and is at risk of setting fresh cycle lows in the $1,700 range.

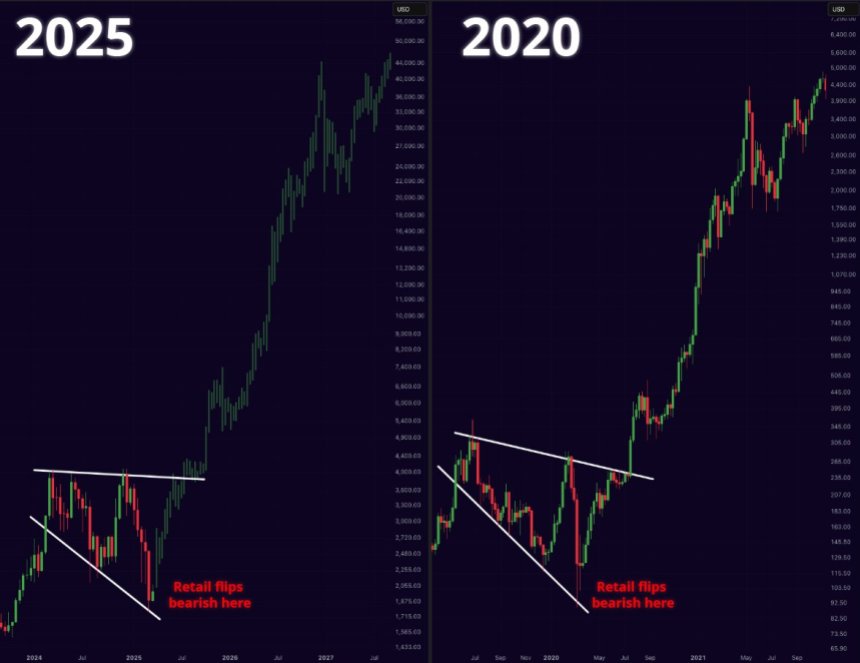
Despite the negative sentiment, crypto analyst Mister Crypto suggests that ETH may soon experience a sharp momentum shift. In an X post shared earlier today, the analyst noted that while retail investors may have abandoned ETH, large investors – commonly referred to as whales – have not.

Mister Crypto shared the following chart, highlighting striking similarities between ETH’s current price action and its 2020 trajectory. He added that if history repeats itself, ETH could see strong bullish momentum in Q2 2025.

mistercrypto

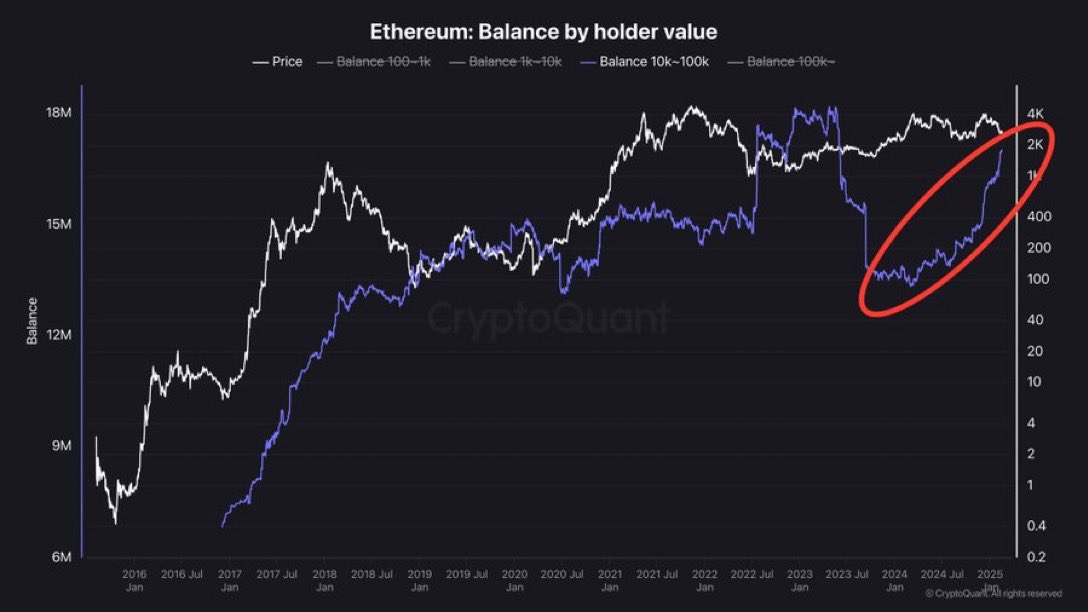
Fellow crypto analyst CryptoGoos echoed Mister Crypto’s perspective, arguing that ETH is “extremely undervalued” at its current price levels. The analyst also shared a chart illustrating how ETH whales are accumulating the asset at a record pace.

cyptogoos

The data reveals that wallets holding between 10,000 and 100,000 ETH have been accumulating at an accelerated rate since early 2025. This trend persists despite ETH’s decline from approximately $3,350 on January 1 to around $1,700 at the time of writing.

Another cryptocurrency analyst, Crypto Caesar, noted that ETH is likely approaching a bottom, as it is currently trading near the same price level it held four years ago. However, he cautioned that if ETH breaks below its current support, it could decline further to the $1,200 range.

ETH May Have More Pain Ahead

While whale accumulation suggests long-term optimism for ETH, some analysts warn that further downside may be imminent before a potential recovery. In a recent analysis, crypto market expert Cryptododo7 predicts that ETH may eye bearish targets around $1,130 to $1,200.

Similarly, analyst CryptoBullet highlighted that ETH has now touched the 300-week moving average for only the second time in its history – an event that has historically signalled a bearish trend.

Despite these cautionary outlooks, market commentator Titan of Crypto recently stated that ETH is still on track to reach new all-time highs later this year. At press time, ETH trades at $1,777, down 5% in the past 24 hours.

ethereum

Ethereum Price Losing Ground—Is a Drop to $1,550 Inevitable?

Ethereum price attempted a recovery wave above the $1,820 level but failed. ETH is now consolidating losses and might face resistance near the $1,840 zone.

  • Ethereum failed to stay above the $1,850 and $1,840 levels.
  • The price is trading below $1,840 and the 100-hourly Simple Moving Average.
  • There is a short-term bearish trend line forming with resistance at $1,810 on the hourly chart of ETH/USD (data feed via Kraken).
  • The pair must clear the $1,820 and $1,840 resistance levels to start a decent increase.

Ethereum Price Dips Further

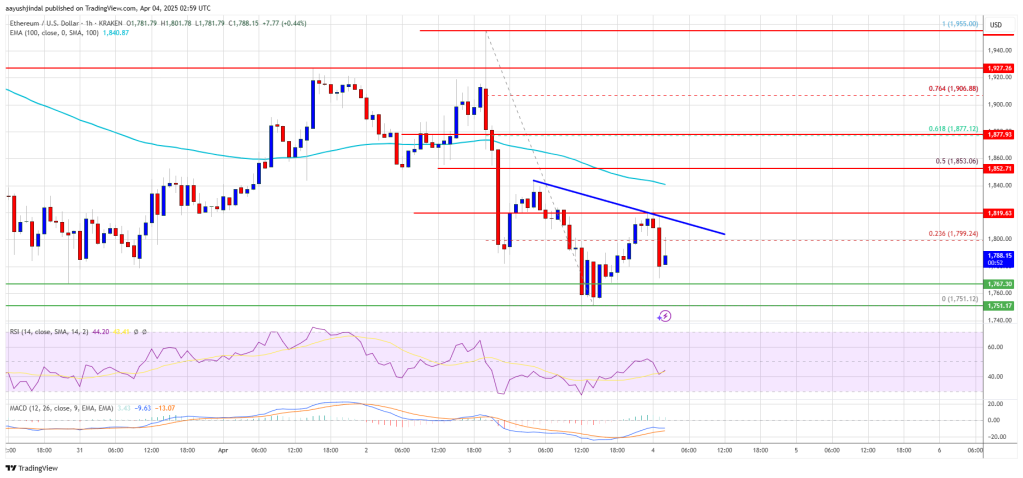
Ethereum price failed to stay above the $1,800 support zone and extended losses, like Bitcoin. ETH traded as low as $1,751 and recently corrected some gains. There was a move above the $1,780 and $1,800 resistance levels.

The bulls even pushed the price above the 23.6% Fib retracement level of the downward move from the $1,955 swing high to the $1,751 low. However, the bears are active near the $1,820 zone. The price is now consolidating and facing many hurdles.

Ethereum price is now trading below $1,820 and the 100-hourly Simple Moving Average. On the upside, the price seems to be facing hurdles near the $1,810 level. There is also a short-term bearish trend line forming with resistance at $1,810 on the hourly chart of ETH/USD.

The next key resistance is near the $1,840 level or the 50% Fib retracement level of the downward move from the $1,955 swing high to the $1,751 low at $1,850. The first major resistance is near the $1,880 level.

Ethereum Price

A clear move above the $1,880 resistance might send the price toward the $1,920 resistance. An upside break above the $1,920 resistance might call for more gains in the coming sessions. In the stated case, Ether could rise toward the $2,000 resistance zone or even $2,050 in the near term.

Another Decline In ETH?

If Ethereum fails to clear the $1,850 resistance, it could start another decline. Initial support on the downside is near the $1,765 level. The first major support sits near the $1,750 zone.

A clear move below the $1,750 support might push the price toward the $1,720 support. Any more losses might send the price toward the $1,680 support level in the near term. The next key support sits at $1,620.

Technical Indicators

Hourly MACDThe MACD for ETH/USD is gaining momentum in the bearish zone.

Hourly RSIThe RSI for ETH/USD is now below the 50 zone.

Major Support Level – $1,750

Major Resistance Level – $1,850

Genius Group says it’s been banned from buying more Bitcoin

Genius Group says it’s been banned from buying more Bitcoin

Singapore-based artificial intelligence firm Genius Group says it’s temporarily barred from expanding its Bitcoin treasury after a US court order has banned it from selling shares, raising funds and using investor funds to buy more Bitcoin.

A New York District court issued the preliminary injunction (PI) and temporary restraining order (TRO) on March 13 in connection with a broader dispute surrounding its merger with Fatbrain AI, the Genius Group said in an April 3 statement.

Fatbrain AI and Genius Group completed a merger and purchase agreement in March 2024, but by Oct. 30, Genius initiated arbitration procedures to terminate, alleging fraud by Fatbrain AI executives connected to the deal.

Genius Group says it’s been banned from buying more Bitcoin

Source: Roger James Hamilton

In February, Fatbrain AI executives Michael Moe and Peter Ritz filed for the TRO and permanent injunction, blocking Genius Group from selling its shares, raising funds and buying more Bitcoin pending the arbitration outcome. 

The injunction has forced Genius Group to close divisions, halt marketing activities and sell 10 Bitcoin (BTC) from its stash of 440, worth over $23 million at current prices, to continue funding its operations. The firm hasn’t ruled out more sales in the future.

“Genius is taking all necessary measures to minimize Bitcoin sales but anticipates that it will need to downsize its Bitcoin Treasury in the coming months in the event the PI remains in place,” the firm said.

Fatbrain AI shareholders also filed two lawsuits against Fatbrain AI executives, including Moe and Ritz, and Genius Group, in April 2024, alleging violation of federal securities laws in connection with the merger, ASX law said in an October statement. 

Genius Group says it’s been banned from buying more Bitcoin

Two shareholder lawsuits against Fatbrain AI alleged conduct during the merger was fraudulent, which defrauded shareholders of $30 million. Source: ASX Law

Genius Group was subsequently voluntarily dismissed from the suits on Feb. 14. 

Genius Group claims it’s breaking Singapore law by following order 

Genius Group says the US court injunction has also forced it to break Singapore law by halting share compensation to employees as part of its employment agreements.

“We never dreamed that it was possible that a US court could block the company from being able to issue shares, raise funds or buy Bitcoin — all actions that would normally be decided by a public company’s shareholders or Board rather than a court,” said Genius Group CEO Roger James Hamilton.

Related: Rumble embraces Trump-era crypto strategy with $17M BTC purchase

He said the firm will “continue to fly the flag for Bitcoin,” even when legally banned from building out its treasury.

Fatbrain AI didn’t immediately respond to Cointelegraph’s request for comment.

Artificial intelligence firm Genius Group first announced in November 2024 that it had taken the first steps to build a Bitcoin treasury by purchasing 110 Bitcoin for $10 million.

The firm had earlier announced its overall goal of committing 90% or more of its current and future reserves to be held in Bitcoin, with an initial target of $120 million, which saw the stock price surge by 66%. 

Genius Group’s share price is down 9.80% in the last trading session to $0.23, with a further 3.74% drop after the bell to $0.22, Google Finance data shows.

Cryptocurrencies, Singapore, United States, Stocks, Court

Genius Group’s share price went down during the last trading session and after the bell. Source: Google Finance 

The stock hit an all-time high of over $96 in June 2022 but has since lost over 99% of its value. 

Binance co-founder Changpeng Zhao to advise Kyrgyzstan on blockchain tech

Binance co-founder Changpeng Zhao to advise Kyrgyzstan on blockchain tech

Former Binance CEO Changpeng “CZ” Zhao will begin advising the Kyrgyz Republic on blockchain and crypto-related regulation and tech after signing a memorandum of understanding with the country’s foreign investment agency.

“I officially and unofficially advise a few governments on their crypto regulatory frameworks and blockchain solutions for gov efficiency, expanding blockchain to more than trading,” the crypto entrepreneur said in an April 3 X post, adding that he finds this work “extremely meaningful.”

His comments came in response to an earlier X post from Kyrgyzstan President Sadyr Zhaparov announcing that Kyrgyzstan’s National Investment Agency (NIA) had signed a memorandum with CZ to provide technical expertise and consulting services for the Central Asian country.

The NIA is responsible for promoting foreign investments and assisting international companies in identifying business opportunities within the country.

Binance co-founder Changpeng Zhao to advise Kyrgyzstan on blockchain tech

Source: Changpeng Zhao

“This cooperation marks an important step towards strengthening technological infrastructure, implementing innovative solutions, and preparing highly qualified specialists in blockchain technologies, virtual asset management, and cybersecurity,” Zhaparov said.

The Kyrgyzstan president added: “such initiatives are crucial for the sustainable growth of the economy and the security of virtual assets, ultimately generating new opportunities for businesses and society as a whole.”

Kyrgyzstan, which officially changed its name from the Republic of Kyrgyzstan to the Kyrgyz Republic in 1993, is a mountainous, land-locked country.

It is considered well-suited for crypto mining operations due to its abundant renewable energy resources, much of which is underutilized.

Over 30% of Kyrgyzstan’s total energy supply comes from hydroelectric power plants, but only 10% of the country’s potential hydropower has been developed, according to a report by the International Energy Agency.

CZ has met with several other state officials in Asia

Malaysia also recently tapped CZ for guidance on crypto-related matters, with Prime Minister Anwar Ibrahim meeting him personally in January.

CZ has also met with officials in the UAE and Bitcoin-stacking country Bhutan — however, it isn’t clear what those meetings entailed.

Related: Is Bitcoin’s future in circular economies or national reserves?

CZ’s latest pursuits come a little over six months after he was released from a four-month prison sentence in the US for violating several anti-money laundering laws.

Since being released, CZ has made investments in blockchain tech, artificial intelligence and biotechnology companies.

CZ also recently donated 1,000 BNB (BNB) — worth almost $600,000 — to support earthquake relief efforts in Thailand and Myanmar after the natural disaster in late April.

Magazine: Financial nihilism in crypto is over — It’s time to dream big again

Bitcoin Price Still In Trouble—Why Recovery Remains Elusive

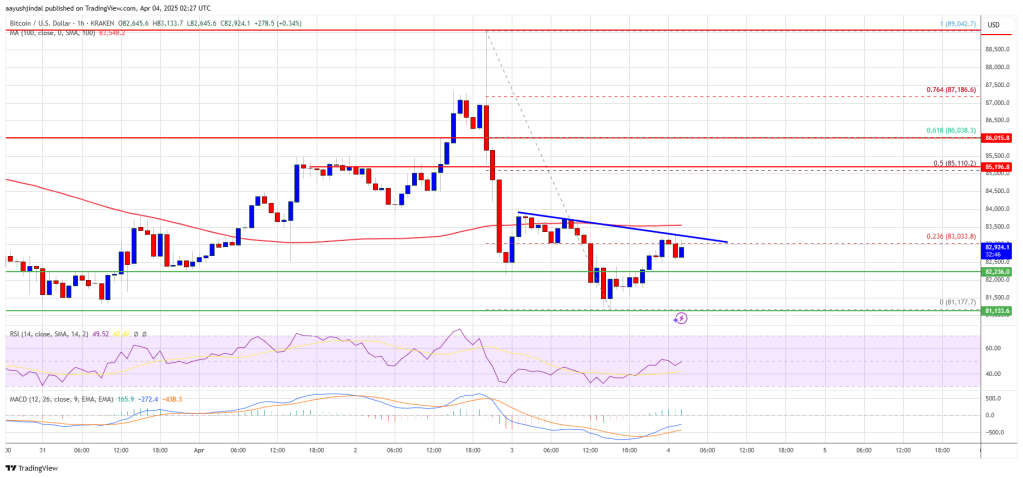
Bitcoin price started a recovery wave from the $81,200 zone. BTC is consolidating losses and facing hurdles near the $83,500 resistance level.

  • Bitcoin started a decent recovery wave above the $82,200 zone.
  • The price is trading below $83,200 and the 100 hourly Simple moving average.
  • There is a connecting bearish trend line forming with resistance at $83,500 on the hourly chart of the BTC/USD pair (data feed from Kraken).
  • The pair could start another increase if it clears the $83,500 zone.

Bitcoin Price Faces Resistance

Bitcoin price extended losses below the $82,500 support zone and tested the $81,200 zone. BTC formed a base and recently started a decent recovery wave above the $82,200 resistance zone.

The bulls were able to push the price above the $82,500 and $83,000 resistance levels. The price even tested the 23.6% Fib retracement level of the recent decline from the $89,042 swing high to the $81,177 low. However, the price is struggling to continue higher.

Bitcoin price is now trading below $83,500 and the 100 hourly Simple moving average. On the upside, immediate resistance is near the $83,200 level. The first key resistance is near the $83,500 level. There is also a connecting bearish trend line forming with resistance at $83,500 on the hourly chart of the BTC/USD pair.

Bitcoin Price

The next key resistance could be $84,500. A close above the $84,500 resistance might send the price further higher. In the stated case, the price could rise and test the $85,500 resistance level. Any more gains might send the price toward the $86,000 level or 61.8% Fib retracement level of the recent decline from the $89,042 swing high to the $81,177 low.

Another Decline In BTC?

If Bitcoin fails to rise above the $83,500 resistance zone, it could start a fresh decline. Immediate support on the downside is near the $82,200 level. The first major support is near the $81,200 level.

The next support is now near the $80,500 zone. Any more losses might send the price toward the $80,000 support in the near term. The main support sits at $78,800.

Technical indicators:

Hourly MACD – The MACD is now losing pace in the bearish zone.

Hourly RSI (Relative Strength Index) – The RSI for BTC/USD is now below the 50 level.

Major Support Levels – $82,200, followed by $81,200.

Major Resistance Levels – $83,500 and $85,000.

Ethereum Faces ‘Hyperinflation Hellscape’—Analyst Reveals Key On-Chain Insights

Ethereum (ETH) continues to underperform in the broader cryptocurrency market, currently trading just below $1,800 after falling 4% in the past 24 hours. Despite a strong start to the year, where the crypto market experienced bullish momentum, ETH has failed to sustain its upward trajectory.

Since slipping below the $3,000 level, the asset has largely ranged downward and has now breached the $2,000 support zone, signaling weakening demand and sentiment.

While Bitcoin and other major digital assets still managed to see some recovery efforts in recent weeks, Ethereum’s price decline has been accompanied by decreasing network activity and weakening on-chain fundamentals.

This divergence has raised concerns over ETH’s short-term outlook and prompted a fresh analysis of the underlying causes driving the asset’s performance.

Fee Decline and Network Inactivity Fuel Inflationary Pressures

CryptoQuant analyst EgyHash recently published a report highlighting key on-chain metrics that suggest Ethereum’s current market weakness is closely tied to its declining fee economy and user activity.

According to the report titled: “Why Ethereum Is Bleeding Value: Fee Crash Meets Hyperinflation Hellscape.” Ethereum’s network is experiencing its lowest levels of activity since 2020.

Ethereum active addresses

Daily active addresses have declined steadily since early 2025, and average transaction fees have dropped to record lows. This reduction in activity has led to a sharp fall in Ethereum’s burn rate, a metric crucial in offsetting inflationary pressures following the network’s transition to proof-of-stake.

The Dencun upgrade, which was expected to enhance network efficiency, has coincided with an extended period of low transaction volumes, further reducing fee income and contributing to higher net ETH issuance.

Ethereum total supply.

EgyHash concludes that the confluence of weak network engagement, reduced burn rate, and high token inflation is central to Ethereum’s declining valuation.

Ethereum Technical Outlook Signals Potential Support

Despite on-chain headwinds, some technical analysts maintain a cautiously optimistic view. Trader Courage, a technical analyst on X, noted that Ethereum is currently testing a major support zone and could rebound toward the upper resistance of its current trading range.

Another market analyst, CryptoElite, shared a long-term ascending trendline that ETH has respected historically. Based on this trend, the analyst believes ETH could still have the potential to rally to $10,000 later in the year, provided broader market conditions improve.

Bitcoin (BTC) price chart on TradingView

Featured image created with DALL-E, Chart from TradingView
Investor demand for XRP falls as the bull market stalls — Will traders defend the $2 support?

Investor demand for XRP falls as the bull market stalls — Will traders defend the $2 support?

Between Oct. 25, 2024, and Jan. 16, 2025, XRP (XRP) had one of the best rallies of the current bull market, gaining 600% as investors piled in with the hope that a pro-crypto presidency would benefit Ripple and its cryptocurrency.

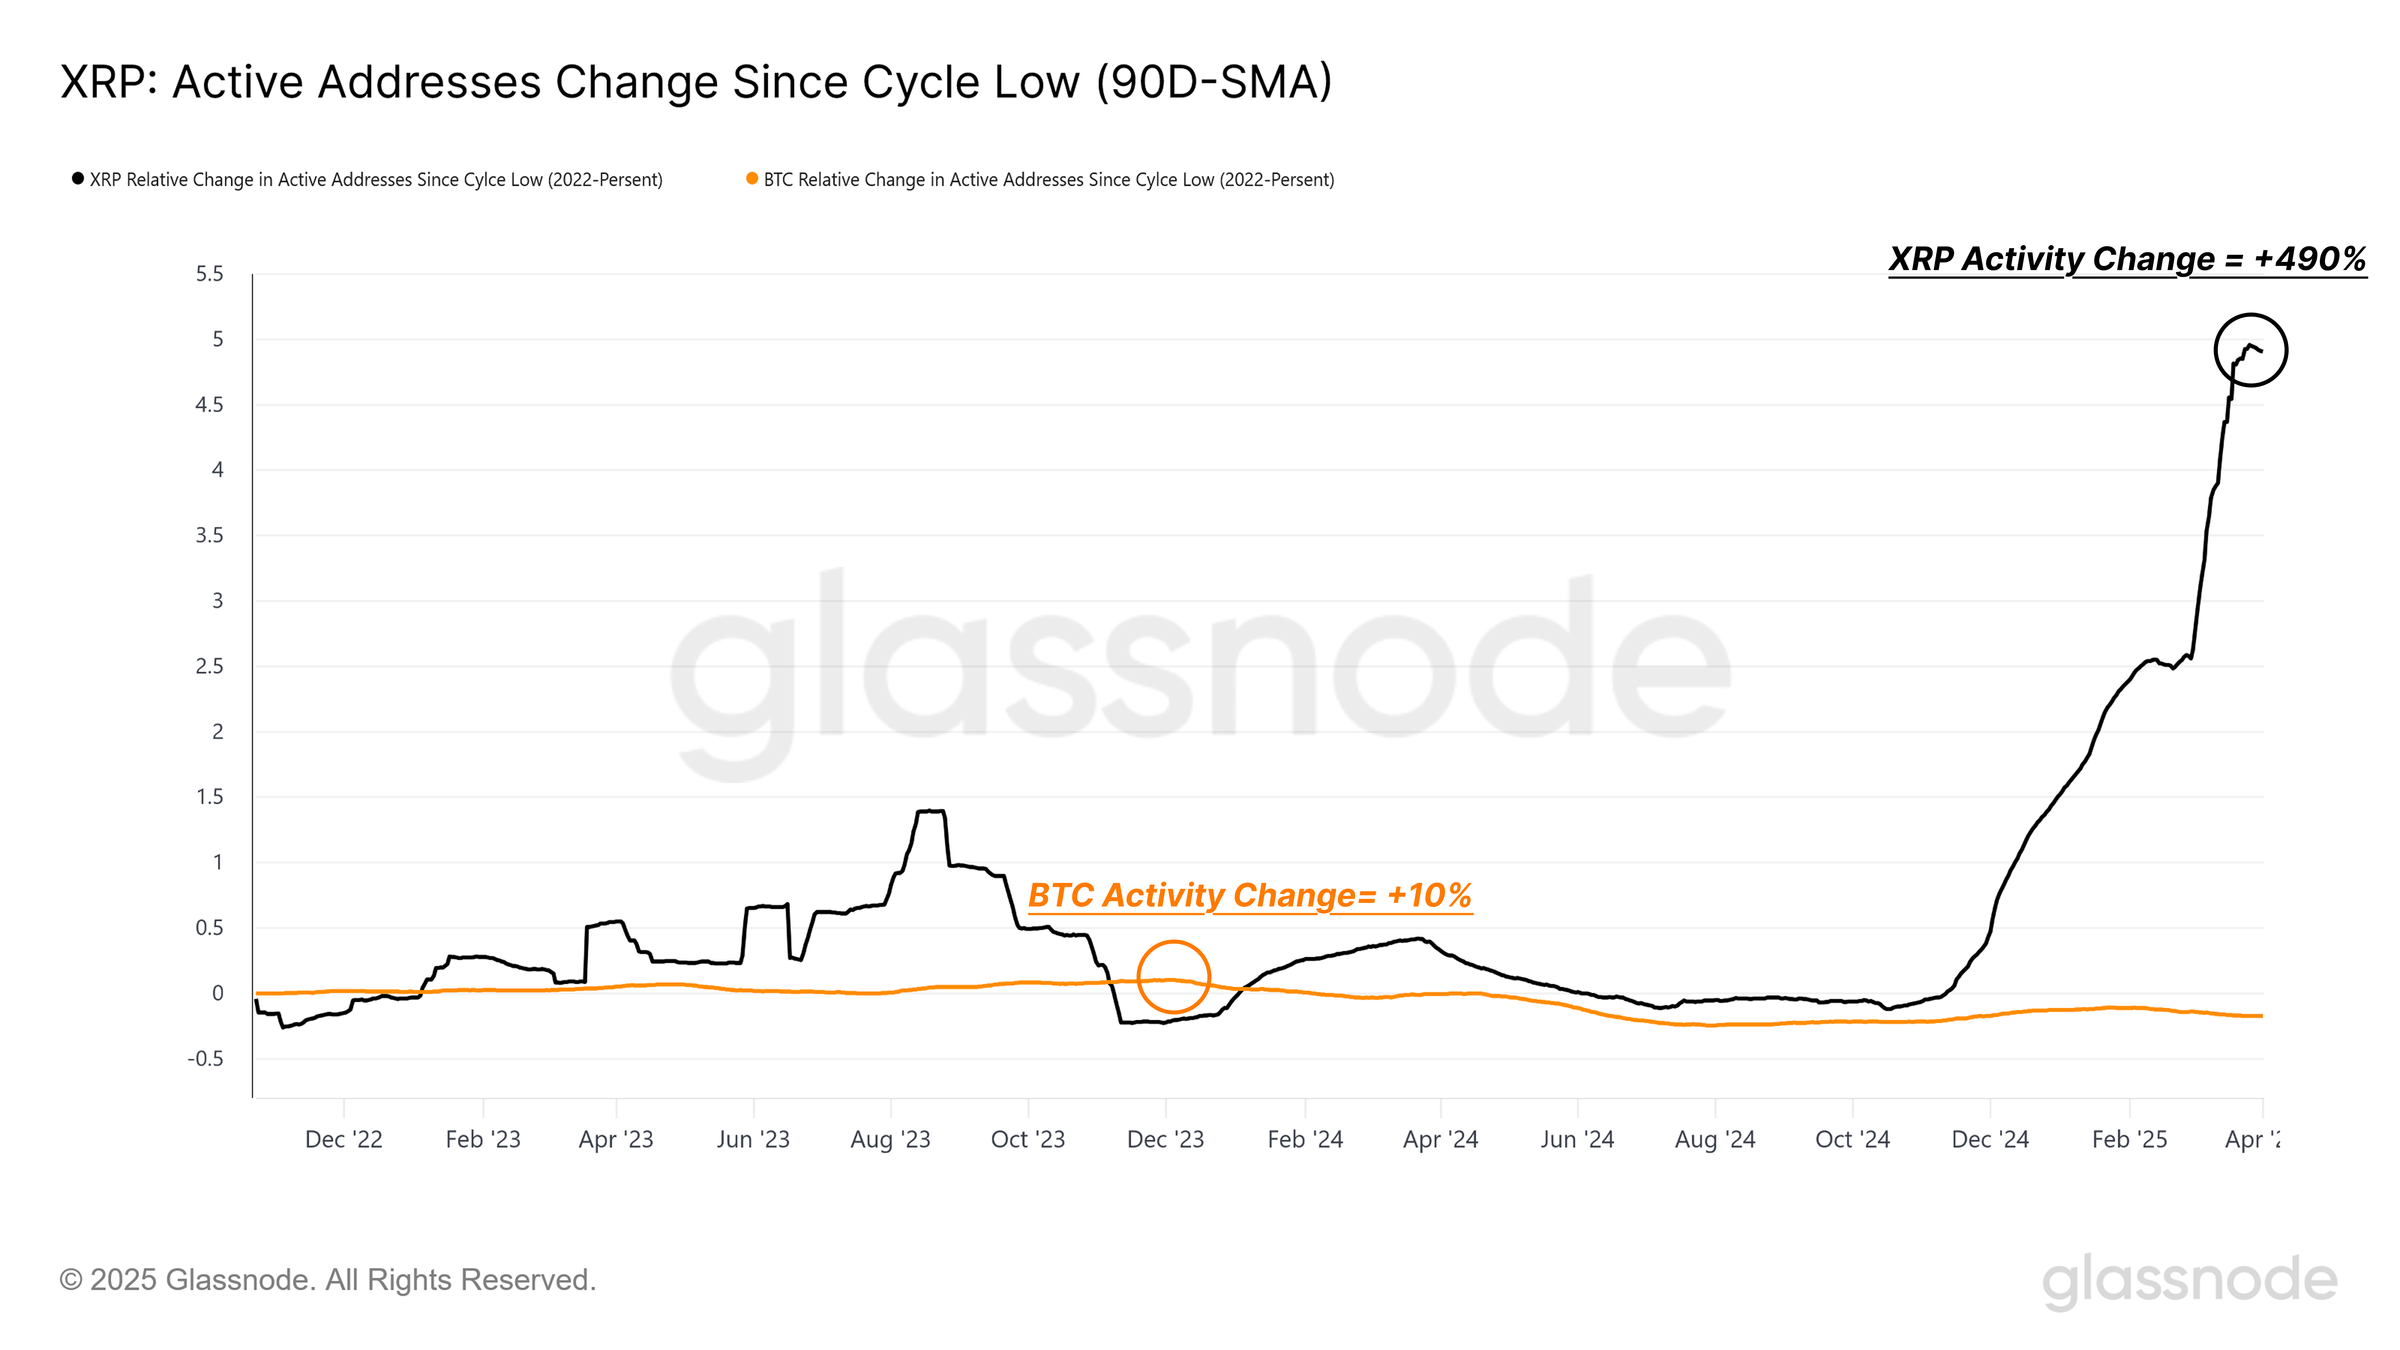
During this time, the quarterly average of daily active addresses jumped by 490% and XRP price hit a 7-year high.

Investor demand for XRP falls as the bull market stalls — Will traders defend the $2 support?

XRP’s 1-day chart. Source: Cointelegraph/TradingView

Fast forward to the present, and data shows that the speculative interest surrounding XRP is declining. Holders are increasingly facing losses rather than gains, which is dampening their risk appetite.

“Retail confidence in XRP may be slipping”

Since bottoming in 2022, Bitcoin (BTC) and XRP have gained 500% to 600%, but the bulk of XRP’s gains came from a parabolic price increase. Data from Glassnode shows that XRP daily active addresses jumped by 490%, whereas the same metric for Bitcoin increased by 10% over the past four months.

XRP, Markets, Price Analysis, Market Analysis

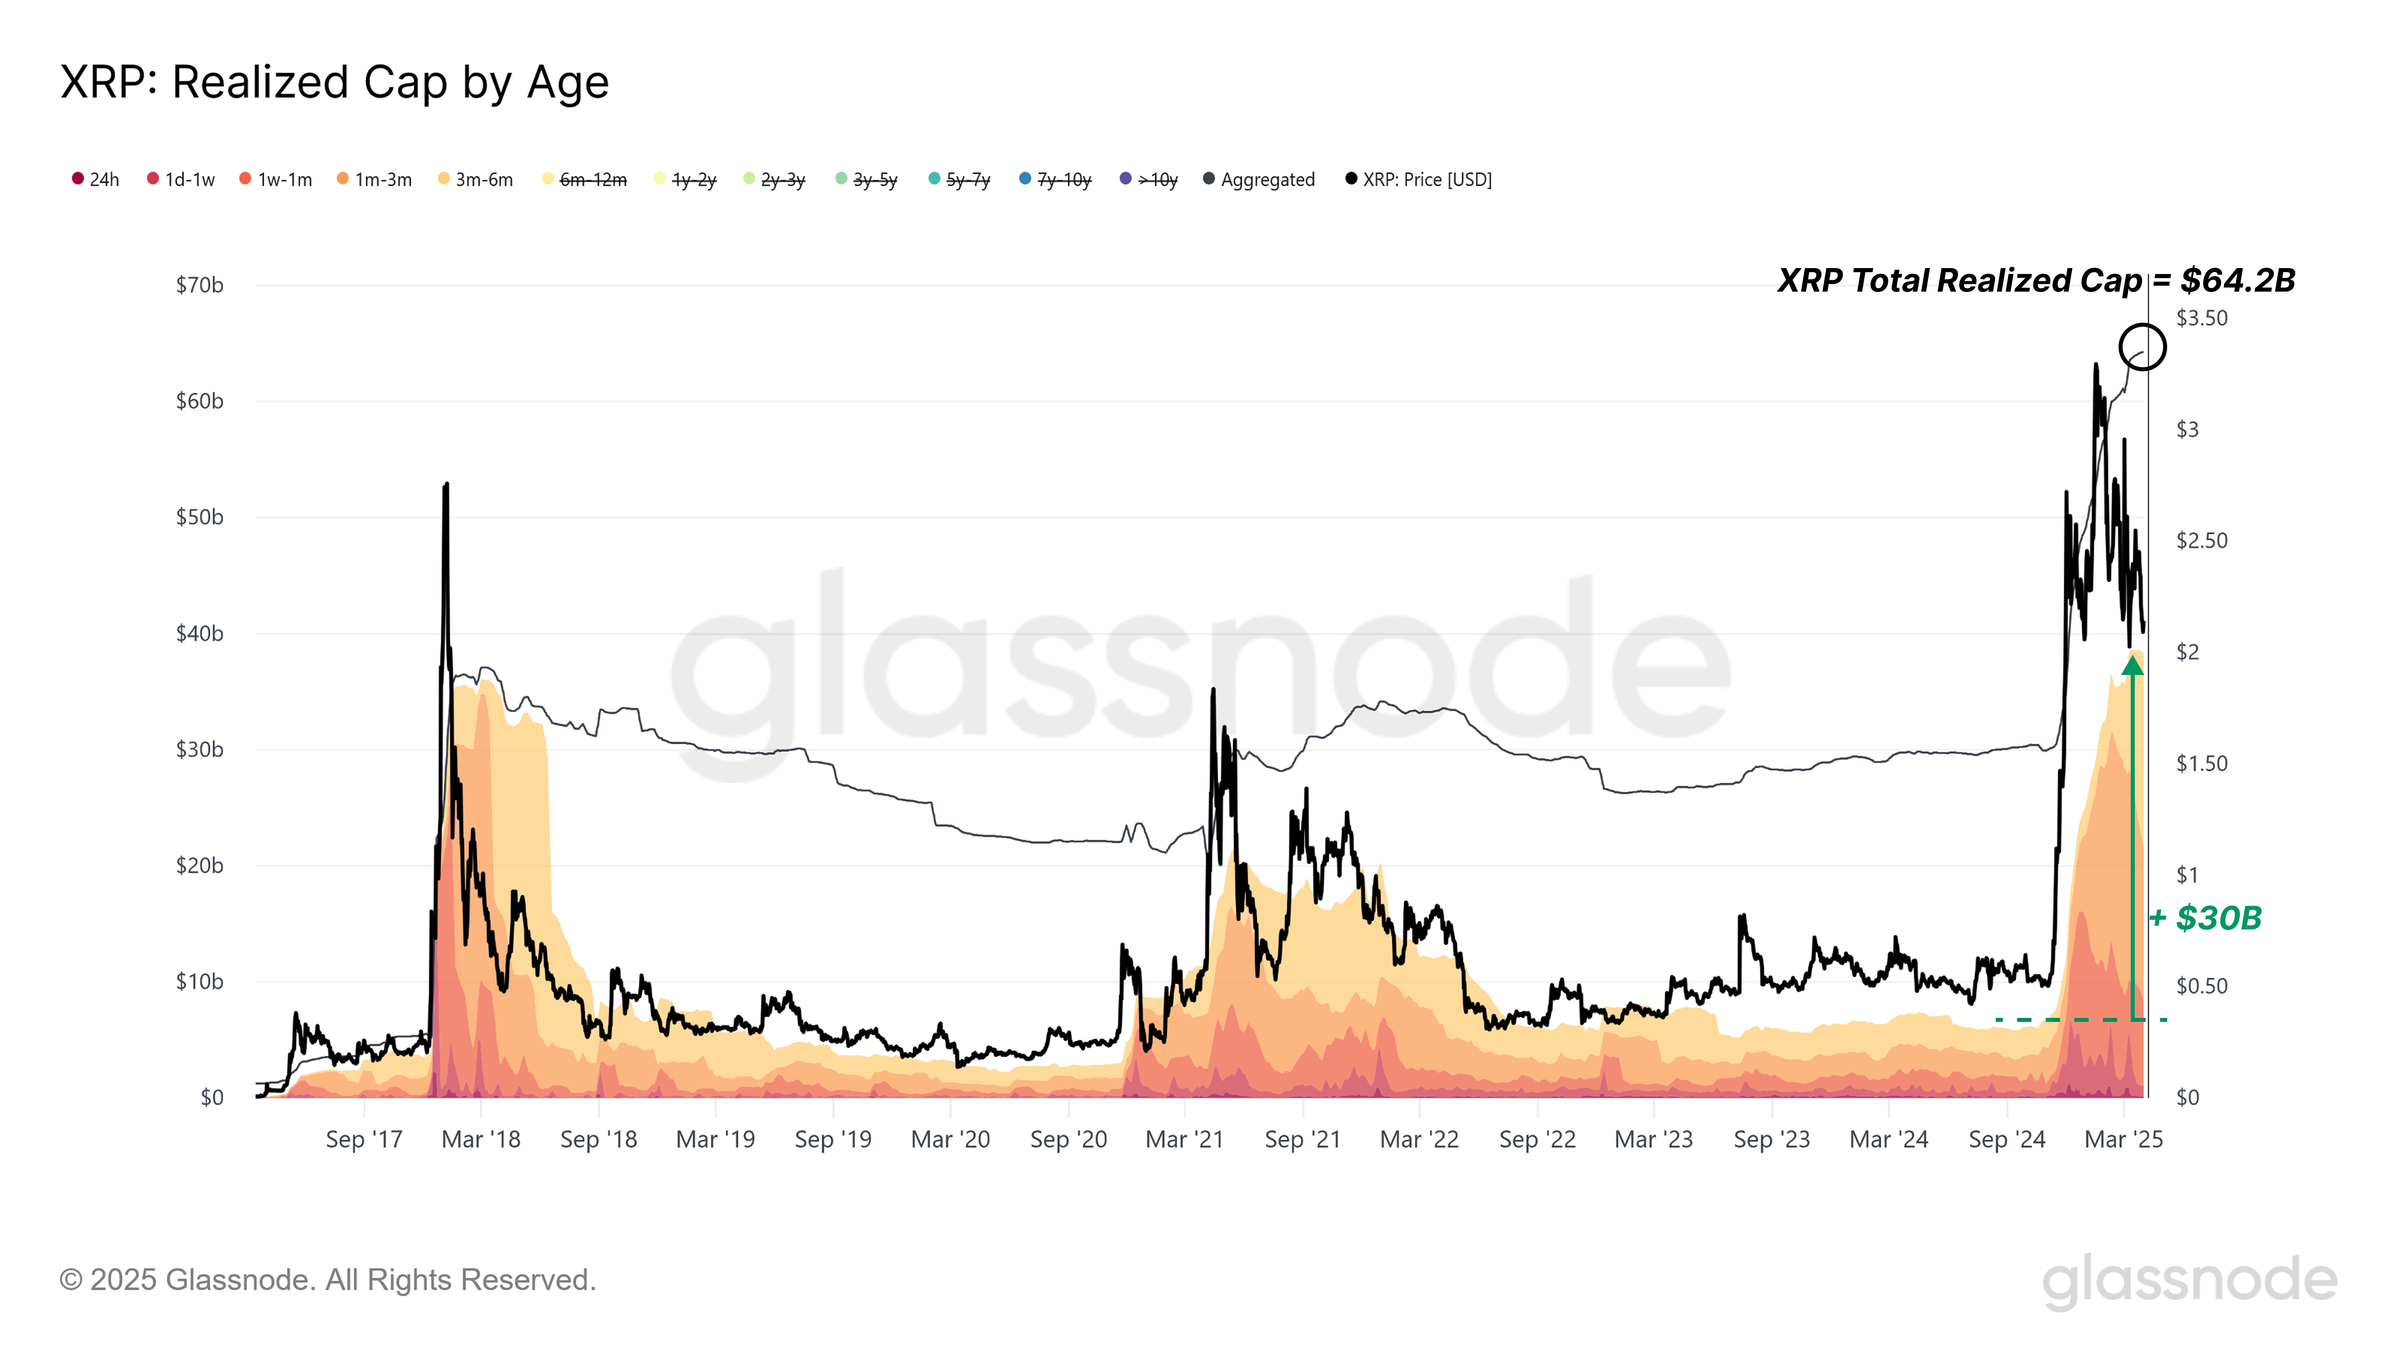
XRP’s new investor realized the cap. Source: Glassnode

This retail-driven surge pushed XRP’s realized cap from $30.1 billion to $64.2 billion, with $30 billion of that inflow coming from investors in the last six months. The share of XRP’s realized cap held by new investors (less than six months) jumped from 23% to 62.8%, signaling a rapid wealth shift. However, since late February 2025, capital inflows have dipped significantly.

XRP, Markets, Price Analysis, Market Analysis

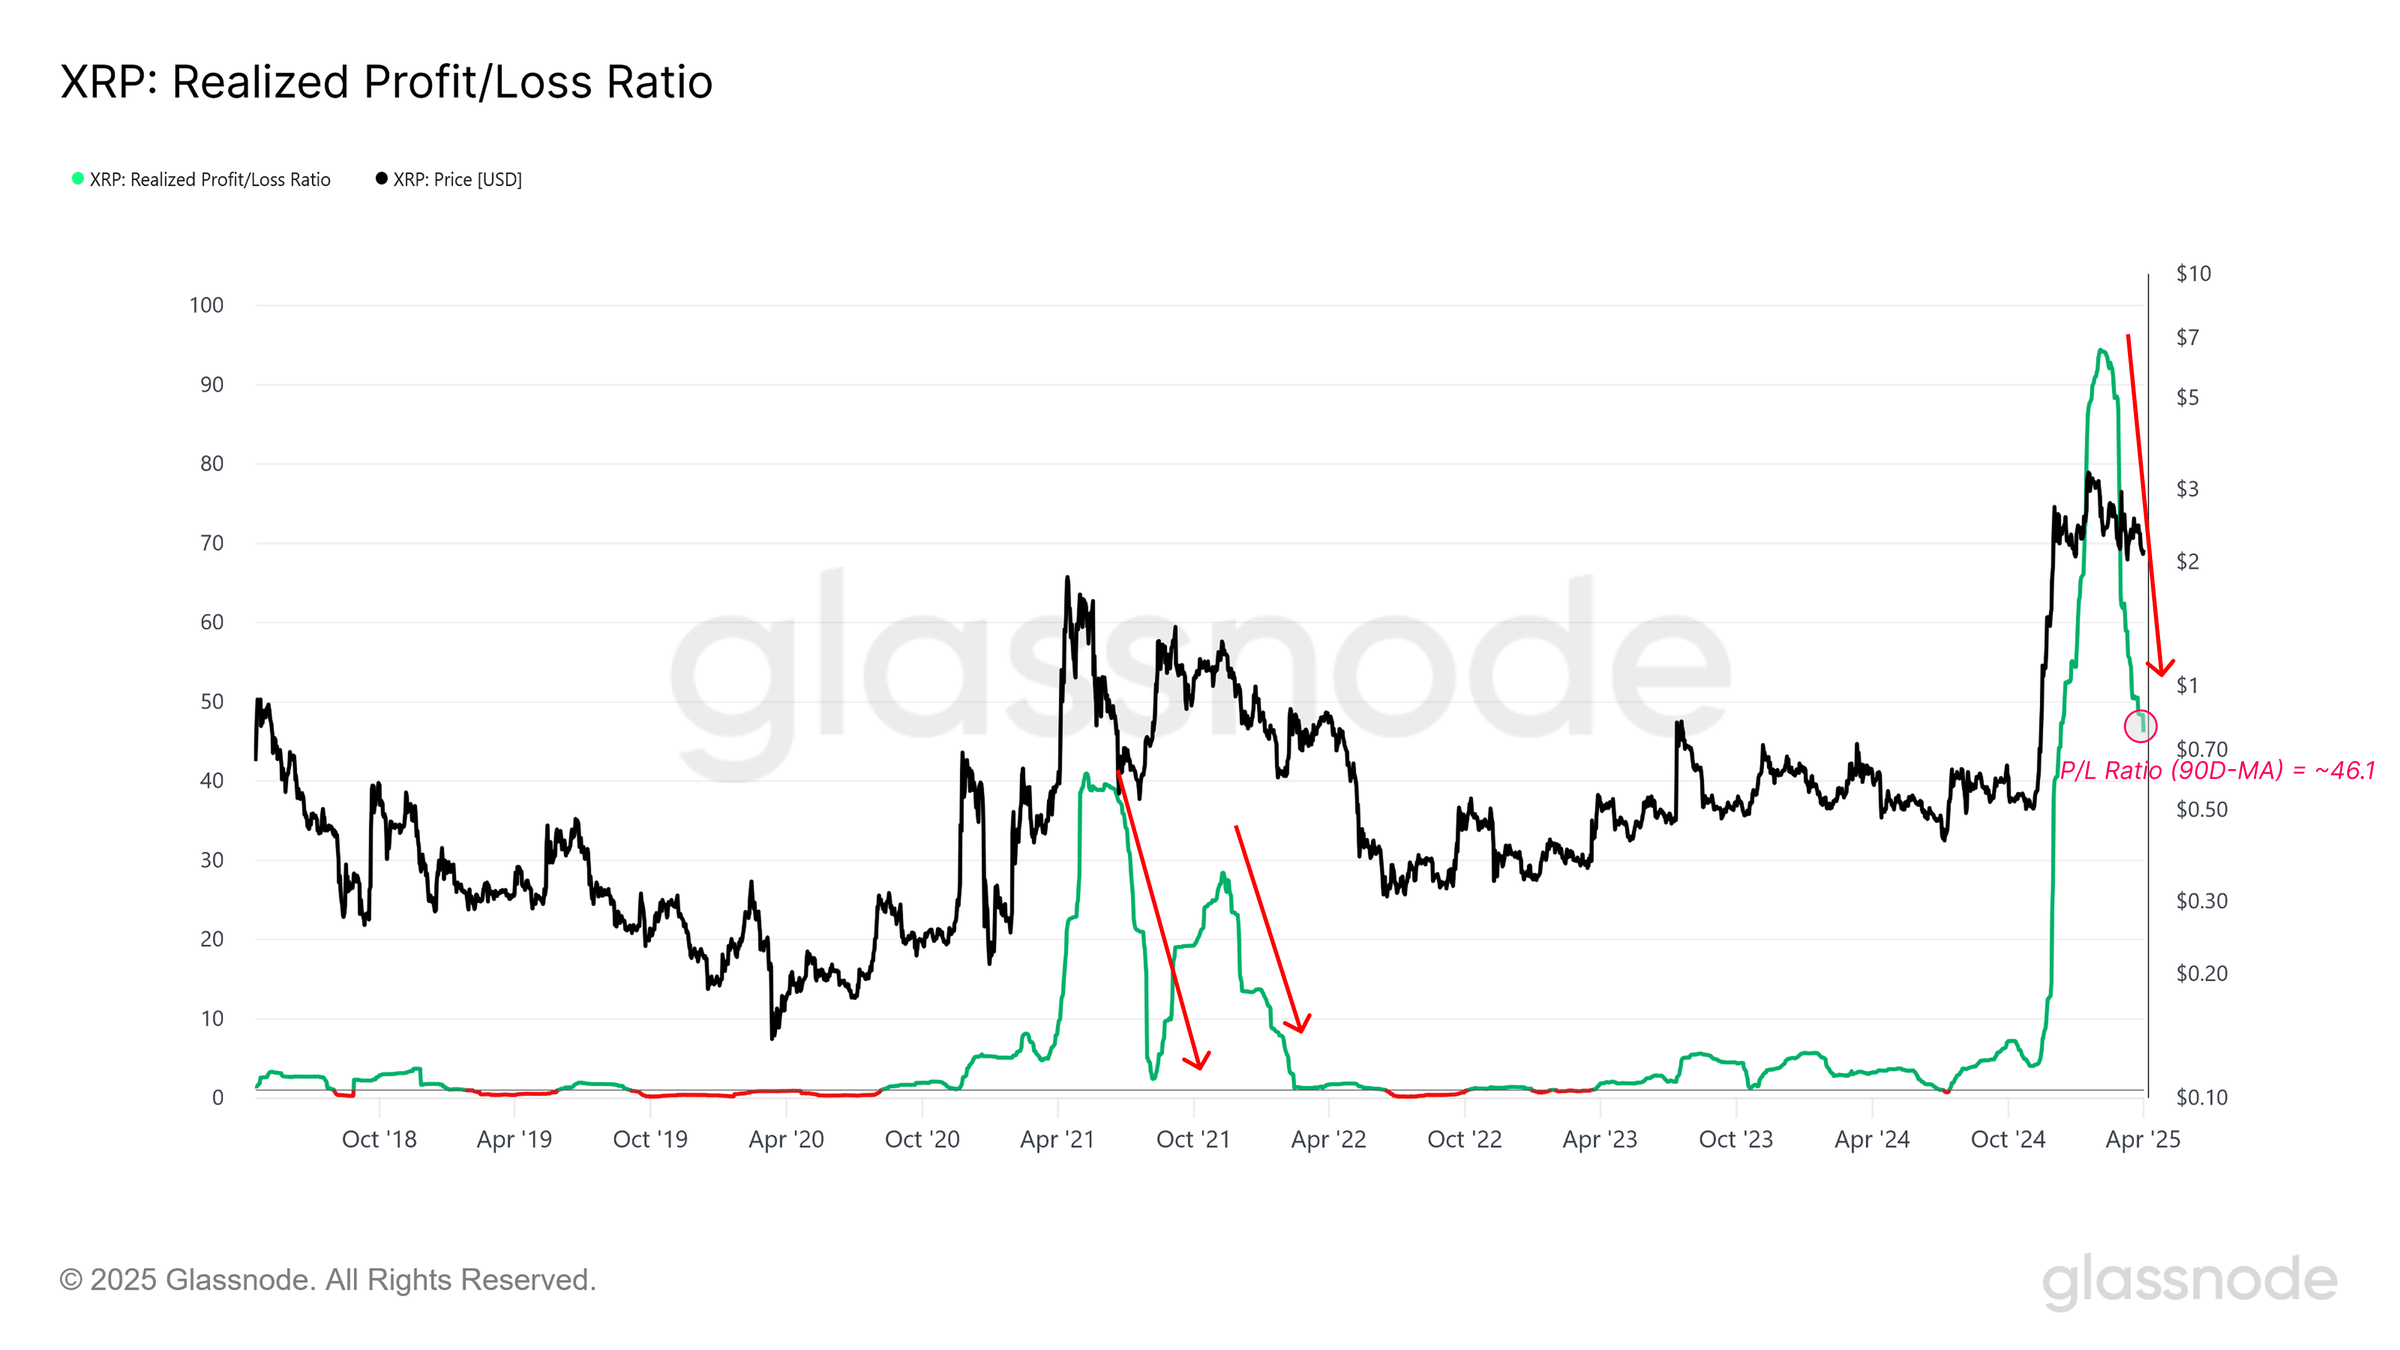
XRP realized profit/loss ratio. Source: Glassnode

The primary reason is that investors are currently locking in fewer profits and staring at higher losses. This can be identified by the realized loss/profit ratio, which has constantly declined since 2025. Glassnode analysts said,

“Given the retail-dominated inflows and largely concentrated wealth in relatively new hands, this alludes to a condition where retail investor confidence in XRP may be slipping, and this may also be extended across the broader market.”

Besides weakening confidence among newer investors, the distribution of XRP among whale addresses reflects a similar trend. Data shows a steady increase in whale outflows since the start of 2025, suggesting that large holders have been consistently trimming their positions. Over the past 14 days, over $1 billion in positions were offloaded at an average price of $2.10.

XRP, Markets, Price Analysis, Market Analysis

Whale flow 30-day moving average. Source: CryptoQuant

Related: How many US dollars does XRP transfer per day?

Can XRP hold the $2 support?

XRP has found support at $2 multiple times over the past few weeks, but the chance of the altcoin dropping below this level increases with each retest.

XRP, Markets, Price Analysis, Market Analysis

XRP 4-hour chart. Source: Cointelegraph/TradingView

However, on the lower time frame (LTF) of the 1-hour and 4-hour charts, a bullish divergence can be observed for XRP. A bullish divergence occurs when the price forms a lower low and the relative strength index (RSI) forms a lower high.

With a fair value gap between $2.08 and $2.13, XRP might see a relief rally into this range, especially if the wider crypto market undergoes an oversold bounce. On the higher time frame chart, XRP appears bearish due to the formation of an inverse head-and-shoulders pattern, with a measured target near $1.07.

There is a chance that the altcoin finds support from the 200-day moving average (orange line) around the $1.70 to $1.80 mark, but XRP price has not tested this level since Nov. 5, 2024.

XRP, Markets, Price Analysis, Market Analysis

XRP 1-day chart. Source: Cointelegraph/TradingView

Related: Bitcoin drops 8%, US markets shed $2T in value — Should traders expect an oversold bounce?

This article does not contain investment advice or recommendations. Every investment and trading move involves risk, and readers should conduct their own research when making a decision.

Glassnode Finds XRP Is Retail’s Top Pick This Cycle

On-chain data analytics firm Glassnode has identified an intriguing shift in retail investor preference, spotlighting XRP as a focal point of speculative interest. The findings, which come from Glassnode’s newly published report titled “Rippling Away,” reveal that while Bitcoin market indicators edge closer to a bearish zone, XRP has seen remarkable inflows of capital and user activity—albeit with signs of waning momentum.

According to Glassnode’s report, Bitcoin has been consolidating between the $76,000 and $87,000 price range. Indicators such as the Realized Profit/Loss Ratio are showing “signs of near-term seller exhaustion but not yet a renewal of sustained bullish momentum.”

Furthermore, a longer-term on-chain “Death-Cross” suggests the market’s current weakness could persist for some time. “Supply in loss remains elevated at 4.7M BTC,” the report states, underlining the depth of investor stress. These conditions, as Glassnode notes, paint a picture of “deepening bearish conditions” for the leading cryptocurrency.

Retail Flocks To XRP

In contrast to Bitcoin’s cautionary signals, Glassnode points to XRP as a proxy for heightened retail speculation this cycle. The report highlights: “For this cycle in particular, Ripple (XRP) has been a preferred asset for trade amongst retail investors, and studying its behavior can, therefore, serve as a proxy for measuring retail speculative demand.”

From the 2022 cycle low, XRP’s daily active addresses have “jumped by +490%” on a quarterly average basis, while Bitcoin’s rose by only 10%. This sharp divergence underscores the retail community’s enthusiasm for XRP, which Glassnode views as indicative of broader speculative appetite in the market.

Daily active addresses for XRP since cycle low (90-day SMA)

The enthusiasm for XRP translated into a near-doubling of its Realized Cap—leaping from $30.1 billion to $64.2 billion during its rally from December 2024 to early 2025. Glassnode estimates that approximately $30 billion of this new capital came in over the last six months, pointing to a fresh wave of market participants.

XRP’s Realized Cap by age

Alongside the short surge in capital flows, there’s been a rapid concentration of wealth in the hands of new investors,” the report explains. However, Glassnode also warns: “When viewed together with the heavy retail participation, this sharp uplift in new holders raises caution signs.”

Glassnode warns that these new investors are vulnerable to downside volatility, especially as XRP’s cost basis becomes more top-heavy. Thus, despite initial excitement, the report notes a cooling of speculative interest since late February 2025.

Glassnode’s Realized Loss/Profit Ratio for XRP has declined steadily since January 2025, suggesting a slip in profitability and “waning confidence.” This might reflect a more fragile market structure, where large swaths of relatively new holders face mounting paper losses.

XRP Realized Loss/Profit Ratio

“The XRP market is showing signs of a top-heavy structure, with many investors caught on a relatively high-cost basis,” the report adds. This fragility in XRP’s positioning could also imply broader caution for retail-driven altcoin markets.

Overall, Glassnode’s latest research underscores the dichotomy in today’s digital asset landscape. While Bitcoin’s drift below $80,000 spurred increased losses for long-term holders, XRP’s meteoric rise and subsequent slowdown depict a market driven by short-term retail enthusiasm that may be approaching saturation.

“For more speculative assets like XRP, demand may have already peaked,” the report concludes, “suggesting caution may be warranted until signs of a robust recovery start to emerge.”

At press time, XRP traded at $2.00.

XRP price

DeFi TVL falls 27% while AI, social apps surge in Q1: DappRadar

DeFi TVL falls 27% while AI, social apps surge in Q1: DappRadar

Economic uncertainty and a major crypto exchange hack pushed down the total value locked in decentralized finance (DeFi) protocols to $156 billion in the first quarter of 2025, but AI and social apps gained ground with a rise in network users, according to a crypto analytics firm.

“Broader economic uncertainty and lingering aftershocks from the Bybit exploit” were the main contributing factors to the DeFi sector’s 27% quarter-on-quarter fall in TVL, according to an April 3 report from DappRadar, which noted that Ether (ETH) fell 45% to $1,820 over the same period.

DeFi TVL falls 27% while AI, social apps surge in Q1: DappRadar

Change in DeFi total value locked between Jan. 2024 and March 2025. Source: DappRadar

The largest blockchain by TVL, Ethereum, fell 37% to $96 billion, while Sui was the hardest hit of the top 10 blockchains by TVL, falling 44% to $2 billion.

Solana, Tron and the Arbitrum blockchains also had their TVLs slashed over 30%.

Meanwhile, blockchains that experienced a larger volume of DeFi withdrawals and had a smaller share of stablecoins locked in their protocols faced extra pressure on top of the falling token prices.

The newly launched Berachain was the only top-10 blockchain by TVL to rise, accumulating $5.17 billion between Feb. 6 and March 31, DappRadar noted.

Market fall didn’t stunt AI and social app user growth

However, the number of daily unique active wallets (DUAW) interacting with AI protocols and social apps increased 29% and 10%, respectively, in Q1, while non-fungible token and GameFi protocols regressed, DappRadar’s data shows.

The monthly average of DUAWs interacting on the AI and social protocols rose to 2.6 million and 2.8 million, while DeFi and GameFi protocols fell double-digits. 

DappRadar said there was “explosive growth” in AI agent protocols, stating that they’re “no longer a concept.”

“They’re here, and they’re shaping new user behaviors,” said the firm. 

DeFi TVL falls 27% while AI, social apps surge in Q1: DappRadar

Change in DeFi total value locked between Jan. 2024 and March 2025. Source: DappRadar

Related: Avalanche stablecoins up 70% to $2.5B, AVAX demand lacks DeFi deployment

Meanwhile, NFT trading volume fell 25% to $1.5 billion, with OKX’s NFT marketplace taking in the most sales at $606 million, while OpenSea and Blur saw $599 million and $565 million, respectively.

Pudgy Penguins NFTs were the most sold collectibles at $177 million, while CryptoPunks NFTs netted $63.6 million from just 477 sales, DappRadar noted.

“When analyzing top collections, CryptoPunks remains a staple — its prestige remains intact even as price fluctuations make it largely inaccessible for the average user.”

Magazine: XRP win leaves Ripple a ‘bad actor’ with no crypto legal precedent set

Dogecoin Price Notches Higher Lows Amid Market Downturn, Why A 270% Surge Is Possible

The Dogecoin price has been defying broader market weakness by establishing a series of higher lows. Amidst the market downturn, technical indicators suggest that Dogecoin could be setting the stage for an explosive rally, with analysts predicting a 270% surge to a new price high. 

Dogecoin Price Prepares For 270% Surge

A Dogecoin price chart shared by crypto analyst Javon Marks reveals a critical shift in momentum. Following a prolonged downtrend that saw the meme coin’s price crash to significant lows, Dogecoin has now broken out of a descending trendline, signaling the potential end of its bear cycle. 

Since reaching a cycle low, Dogecoin has consistently posted higher lows — a common sign of growing buying pressure and a steady uptrend. Following the formation of its latest higher low, Marks believes that DOGE is now positioned in a bullish set-up. 

Historically, similar patterns have preceded parabolic moves in the Dogecoin price, suggesting that the meme coin could be gearing up for an uptrend continuation. According to Marks‘ analysis, if Dogecoin follows the established trend, the next impulsive wave could push its price to $0.653, marking an explosive 270% surge. 

Dogecoin

While past higher low formations support the likelihood of the analyst’s projected rally, Dogecoin’s recent breakout from the descending trendline reinforces its bullish structure. Marks also suggests that a climb to the $0.63 level could serve as a launchpad for Dogecoin, potentially driving its price even higher to $1.25 if its momentum persists.

Despite the ongoing market volatility, DOGE continues to hold key support levels as it eyes a fresh breakout. Notably, a surge to the $1.25 target would mark an impressive 681.25% increase from the meme coin’s current market value of $0.16. 

DOGE Faces Make Or Break Level

According to crypto analyst Ali Martinez, the Dogecoin price is currently at a make-or-break point, meaning that its next move could determine whether it sees a significant breakout or a sharp decline. Sharing a price chart highlighting Fibonacci retracements and trend channels, the analyst revealed that Dogecoin is sitting on a key ascending trendline that has acted as support since 2018.

This trend line aligns with the 0.796 Fibonacci retracement level at $0.16, marking it a crucial support zone. If Dogecoin holds above this level, it could trigger a bullish continuation, with the next major Fibonacci extension level at $0.57. Surpassing this price mark could also propel Dogecoin to the 1.272 Fib at $2.77.

On the flip side, if Dogecoin breaks below $0.16, the next major support lies around the 0.618 Fib at $0.06. The analyst’s chart also highlights a possible breakdown to $0.0066 or even as low as $0.0016 if bearish momentum persists.

Dogecoin