Crypto Analyst Reveals Trigger For 17% Polygon (MATIC) Rally

An analyst has explained how Polygon could see a rally of around 17% if the cryptocurrency’s price breaks above this level.

Parallel Channel May Reveal What Could Be Next For Polygon

In a post on X, analyst Ali has discussed about a parallel channel that Polygon has been consolidating inside during the last few weeks. The “parallel channel” here refers to a technical analysis (TA) pattern that’s drawn using two parallel trendlines.

This pattern’s upper line joins successive tops in the asset while the lower one connects bottoms. While the price is inside the region bounded by these two lines (the “channel”), it’s probable to stay trapped in it, only consolidating sideways.

Naturally, retests of the upper line can likely result in reversals back to the downside, while the lower one may act as a source of support, helping the coin bottom out and regain an uptrend.

There are different types of parallel channels in TA, like the ascending and descending ones, where the channel is slopped upwards or downwards.

In the context of the current topic, though, a parallel channel parallel to the time axis is of interest. This means consolidation inside this channel occurs between the same top and bottom levels.

Like with other consolidation patterns in TA, a break out of the trendlines of the parallel channel can also suggest a continuation of the trend in that direction. More specifically, a surge above the pattern can suggest bullish momentum for the asset, while a drop under the channel may spell a bearish outcome instead.

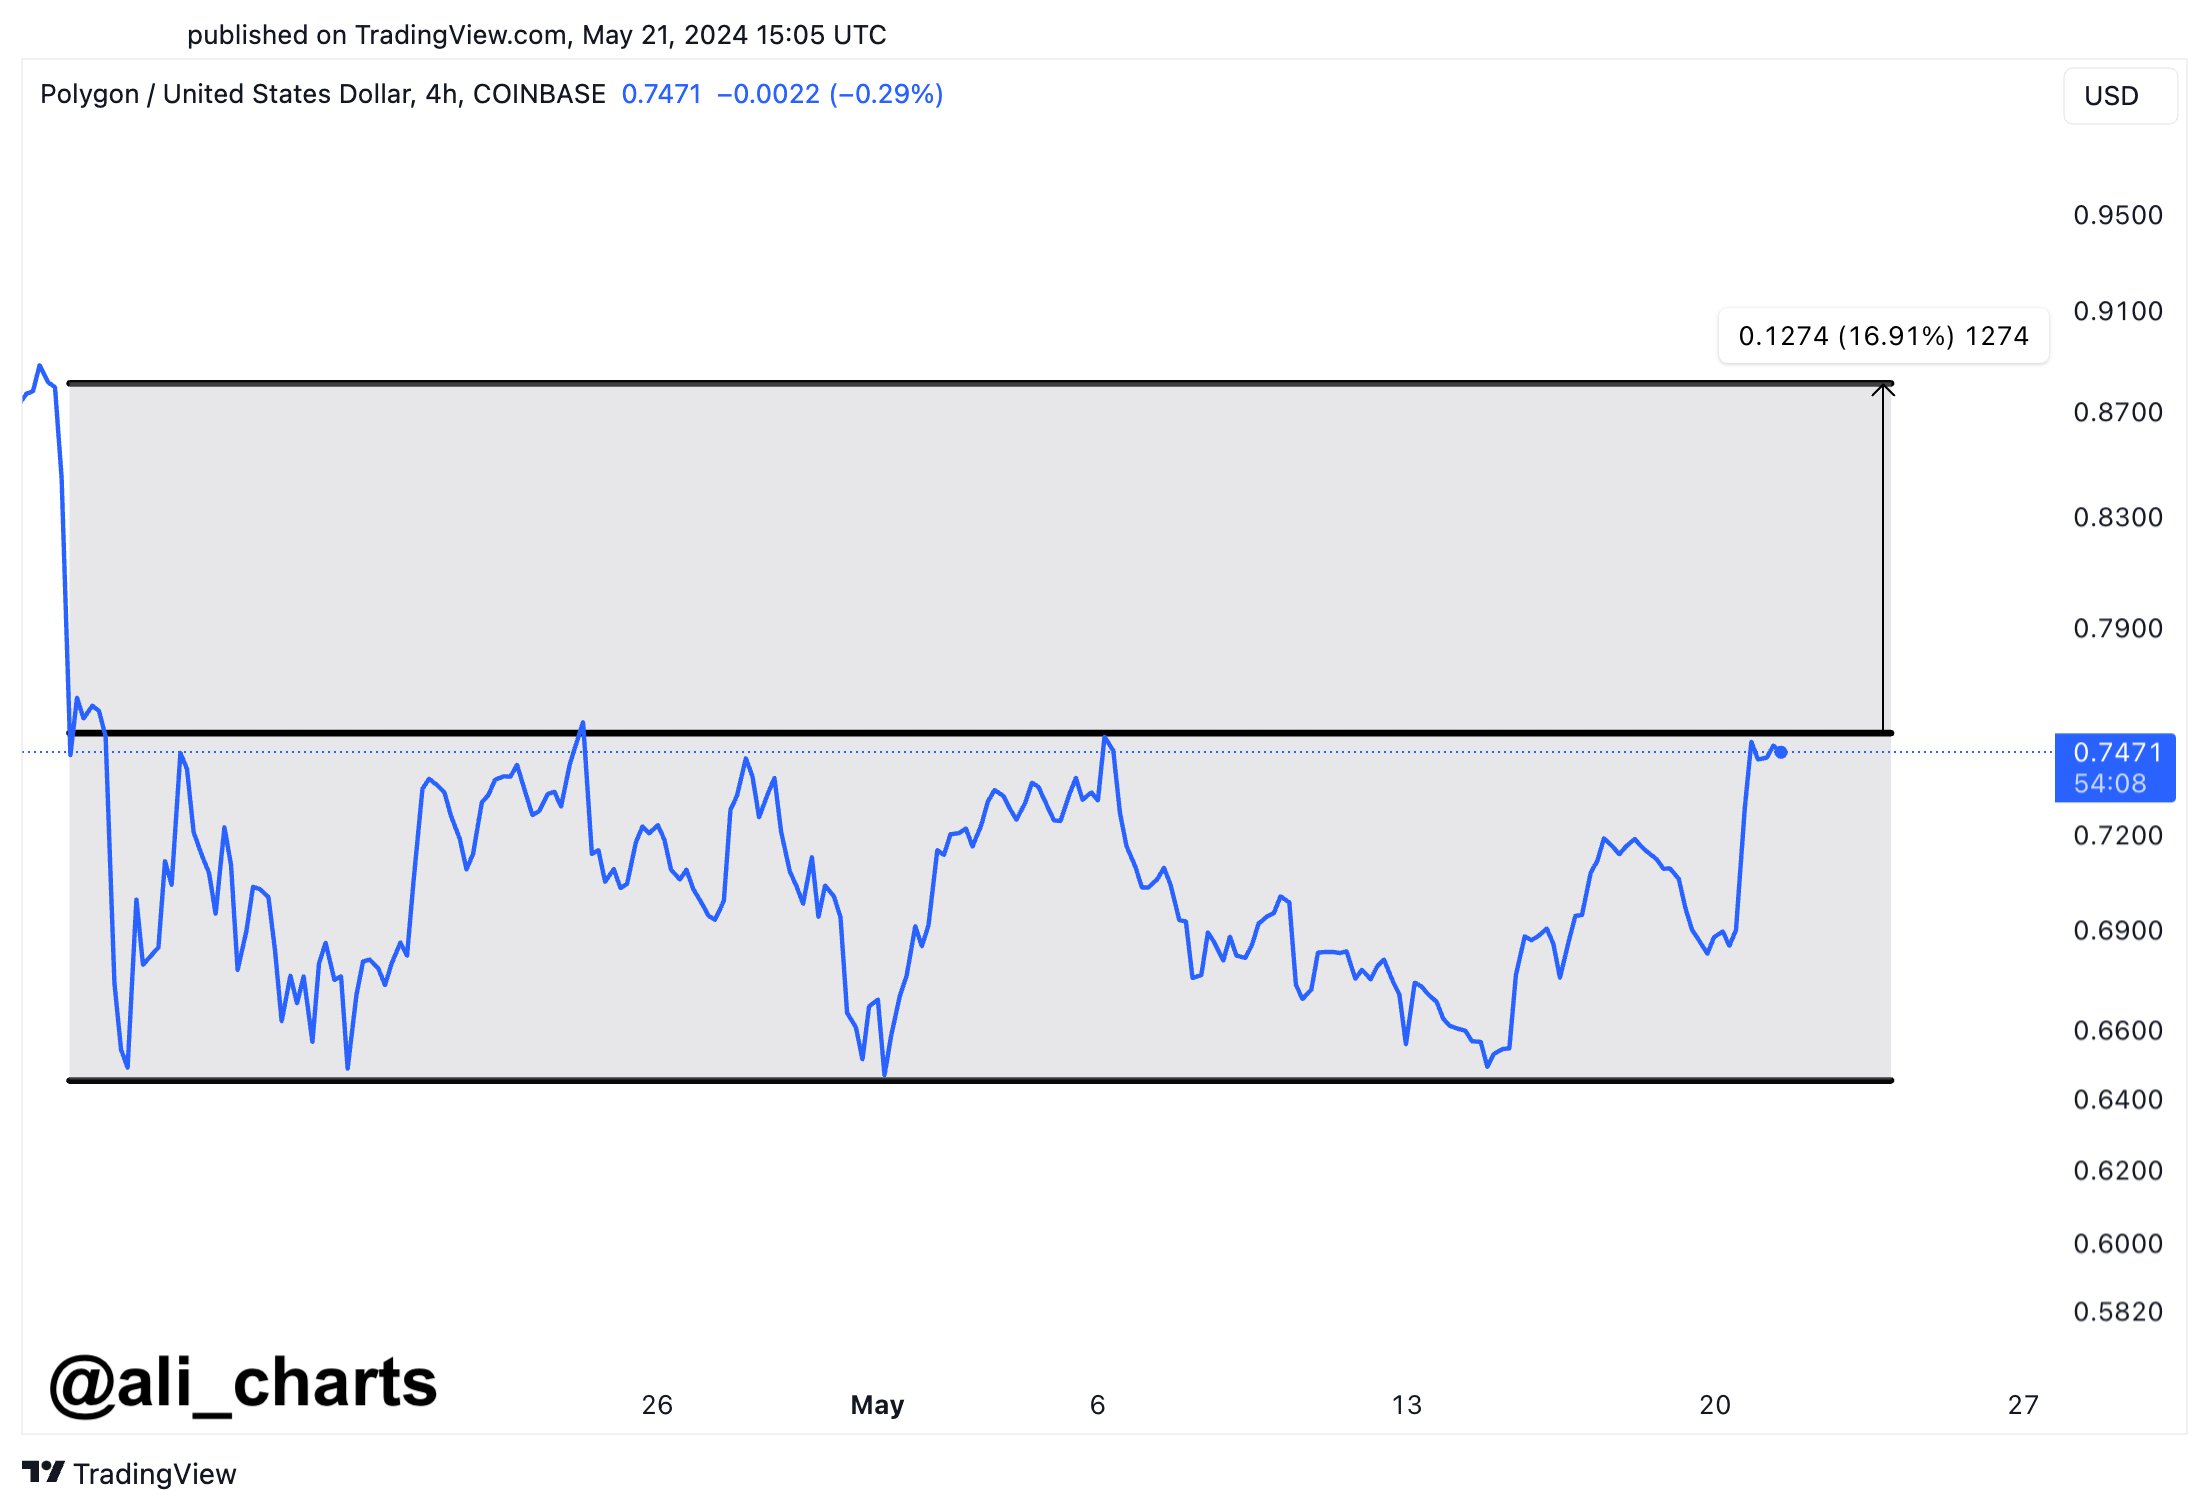
Now, here is a chart that shows how the parallel channel that Polygon has been consolidating inside has looked like over the past month:

Polygon Parallel Channel

From the above graph, it’s visible that Polygon has been stuck in consolidation inside this parallel channel since the cryptocurrency crash last month.

The asset has made some attempts at the upper level, but so far, all of them have failed, with the coin unable to find any break. MATIC is currently floating near the level, so another retest may be coming up soon.

If the Polygon price surges above the channel this time, it may enjoy some sustained bullish momentum. “A breakout above $0.76 could trigger a 17% surge, pushing $MATIC to $0.88!” notes Ali.

This price target is based on the fact that the crash last month, which threw the asset into this consolidation, occurred starting from around that level. Given this potential retest of the upper line of the channel, it now remains to be seen how the cryptocurrency performs in the coming days.

MATIC Price

Polygon almost touched the $0.76 upper level of the channel yesterday, but the coin has since observed a pullback, and it’s now back down to $0.72.
Polygon Price Chart

Polygon Could See Bull Rally To $1.73 If This Happens: Analyst

An analyst explained that Polygon could see a potential bull rally to $1.73 if the cryptocurrency’s price is above this level.

Polygon Appears To Be Breaking Out Of A Symmetrical Triangle Currently

In a new post on X, analyst Ali talked about a multi-year Symmetrical Triangle that Polygon has been traveling inside. The “Symmetrical Triangle” is a pattern in technical analysis (TA) that, as its name already implies, looks like a triangle.

The pattern comprises two converging trendlines, with the upper line being made by joining lower highs in the price, while the lower level connects higher lows.

A feature of this pattern is that these two lines approach each other at roughly an equal (but opposite) slope. This is the reason why there is “symmetrical” in its name.

When the price trades inside the triangle, it tends to encounter resistance at the upper level. As such, tops can probably form at the line. Similarly, the lower line can act as a source of support, thus facilitating likely bottoms to take place.

If the asset breaks through either of these barriers, its price could probably see a sustained push in that direction. This means that breaks above the triangle can be bullish signals, while drops under it can signify that a bearish trajectory has taken over.

There are also other triangle patterns in TA, with two popular ones being the Ascending and Descending Triangles. These two patterns differ from the Symmetrical Triangle in that one of their trendlines is parallel to the time axis (meaning their lines can never have an equal slope).

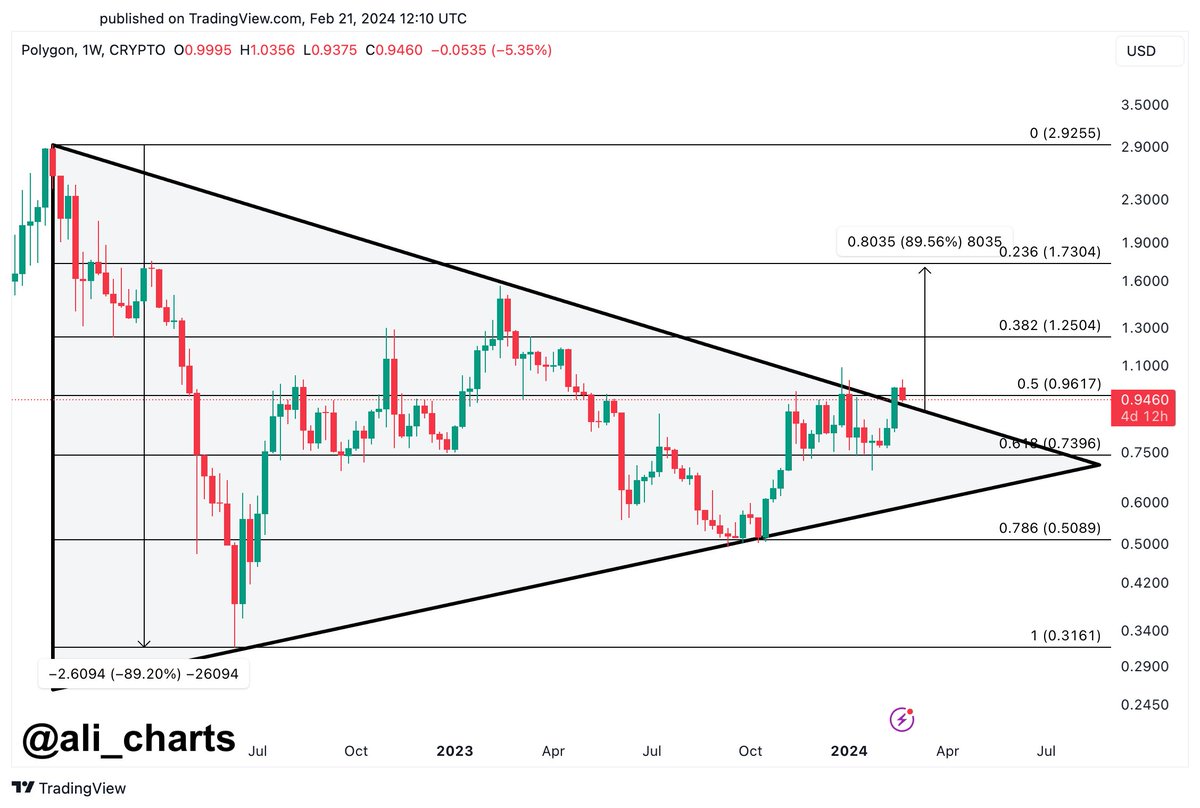
Now, here is the chart shared by Ali that shows a Symmetrical Triangle pattern that the weekly price of Polygon has traded inside for the last couple of years:

Polygon Symmetrical Triangle

As the graph shows, the Polygon weekly price has shown signs of a breakout from this Symmetrical Triangle pattern that it has been stuck inside for multiple years.

Since such breakouts have historically been bullish, this surge for MATIC could mean some sustained bullish momentum may be coming. This is only, of course, if the break truly gets confirmed.

“If MATIC can maintain a close above $0.96, it could signal the start of a bull rally, with a potential target of $1.73!” explains the analyst. From the current asset price, a run to this target would mean an increase of more than 78% for the cryptocurrency.

MATIC Price

After witnessing a break above the $1 mark, Polygon slipped yesterday as its price declined to $0.90. However, the coin has recovered above $0.97 in the past day.

This is above the $0.96 target set by the analyst, so if Polygon can continue to maintain above it now, the break might get confirmed for the asset.

Polygon Price Chart

Polygon Founder Recaps 2023: MATIC’s Surge Powers Through Resistance With 4% Uptrend

Polygon is closing out 2023 on a high note as its native token, MATIC, experienced a significant surge over the past 24 hours, despite its founder highlighting a “painful ride”.

MATIC’s current price stands at $0.8939, accompanied by a 24-hour trading volume of $701,503,128.22. This represents a notable 4.20% price increase within the last 24 hours and a remarkable 14.10% increase over the past 7 days.

Polygon Founder Embraces Underdog Status

Despite a challenging journey throughout 2023, Polygon’s founder, Sandeep Nailwal, recently expressed his contentment with the platform’s underdog status. In a statement on X (formerly Twitter), Nailwal stated:

Polygon is back to where it’s the best at being an underdog. Not going to lie, it’s been a painful ride, the whole of 2023, but right now, it feels incredibly liberating to be the underdog again.

Furthermore, Nailwal went on to outline several reasons why he believes investors should feel bullish about Polygon’s prospects. 

One key feature is Ethereum Virtual Machine (EVM) Compatibility, which allows Polygon to replicate the Ethereum environment as a rollup. This compatibility ensures that any application running on Ethereum or other EVM-compatible chains can be deployed onto zkEVM, Polygon’s layer 2 solution, with minimal modifications.

Another aspect highlighted is the utilization of Zero-Knowledge Proofs (ZKPs) for transaction validation. By leveraging ZKPs, Polygon enhances transaction speeds and reduces gas fees, addressing critical pain points experienced by users on other blockchain platforms.

Scalability is a paramount concern in the blockchain industry, and Polygon aims to address this challenge by executing smart contracts using zero-knowledge technology. 

This approach ensures “scalability without compromising decentralization” and security, bolstering the platform’s overall appeal to developers and users alike.

Moreover, Polygon’s strategic affiliation with zkEVM positions it to leverage the existing ecosystem of over 400 decentralized applications (dApps) within the Polygon network. 

This ecosystem includes a diverse range of DeFi protocols, gaming platforms, and NFT marketplaces. By capitalizing on this thriving ecosystem, Polygon aims to further solidify its position as a leader in the blockchain space.

Midterm Targets And Strategy For MATIC Price Action

Renowned analyst Captain Faibik has released a comprehensive analysis of the price action for Polygon’s native token, MATIC. In his assessment, Captain Faibik identifies key targets and a strategic approach for investors to capitalize on potential gains.

According to Captain Faibik’s analysis, MATIC’s midterm targets are projected at $1.20, $1.60, $2.50, and $4.00. These targets represent potential price levels that MATIC could reach based on historical patterns. 

Notably, to manage risk and protect their investment, Captain Faibik recommends implementing a stop-loss strategy. If the weekly closing price of MATIC falls below $0.55, it is suggested to exit the position.

Furthermore, Captain Faibik advises investors to adopt a long-term mindset and hold their MATIC investment for a minimum of 60 days. This holding period enables investors to ride out short-term price fluctuations and potentially capitalize on the projected targets identified.

Polygon

Featured image from Shutterstock, chart from TradingView.com

Polygon Whales Go On 120 Million MATIC Buying Spree, Rally Soon?

On-chain data shows the Polygon whales have loaded up on 120 million MATIC during the past week, a sign that could be bullish for the asset’s price.

Polygon Whales Have Increased Their Holdings Recently

As pointed out by an analyst in a post on X, MATIC whales have made a decent amount of buys during the past week. The relevant indicator here is the “Supply Distribution,” which keeps track of the total amount of Polygon that the different holder groups are carrying in their wallets right now.

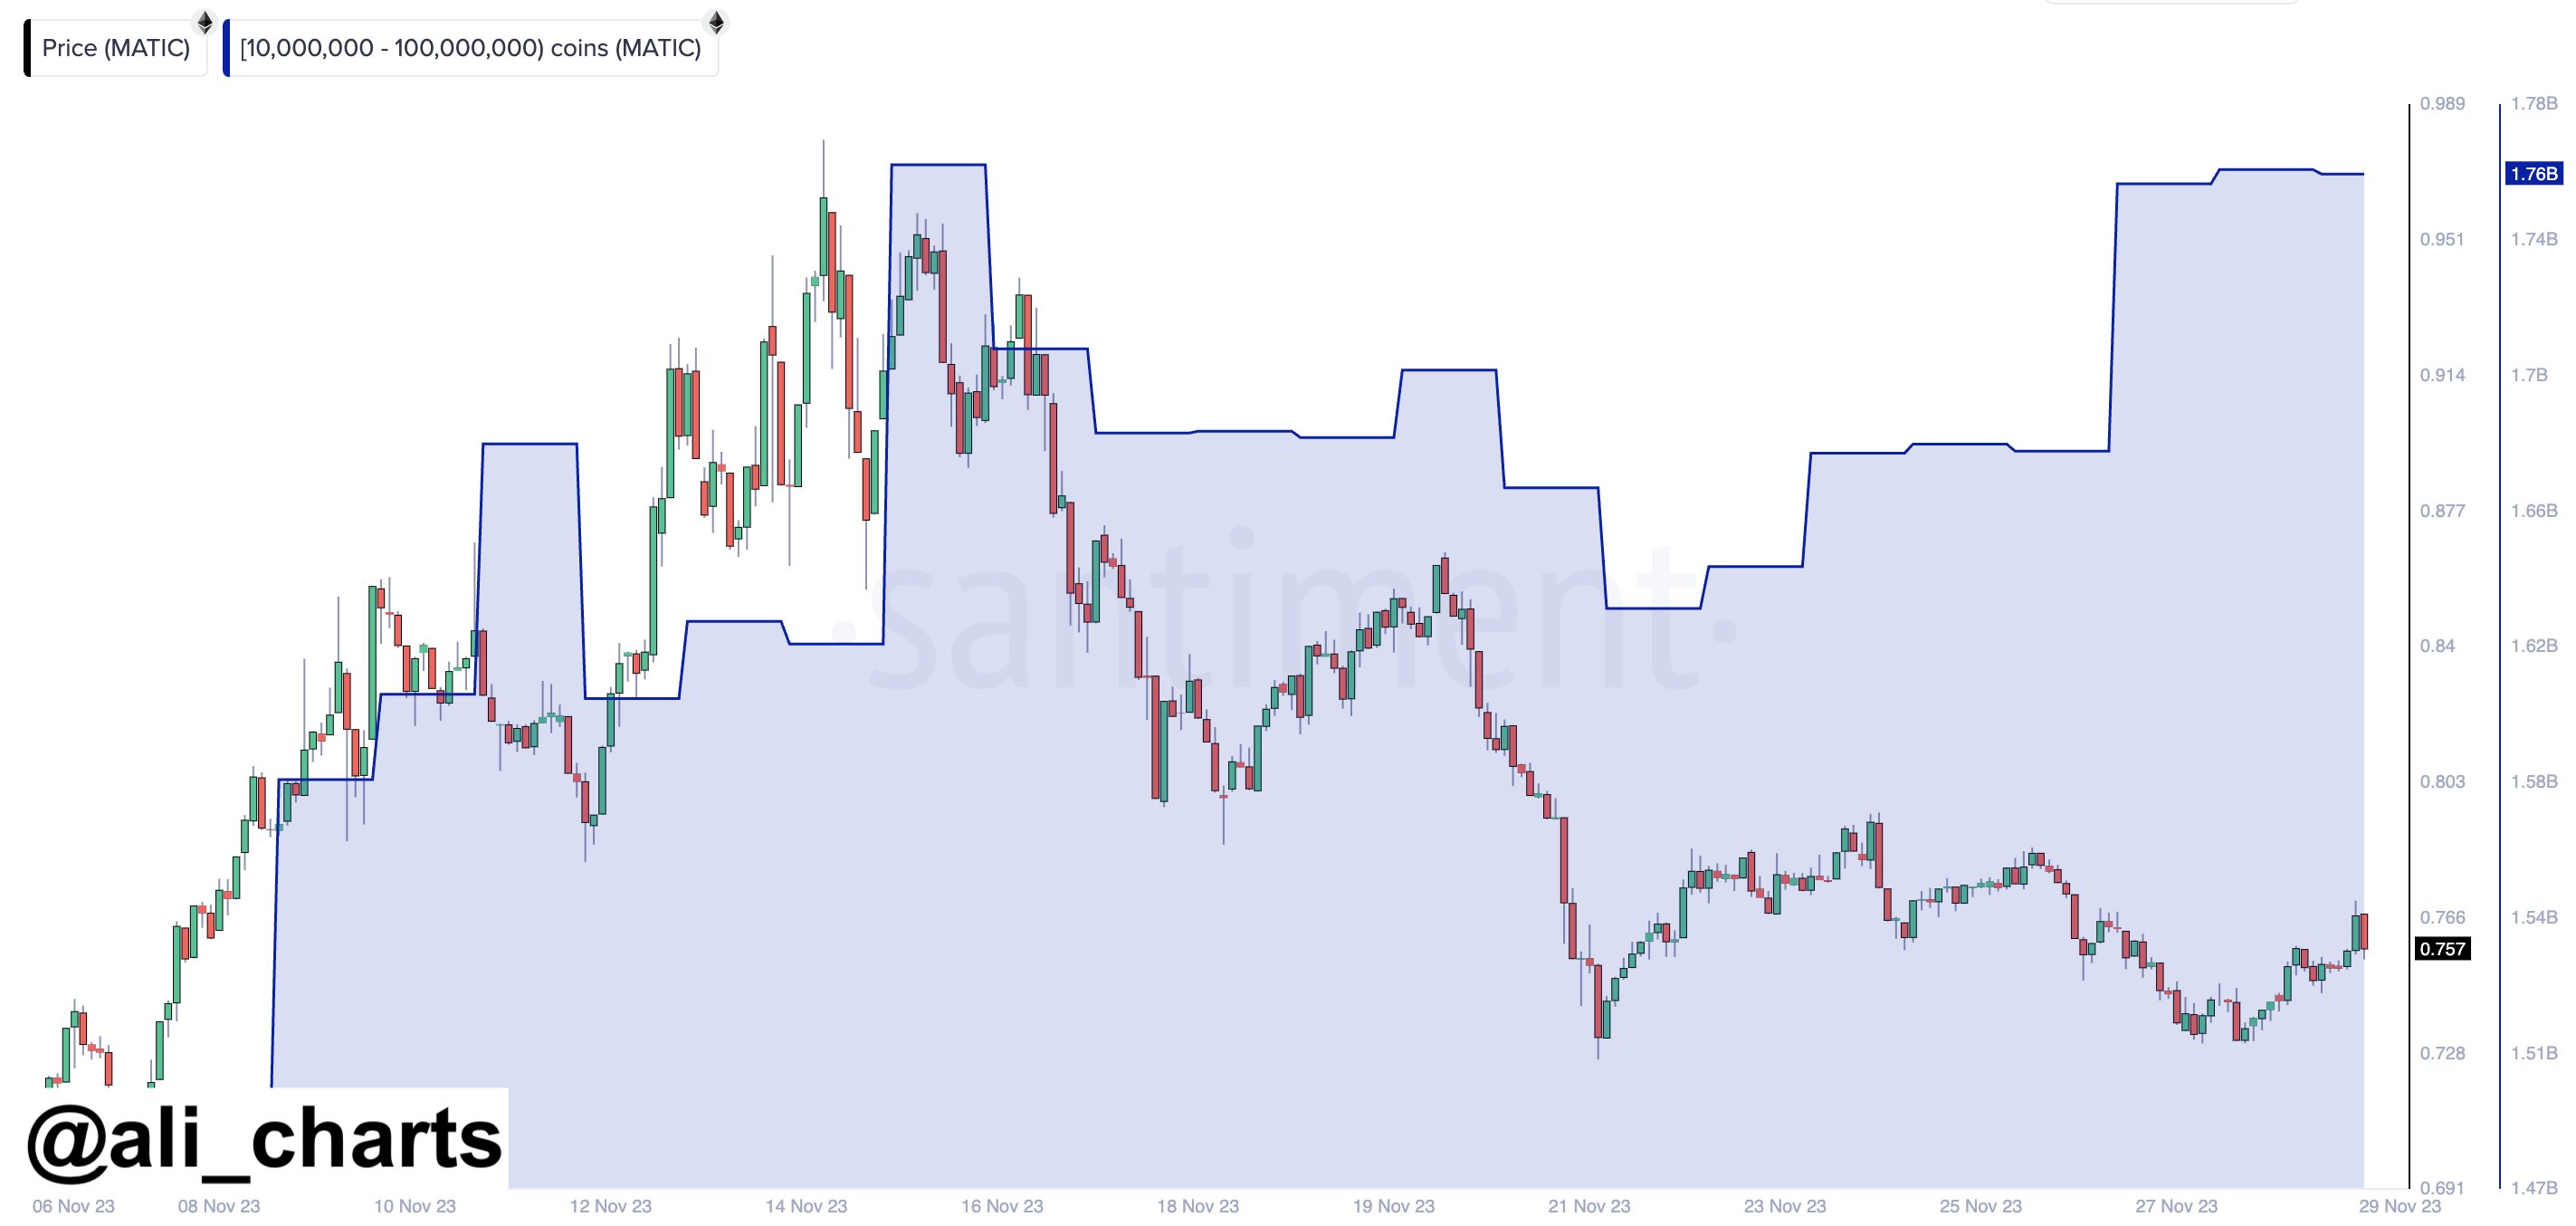
In the context of the current topic, the whales are the ones of interest and their group address balance range may be defined as 10 million to 100 million MATIC (which converts to about $7.7 million to $77 million at the current exchange rate).

The whales are the most powerful entities on the network, because of the sheer scale of reserves they hold. As such, their movements can often be worth keeping an eye on, as they may end up having an influence on the asset’s value.

Now, here is a chart that shows the trend in the Polygon Supply Distribution specifically for these humongous holders over the past month:

Polygon Whales

As displayed in the above graph, the indicator’s value for the Polygon whales has registered a notable uplift during the past week. In total, these large investors have scooped up more than 120 million MATIC (approximately $92.5 million) in this window.

These buys from the whales have come while the cryptocurrency’s price has been trading around its lows following a sharp pullback from just under the $1 level.

Naturally, this accumulation could be a positive sign for the asset’s future, as it suggests that the whales believe the current prices are low enough to gamble more on.

While this may be so, though, another signal has also been brewing for Polygon recently and this one’s not quite as optimistic. As another analyst has explained in a CryptoQuant Quicktake post, the MATIC exchange reserve has observed a considerable rise recently, as the below chart shows.

Polygon Exchange Reserve

The “exchange reserve” here is an indicator that keeps track of the total amount of Polygon that’s currently being stored in the wallets of all centralized exchanges.

From the chart, it’s apparent that the metric started rising shortly after the recent rally in the asset took place, implying that investors began making net deposits.

One of the main reasons why investors would transfer their coins to the exchanges is for selling purposes, so it’s likely that these deposits were coming from those looking to cash in on the profit-taking opportunity.

This isn’t particularly egregious behavior, but the worrying fact may be that the exchange reserve has only continued to rise even after the asset has observed a significant downtrend from the top, meaning that the selling pressure isn’t slowing down.

The whale accumulation is a bullish sign for Polygon, but so long as these exchange inflows continue, it’s perhaps unlikely that the price would feel any benefit in the short term.

MATIC Price

Polygon is currently trading above the $0.77 mark, having seen a plunge of over 21% since the top earlier in the month.

Polygon Price Chart