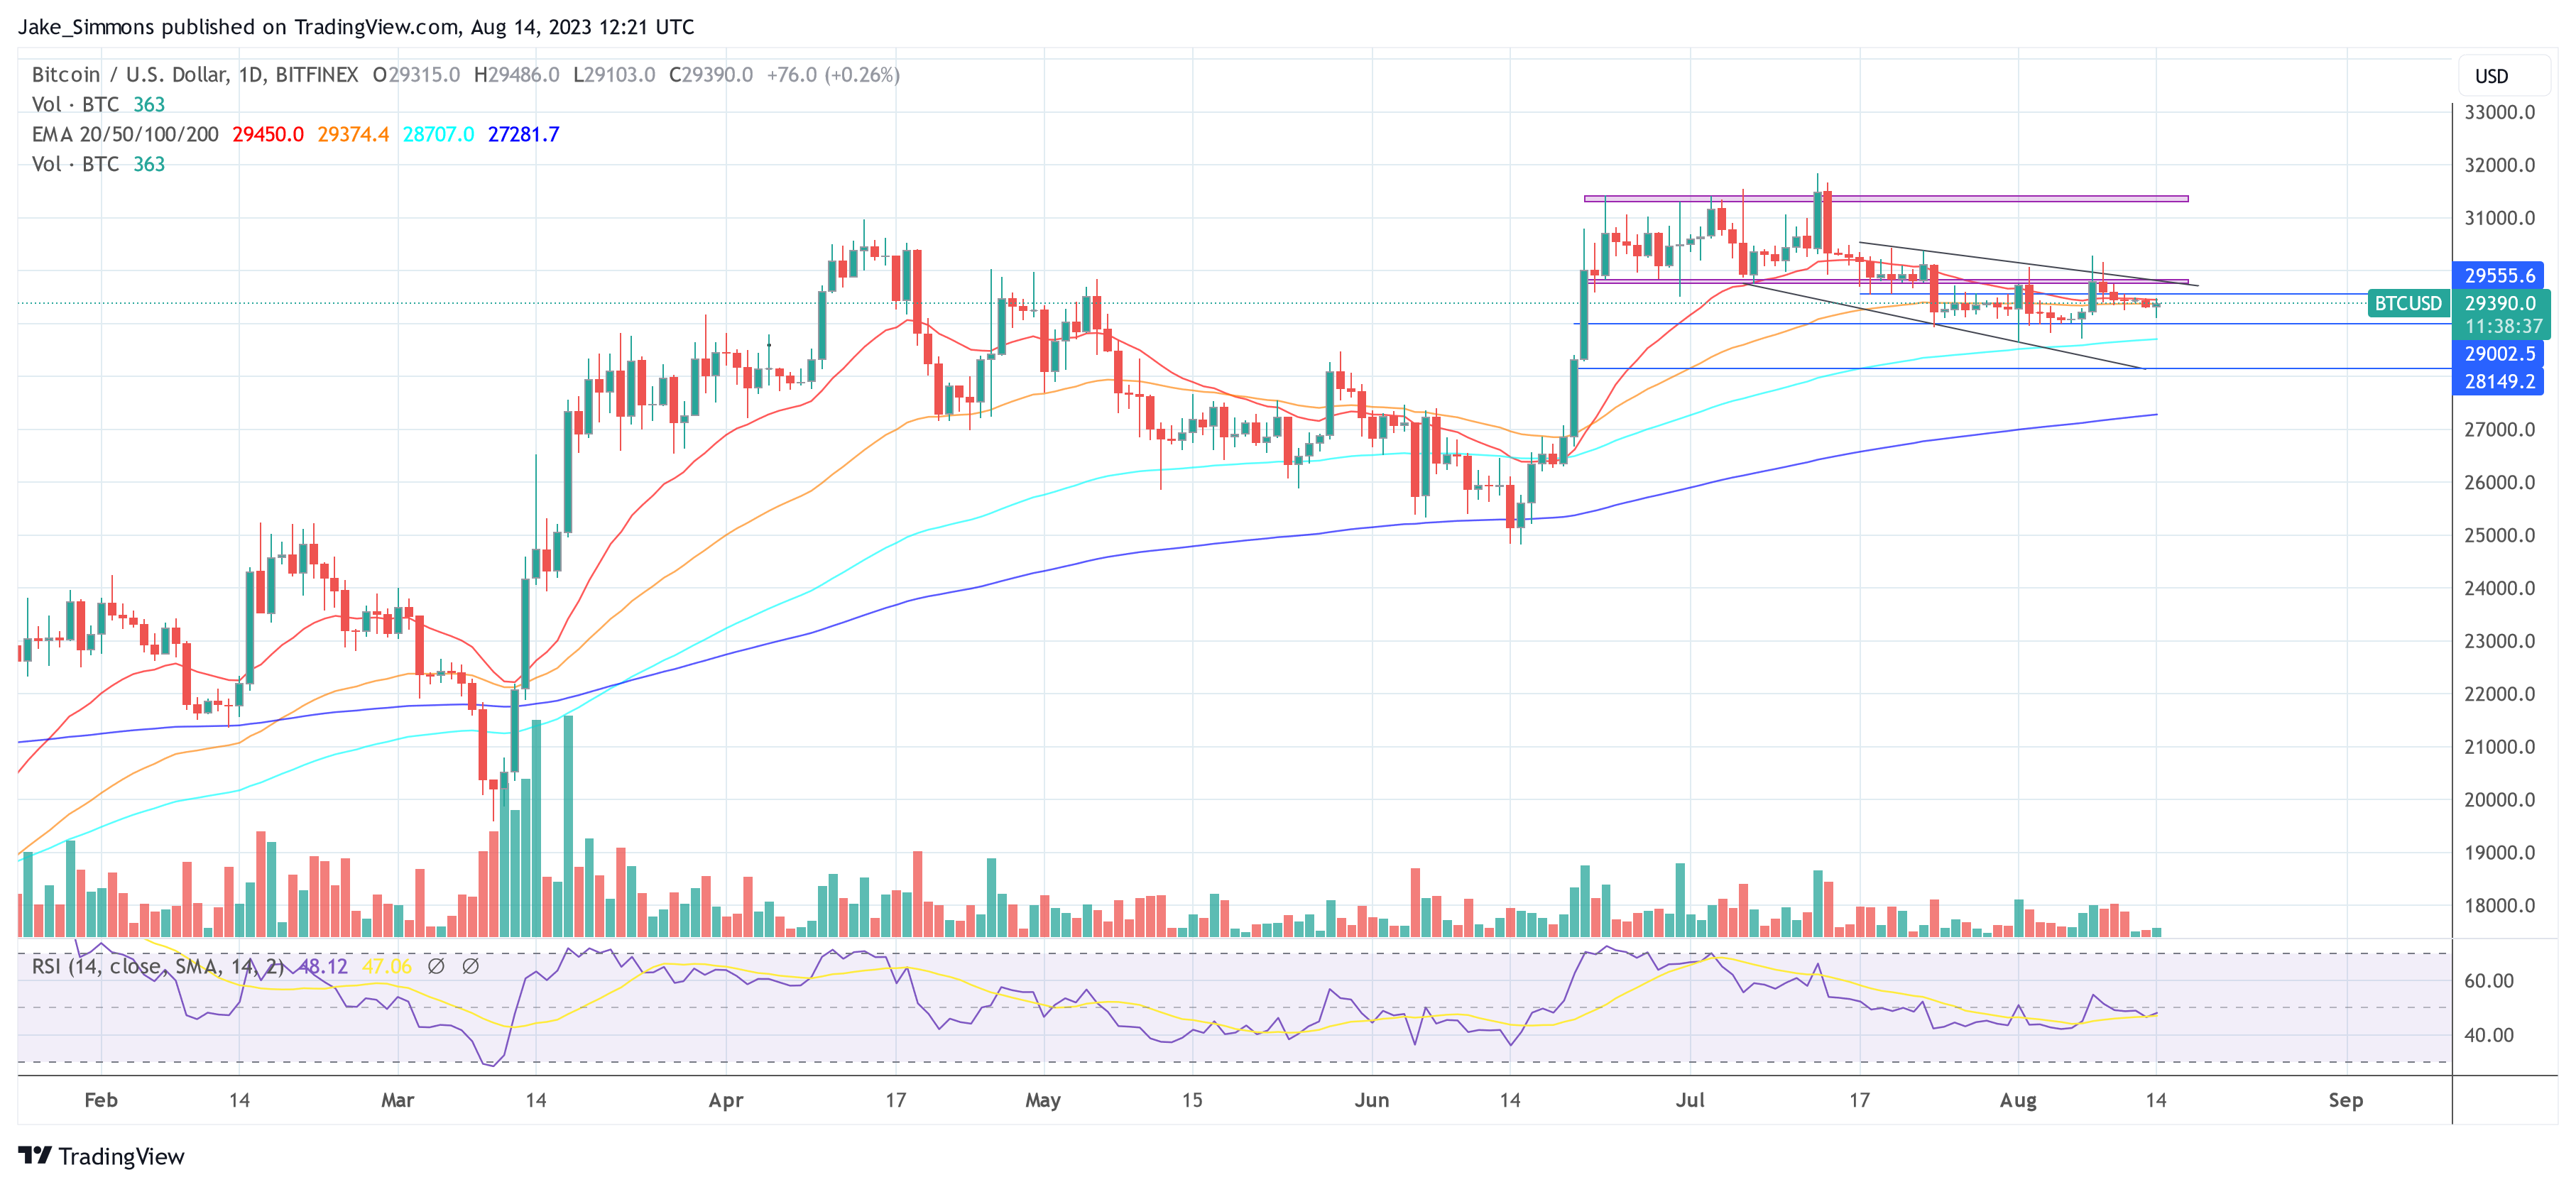
Bitcoin is down at press time, wiping the weekend’s gains and inching closer to $60,000. If bears press on, increasing their shorts, the odds of the coin sliding below the psychological number and $56,800 remain high.
Glassnode: STHs Are In Red
As the world’s most valuable coin finds itself at a critical juncture, fast approaching $60,000, on-chain data points to weakness at spot rates.
In a post on X, Glassnode, a blockchain analytics firm, highlighted how BTC finds itself in a unique situation.
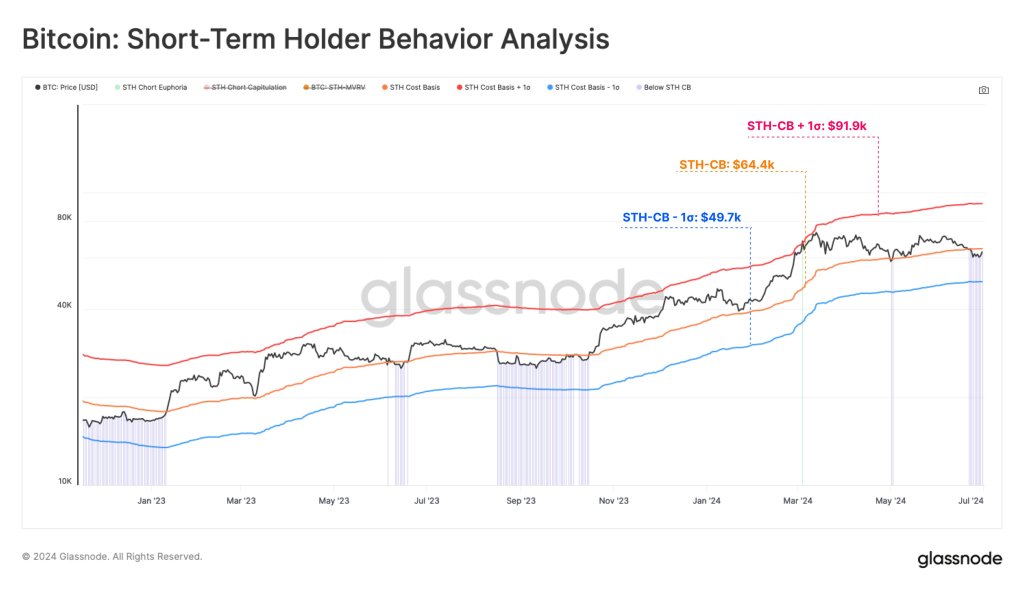
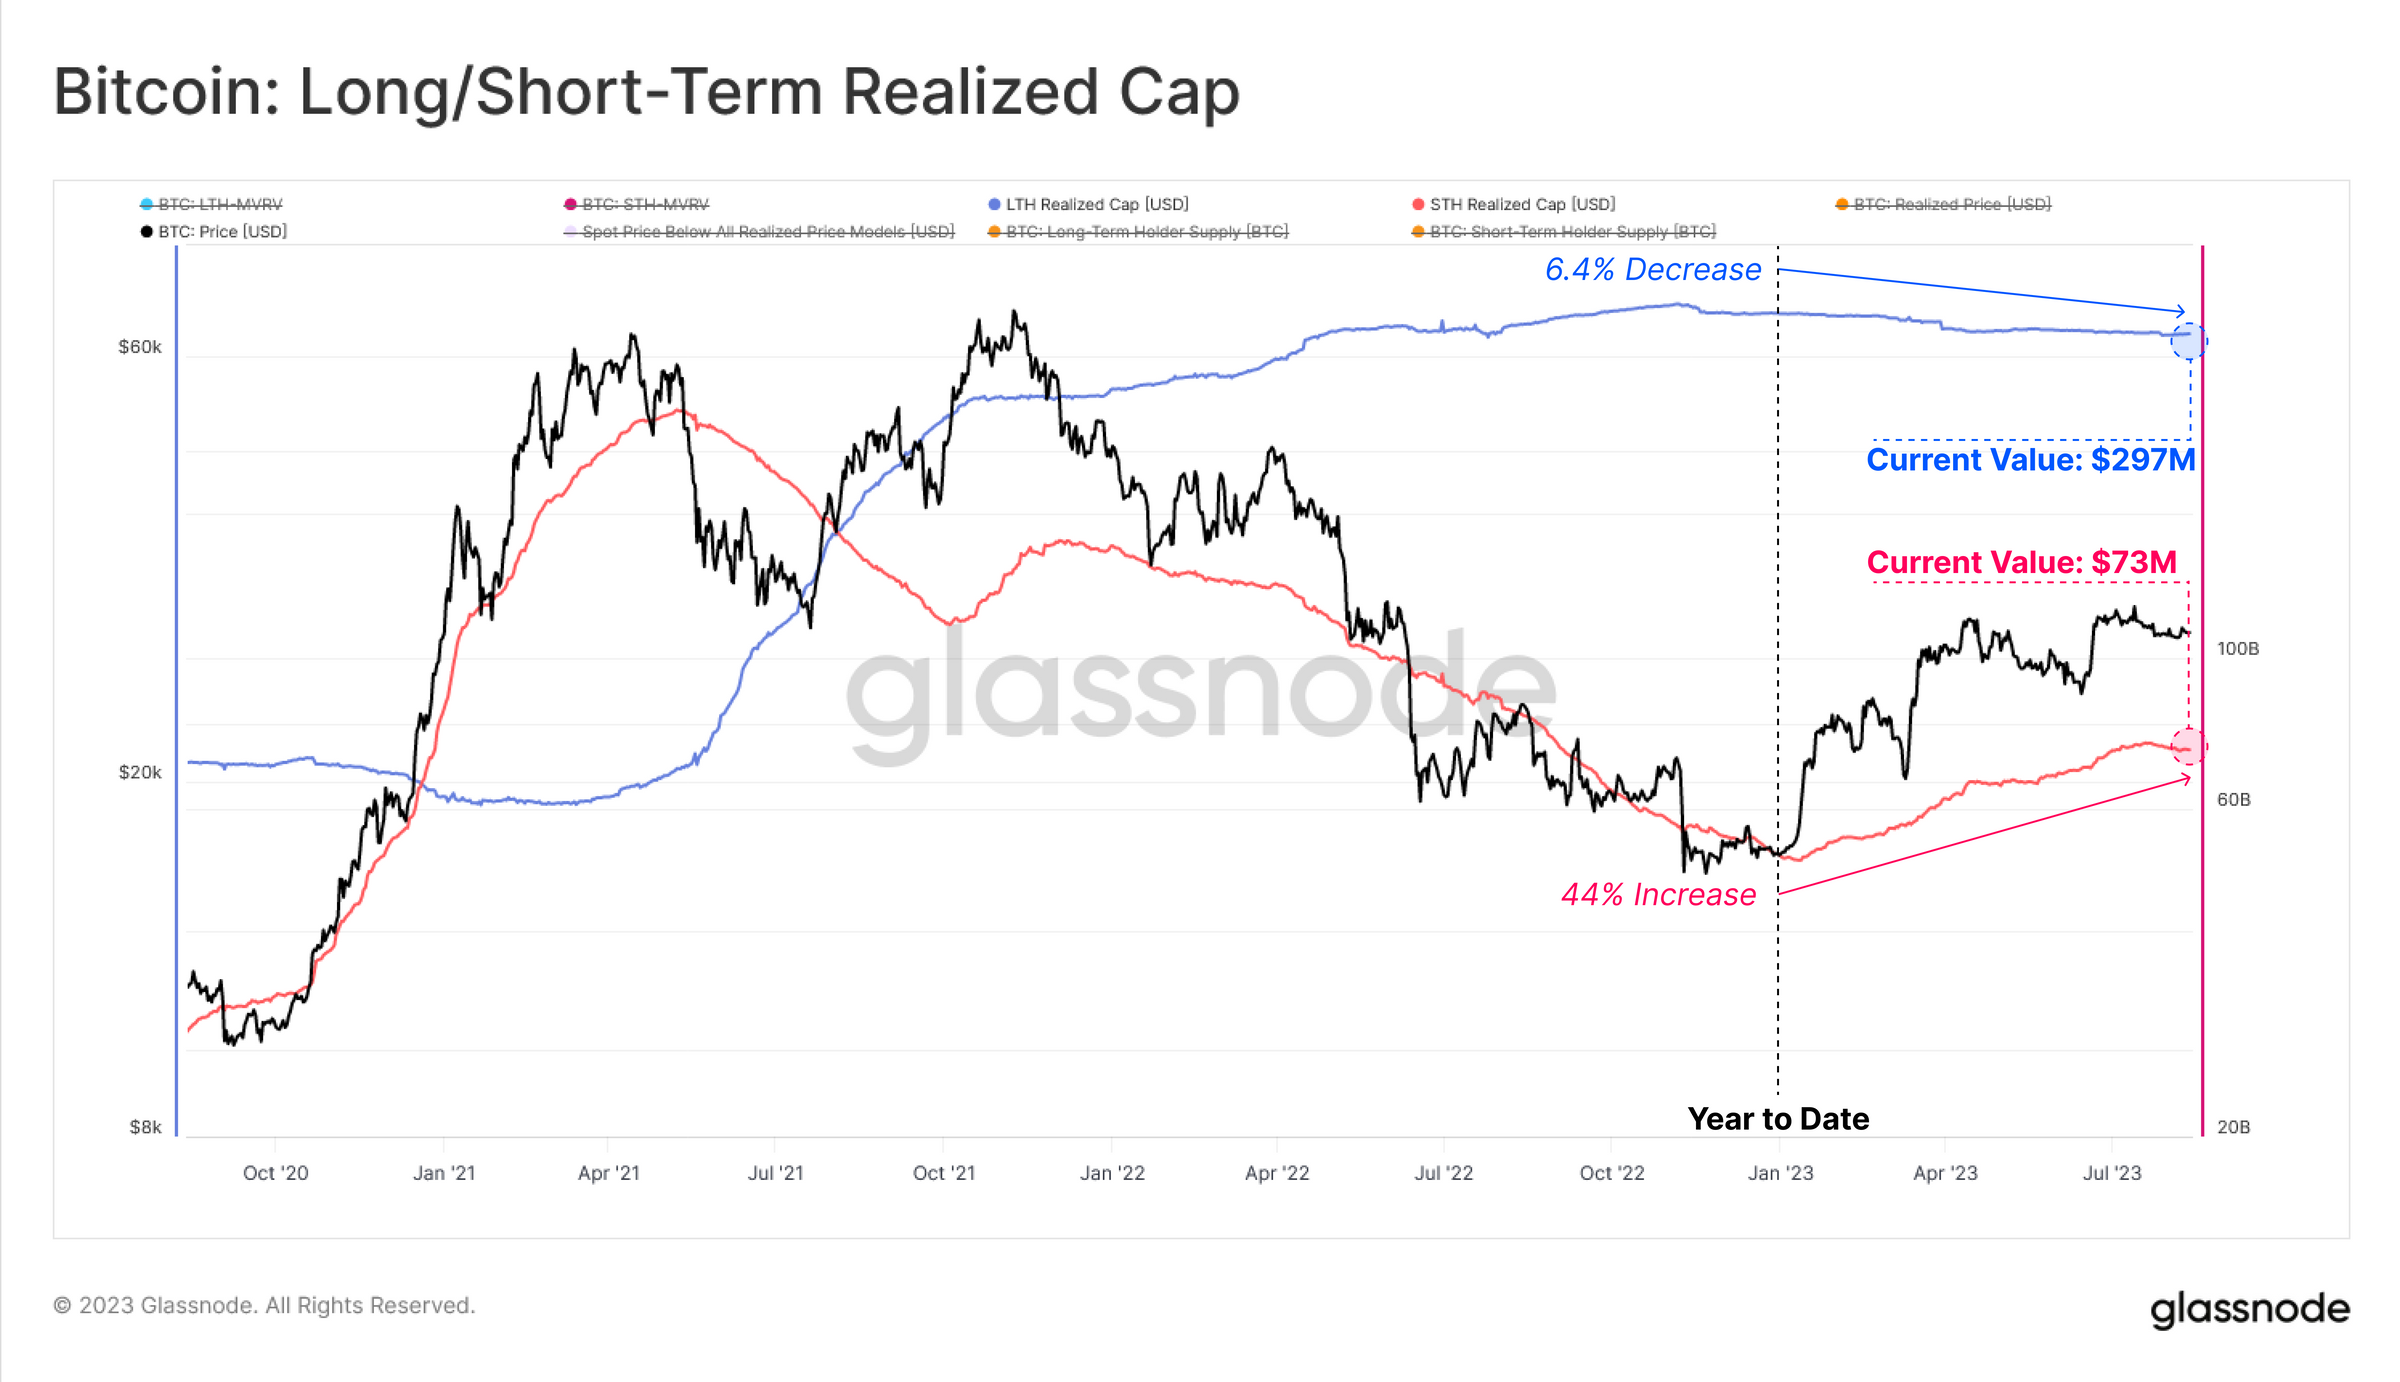
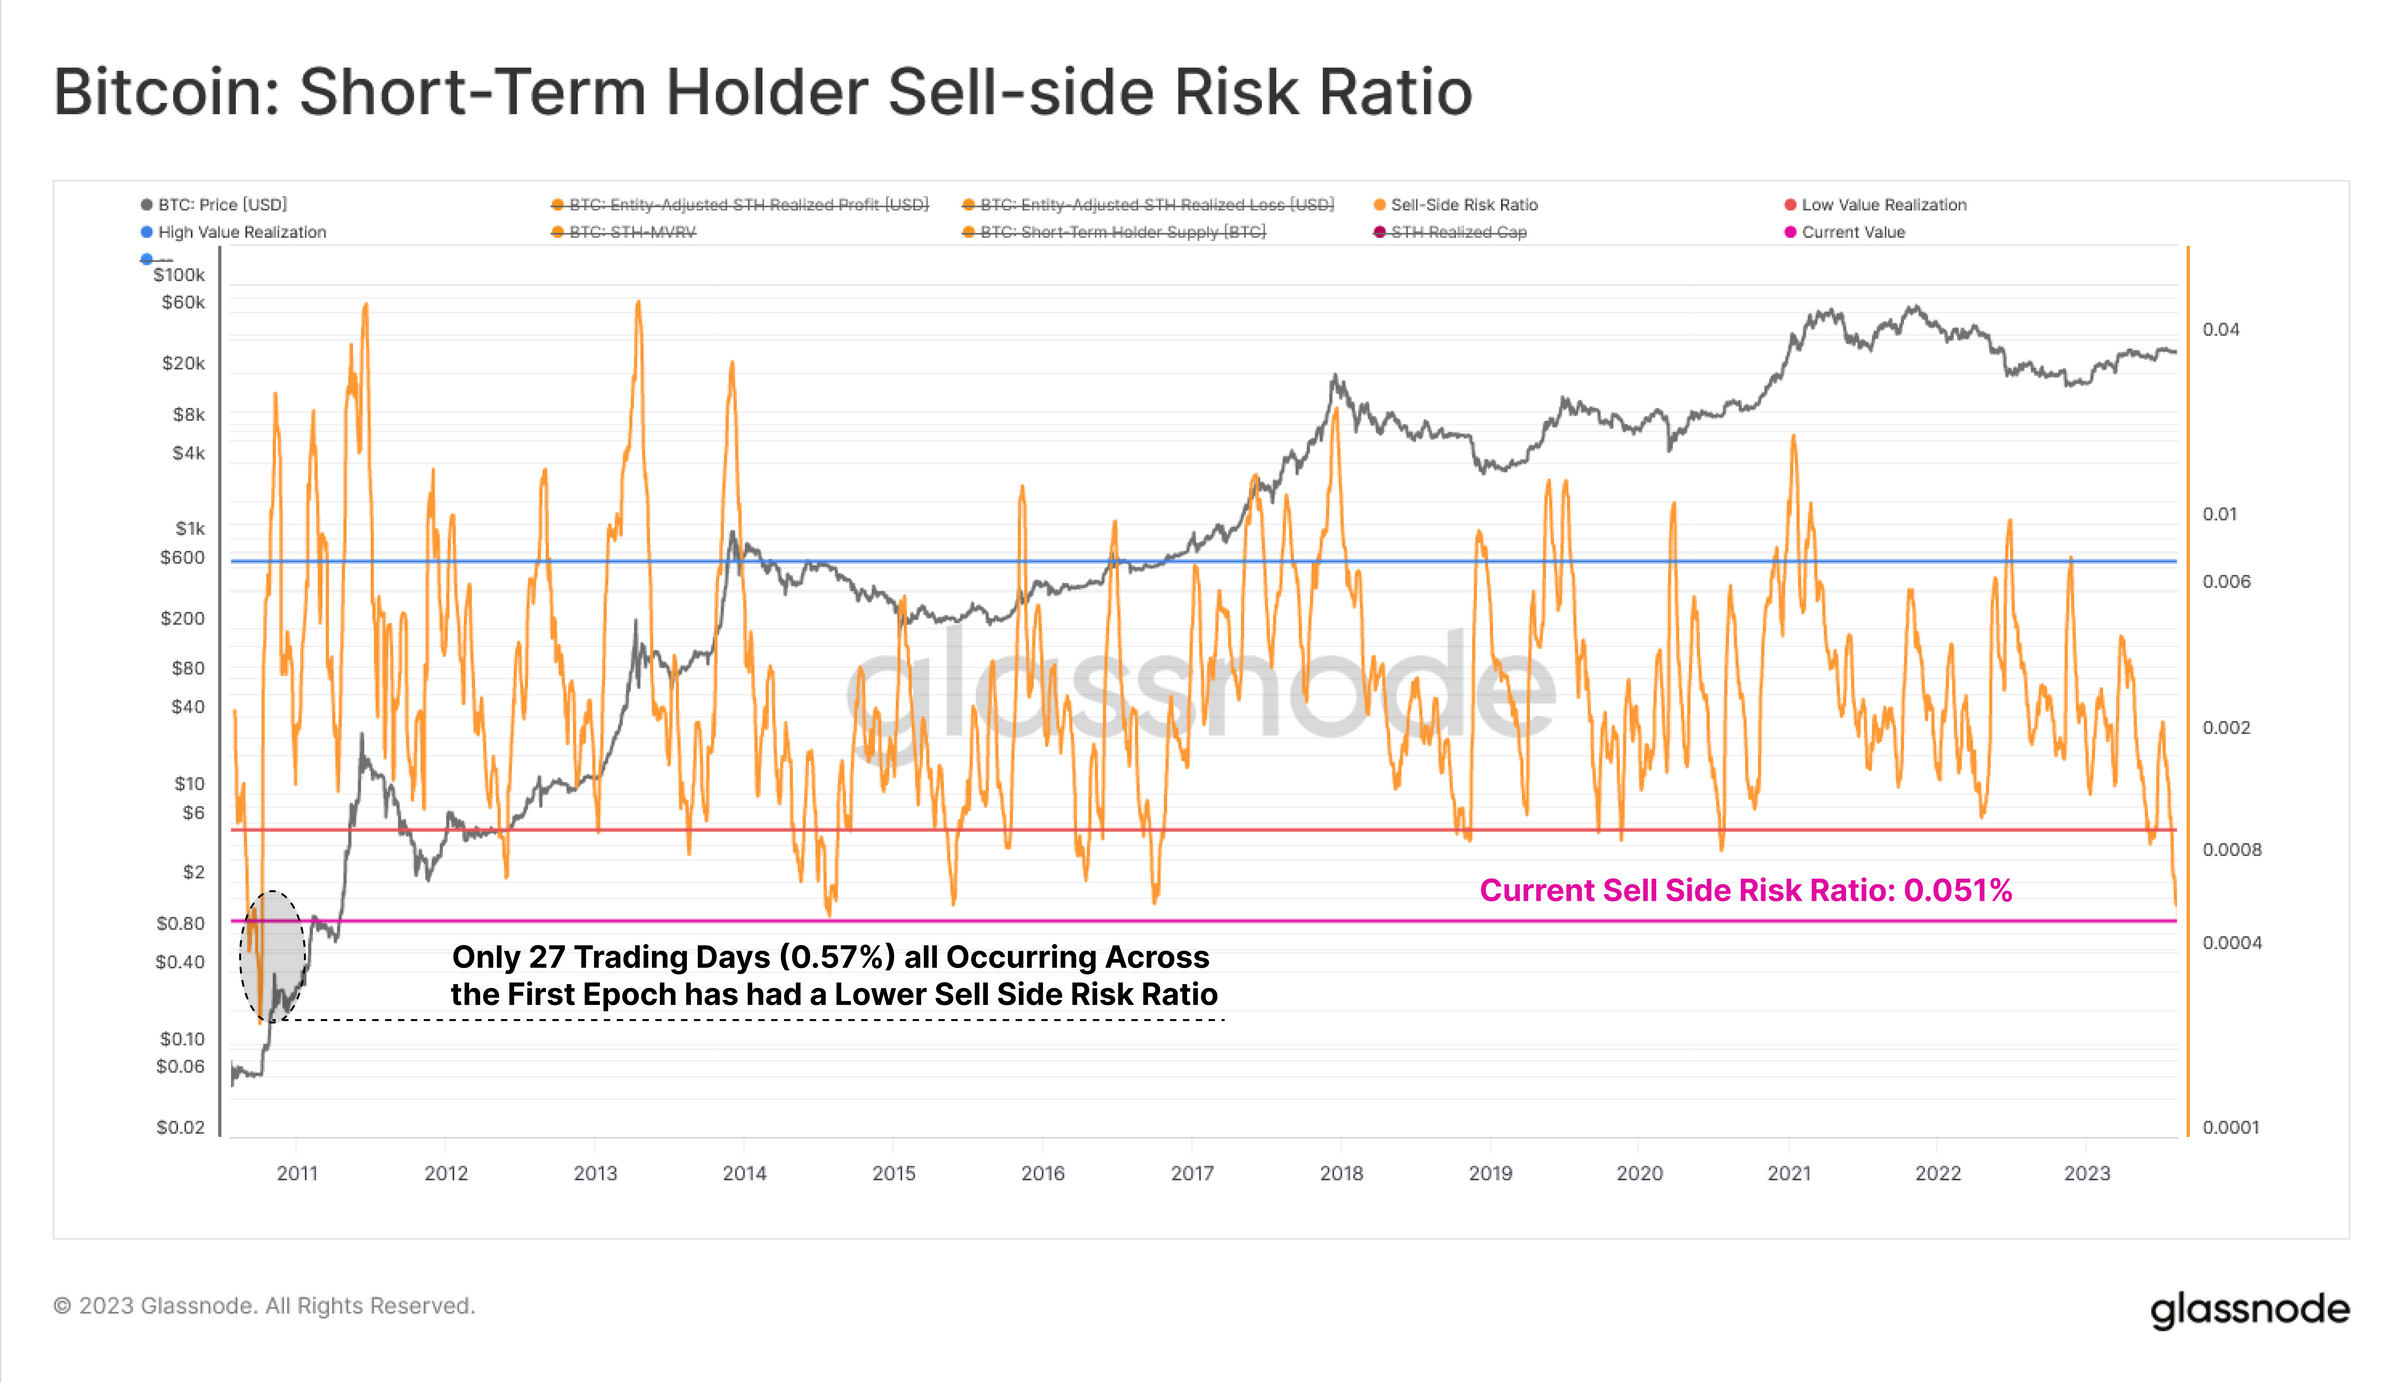
While Bitcoin is in green, rallying by over 100% over the last year, data shows that many short-term holders (STHs), primarily traders and speculators, are underwater. STHs are entities or addresses that bought their coins in the last 155 days or before the end of 2023.
During this time, not only did prices soar to an all-time high, meaning all coins were in circulation by mid-March 2024, but speculators were raving, expecting prices to continue soaring. However, this didn’t come to pass because no sooner had BTC breached $70,000, rising to $73,800, prices fell sharply.
By mid-May, BTC cratered to $56,800 before briefly bouncing to around $71,500. The failure of bulls to break $72,000, a level closely monitored by traders, means sellers have the upper hand at press time.
Glassnode’s assessment suggests that though STHs are feeling the pressure, only those who bought and HODL over the last year are in the money. With a 2X surge over the previous 12 months, BTC is technically in an uptrend, aligning with gains from the second half of 2023.
HODLers Are In The Money: Why Are BTC Whales Selling?
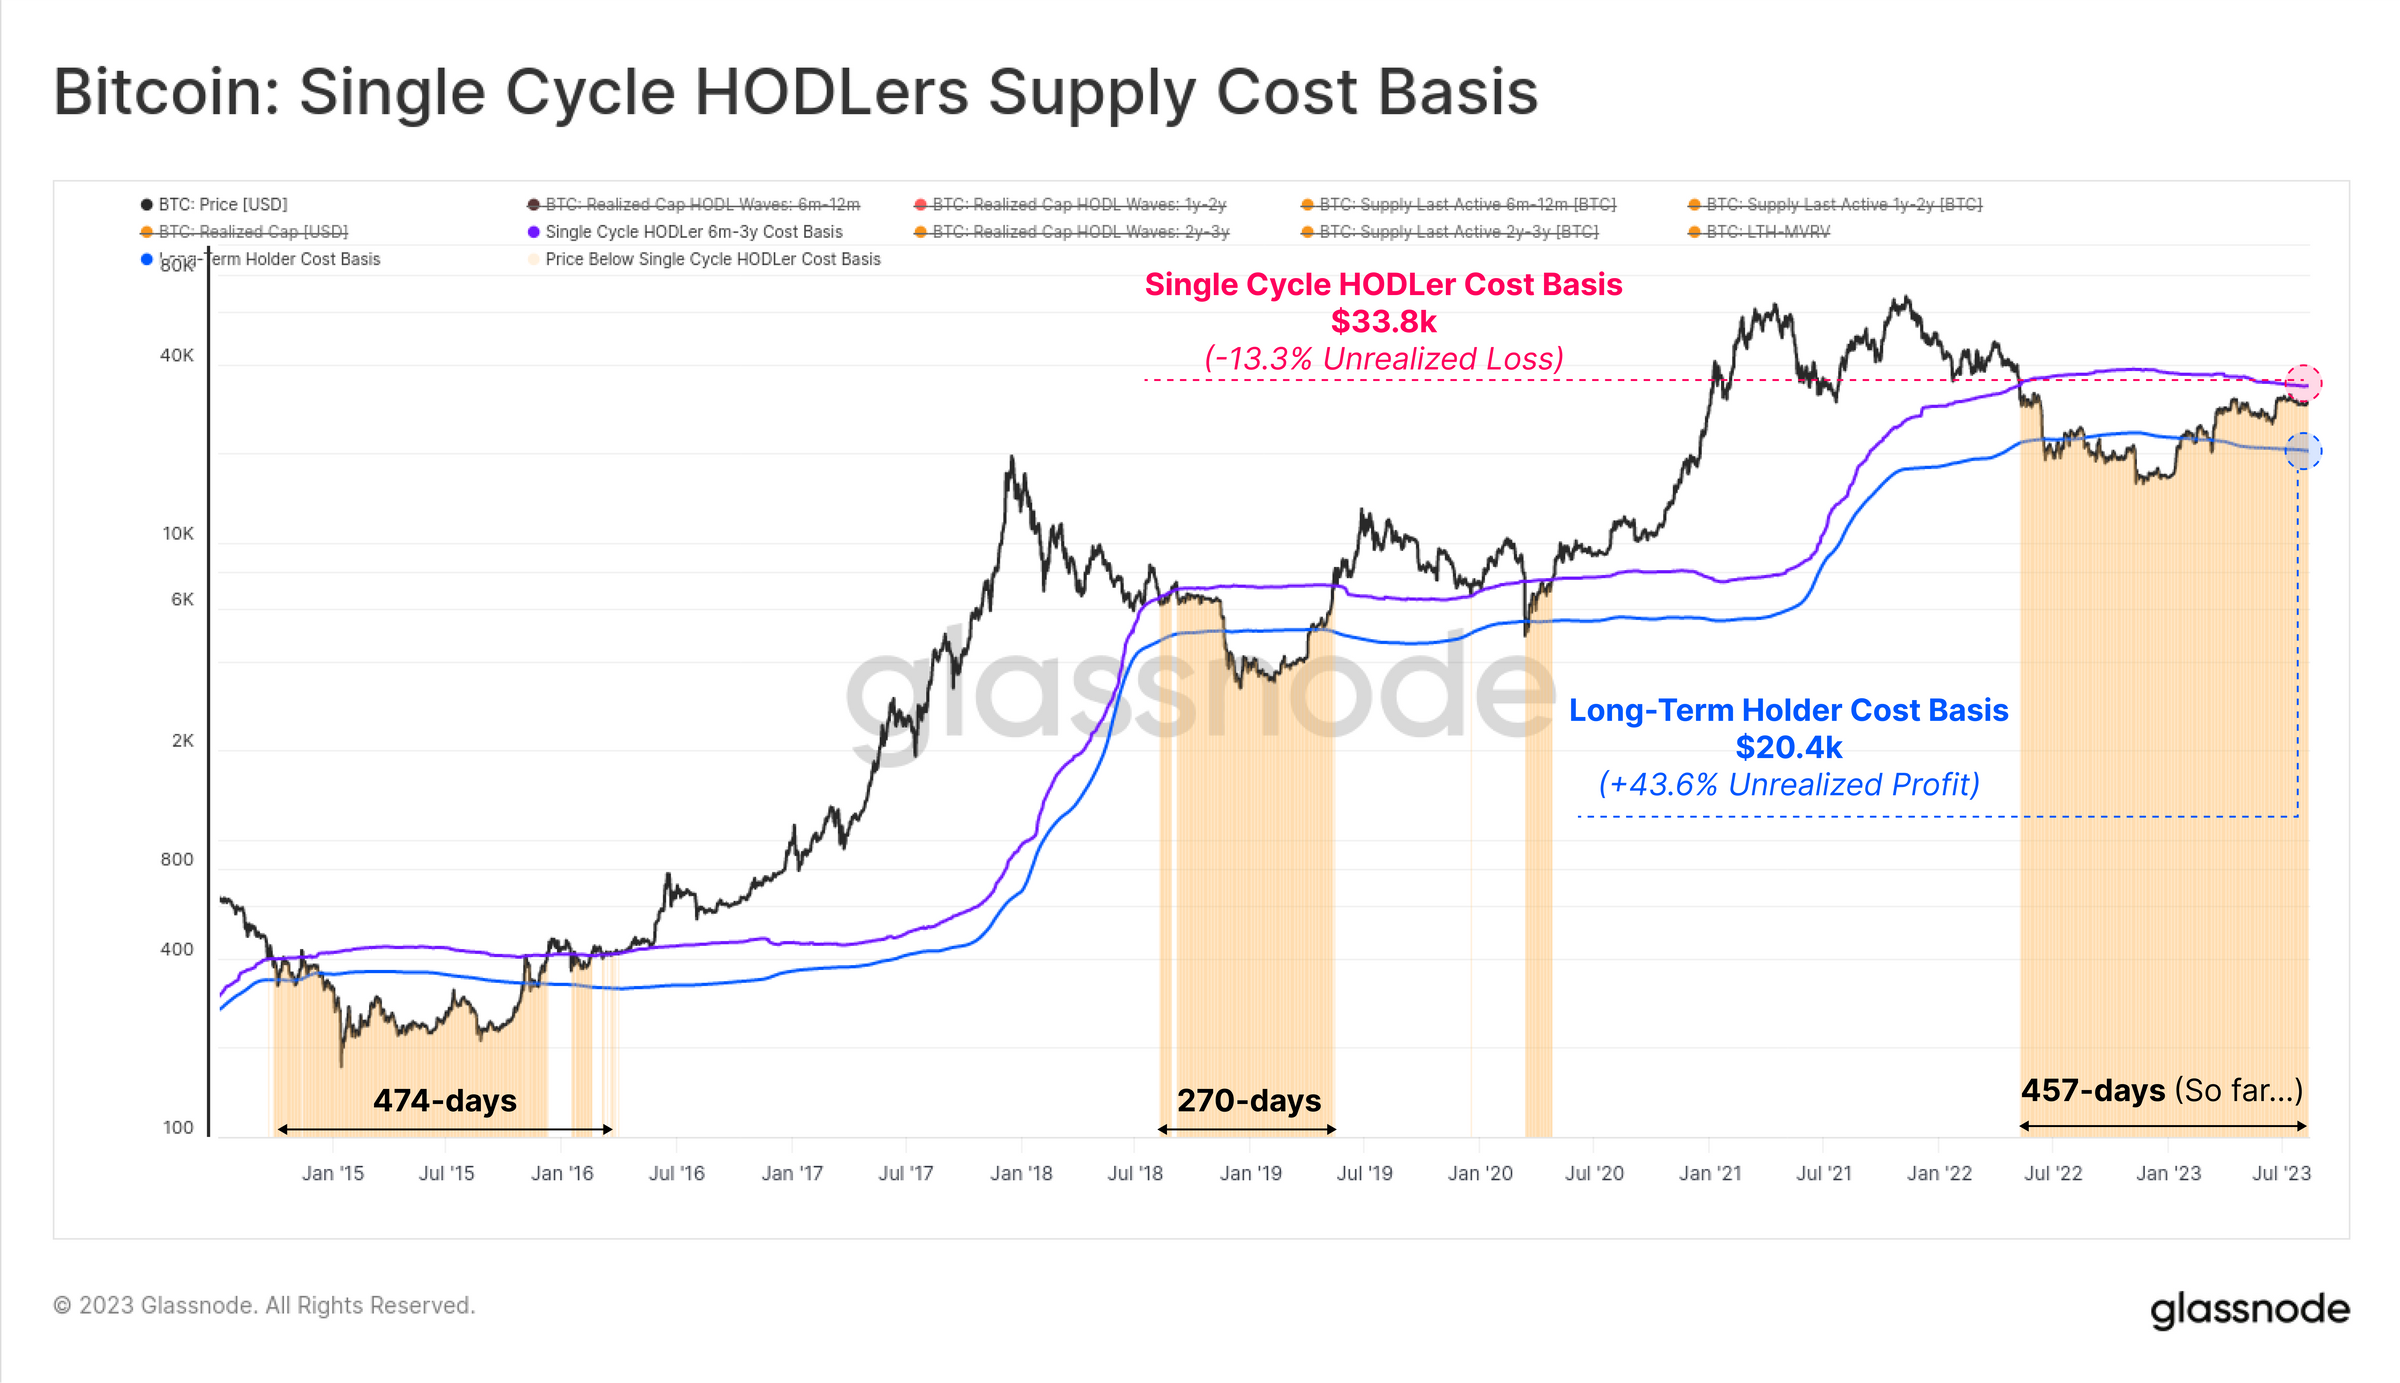
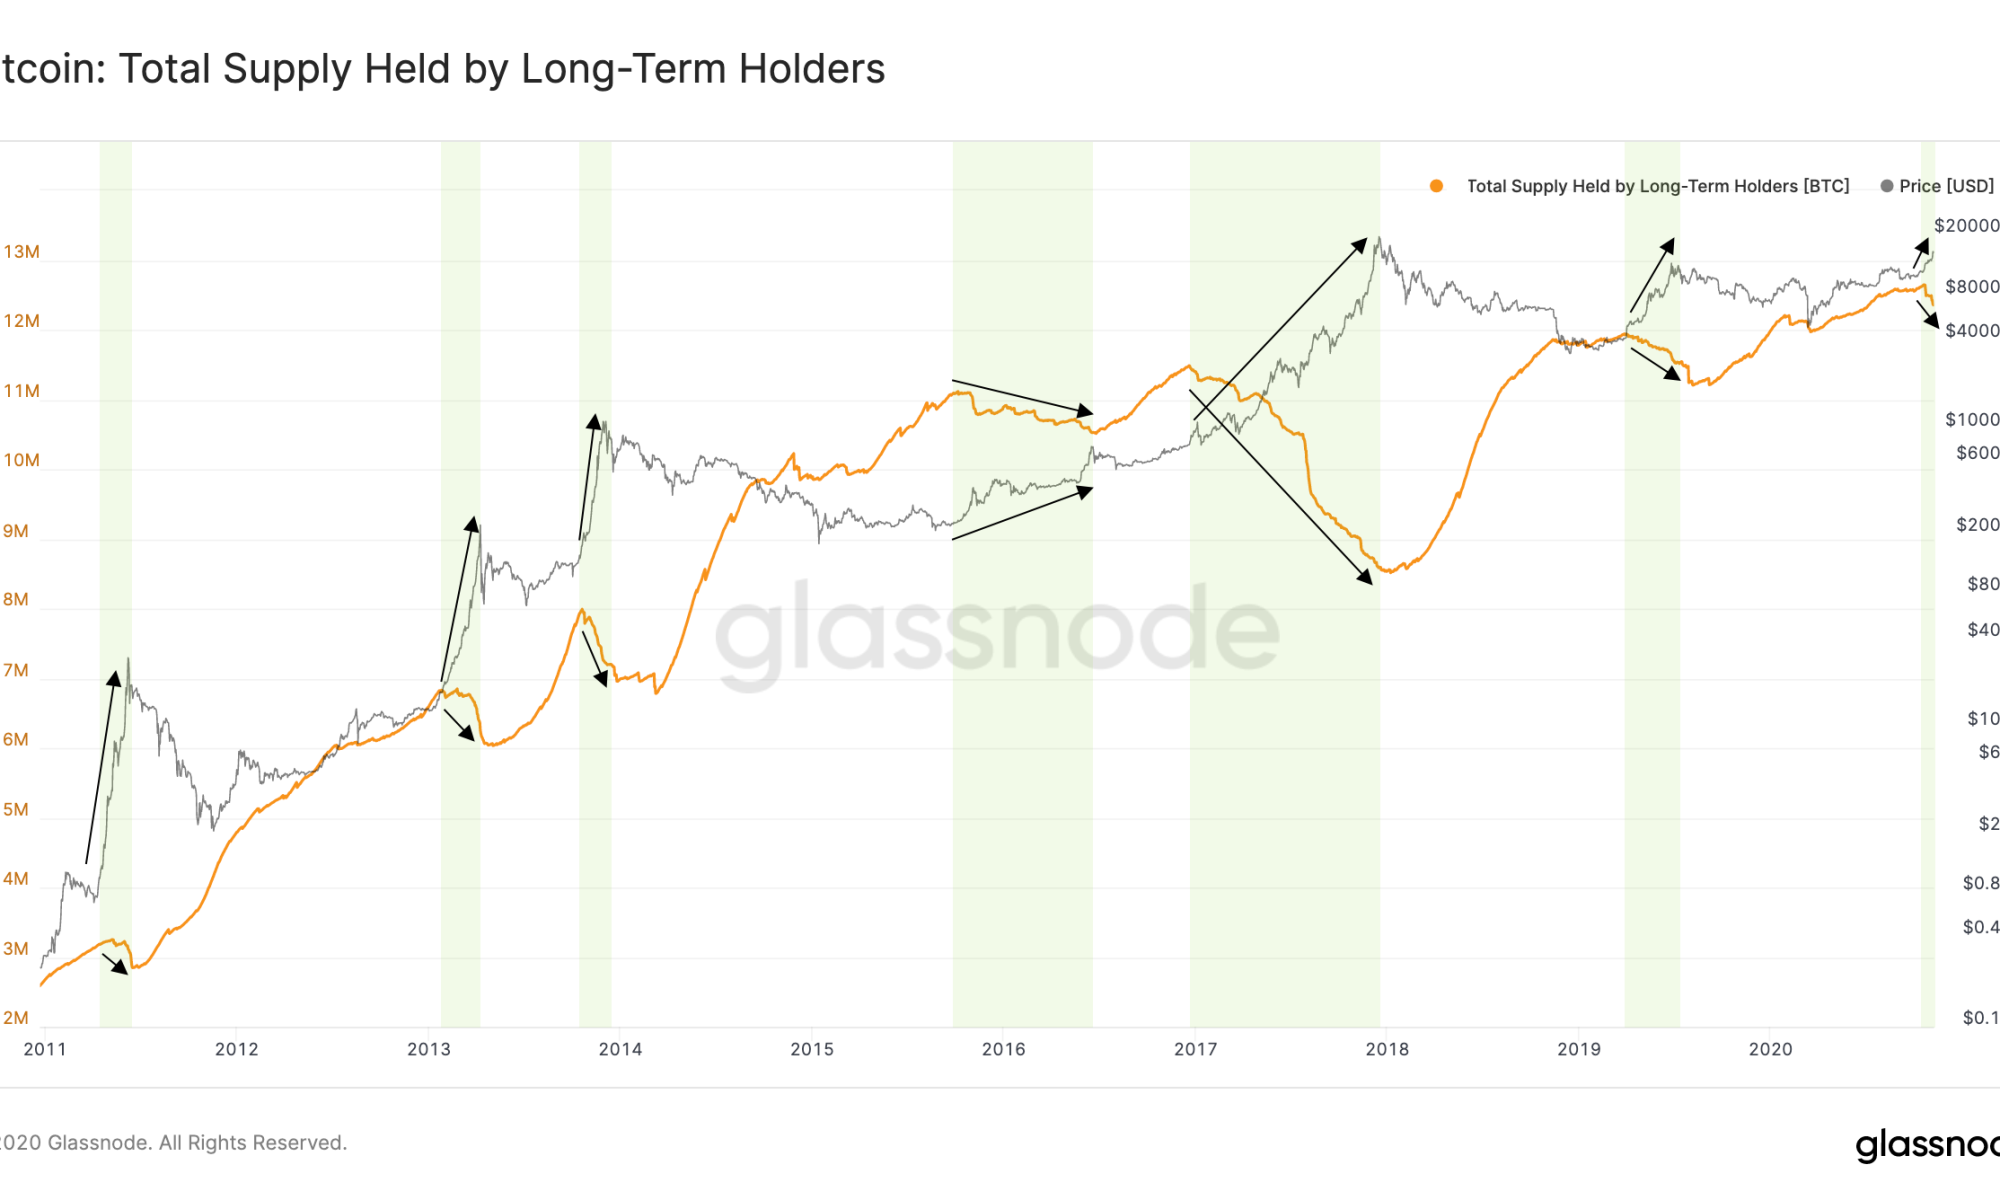
Other parallel data shows that long-term holders (LTHs), especially those who bought in the last five to seven years, enjoy a realized price of less than $7,300. This means that regardless of the current volatility, these HODLers are in the money and can wait for the current shake-out to end.
Amid this state of affairs, Lookonchain data shows that Bitcoin whales have been moving coins to Binance. Often, transfers to centralized exchanges are considered bearish. Therefore, the more coins sent, the more bearish the sentiment and the net negative it is on prices.

As of July 3, the analytics platform noted that one whale sent 1,023 BTC, worth roughly $62 million, to Binance. Earlier, another whale transferred 1,723 BTC, worth over $106 million, to the world’s largest crypto exchange.