
On-chain data shows Bitcoin miners could be dumping right now, a sign that could provide an impedance to the rally.
Bitcoin Miners’ Position Index Has Shot Up Recently
As pointed out by an analyst in a CryptoQuant post, miners may be putting selling pressure on the market currently. The relevant indicator here is the “Miners’ Position Index” (MPI), which measures the ratio between the miner outflows and the 365-day moving average of the same.
The “miner outflows” refer to the total amount of Bitcoin that all these chain validators are transferring out of their wallets at the moment. Usually, miners withdraw coins from their reserves with the main purpose of selling them. Thus, a high value of the outflows can suggest that this cohort is dumping large amounts right now.
As the MPI compares these outflows with their yearly average, the metric’s value can tell us how the current miner selling is compared with the mean for the last 365 days.
When this indicator has a high value, it means miners are selling at a higher degree than usual currently, while the metric having a low value could suggest there is lesser selling pressure coming from these chain validators than the average for the past year.
Now, here is a chart that shows the trend in the Bitcoin MPI over the past year and a half:
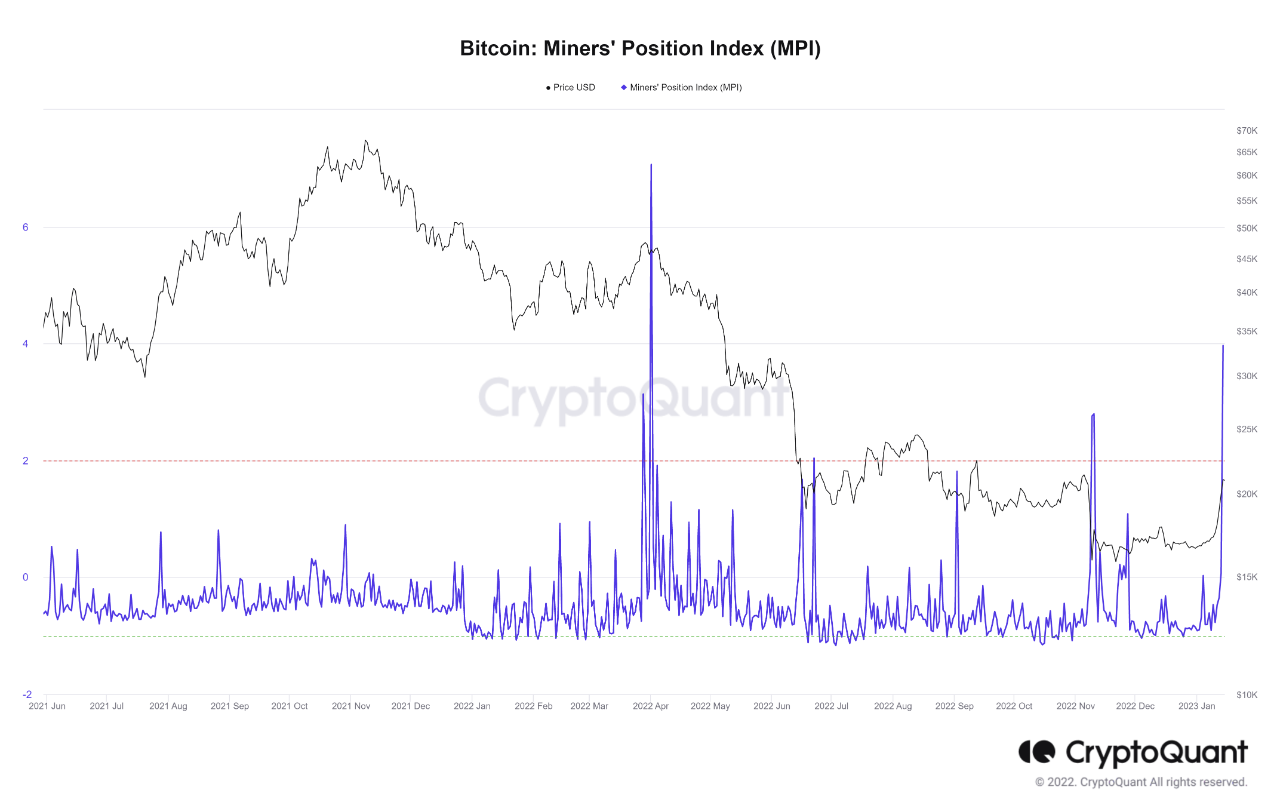
As shown in the above graph, the Bitcoin MPI has spiked up recently and has hit a value of about 4, the highest level that the indicator has observed since April of last year. The metric having such a large value would suggest miners are taking out way more coins than usual, and are therefore potentially putting extraordinary selling pressure on the market currently.
From the chart, it’s apparent that spikes in the metric have usually been followed by declines in the price of the crypto. The most extreme example was back in April 2022, when the price saw a very sharp drawdown not too long after the metric recorded even higher values than now.
The last time the indicator observed high values were back during the collapse of the crypto exchange FTX when the price once again saw a rapid downward move.
Bitcoin has been busy rallying during the past week or so, touching as high as $21,000 so far, so these increased withdrawals right now would suggest miners want to take advantage of this profit-taking opportunity while they still can, and dump their coins.
If this cohort indeed intends to sell with these transfers, then the crypto’s rally could possibly find some impedance and temporarily halt here, if not outright reverse its direction.
BTC Price
At the time of writing, Bitcoin is trading around $20,800, up 20% in the last week.


