Bitcoin Rally Lacks On-Chain Support – Analyst Warns Of Vanishing Network Activity

Bitcoin has reclaimed the $90,000 mark, fueling renewed optimism across the crypto market. With sentiment shifting and bullish calls returning, many investors are once again eyeing a move toward six figures. However, not everything is as it seems beneath the surface. Despite the impressive price surge, risks remain, particularly as global tensions between the United States and China escalate. The ongoing trade war and geopolitical friction are injecting volatility into markets, creating a fragile backdrop for risk assets like Bitcoin.

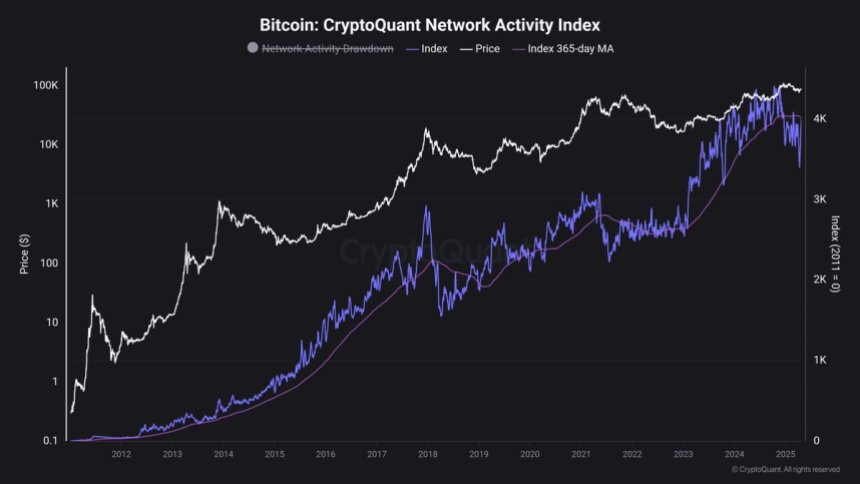
Top analyst Maartunn shared a stark view of the current state of the Bitcoin network, revealing on-chain metrics that paint a different picture. According to his analysis, the latest move higher is primarily driven by leverage and derivatives rather than strong organic demand. He noted that the Bitcoin network is, in his words, “a ghost town,” with very little new activity or visible inflows from real users.

This disconnect between price and on-chain fundamentals suggests that the current rally may lack sustainability. As such, investors should approach the next phase of Bitcoin’s price action with caution, especially if macroeconomic conditions worsen or derivative positions begin to unwind.

Bitcoin Faces Resistance: On-Chain Activity Lags Behind

Bitcoin is now facing critical resistance as bulls attempt to reclaim the $95,000 level, a zone that could define short-term momentum. The recent breakout above the $88,600 resistance marked a key shift in market sentiment, with bulls taking control and pushing price action into a new range. However, to maintain this momentum, sustained demand will be essential. Analysts warn that a healthy retracement may occur before the next leg up, especially considering current market conditions.

Volatility and uncertainty continue to dominate the landscape, with fear still lingering despite the recent rally. Much of this caution stems from ongoing global tensions and the unstable macro environment that has unfolded since US President Donald Trump’s re-election in November 2024. With tariffs rising and trade negotiations with China growing increasingly tense, investors remain hesitant to commit fully to risk assets.

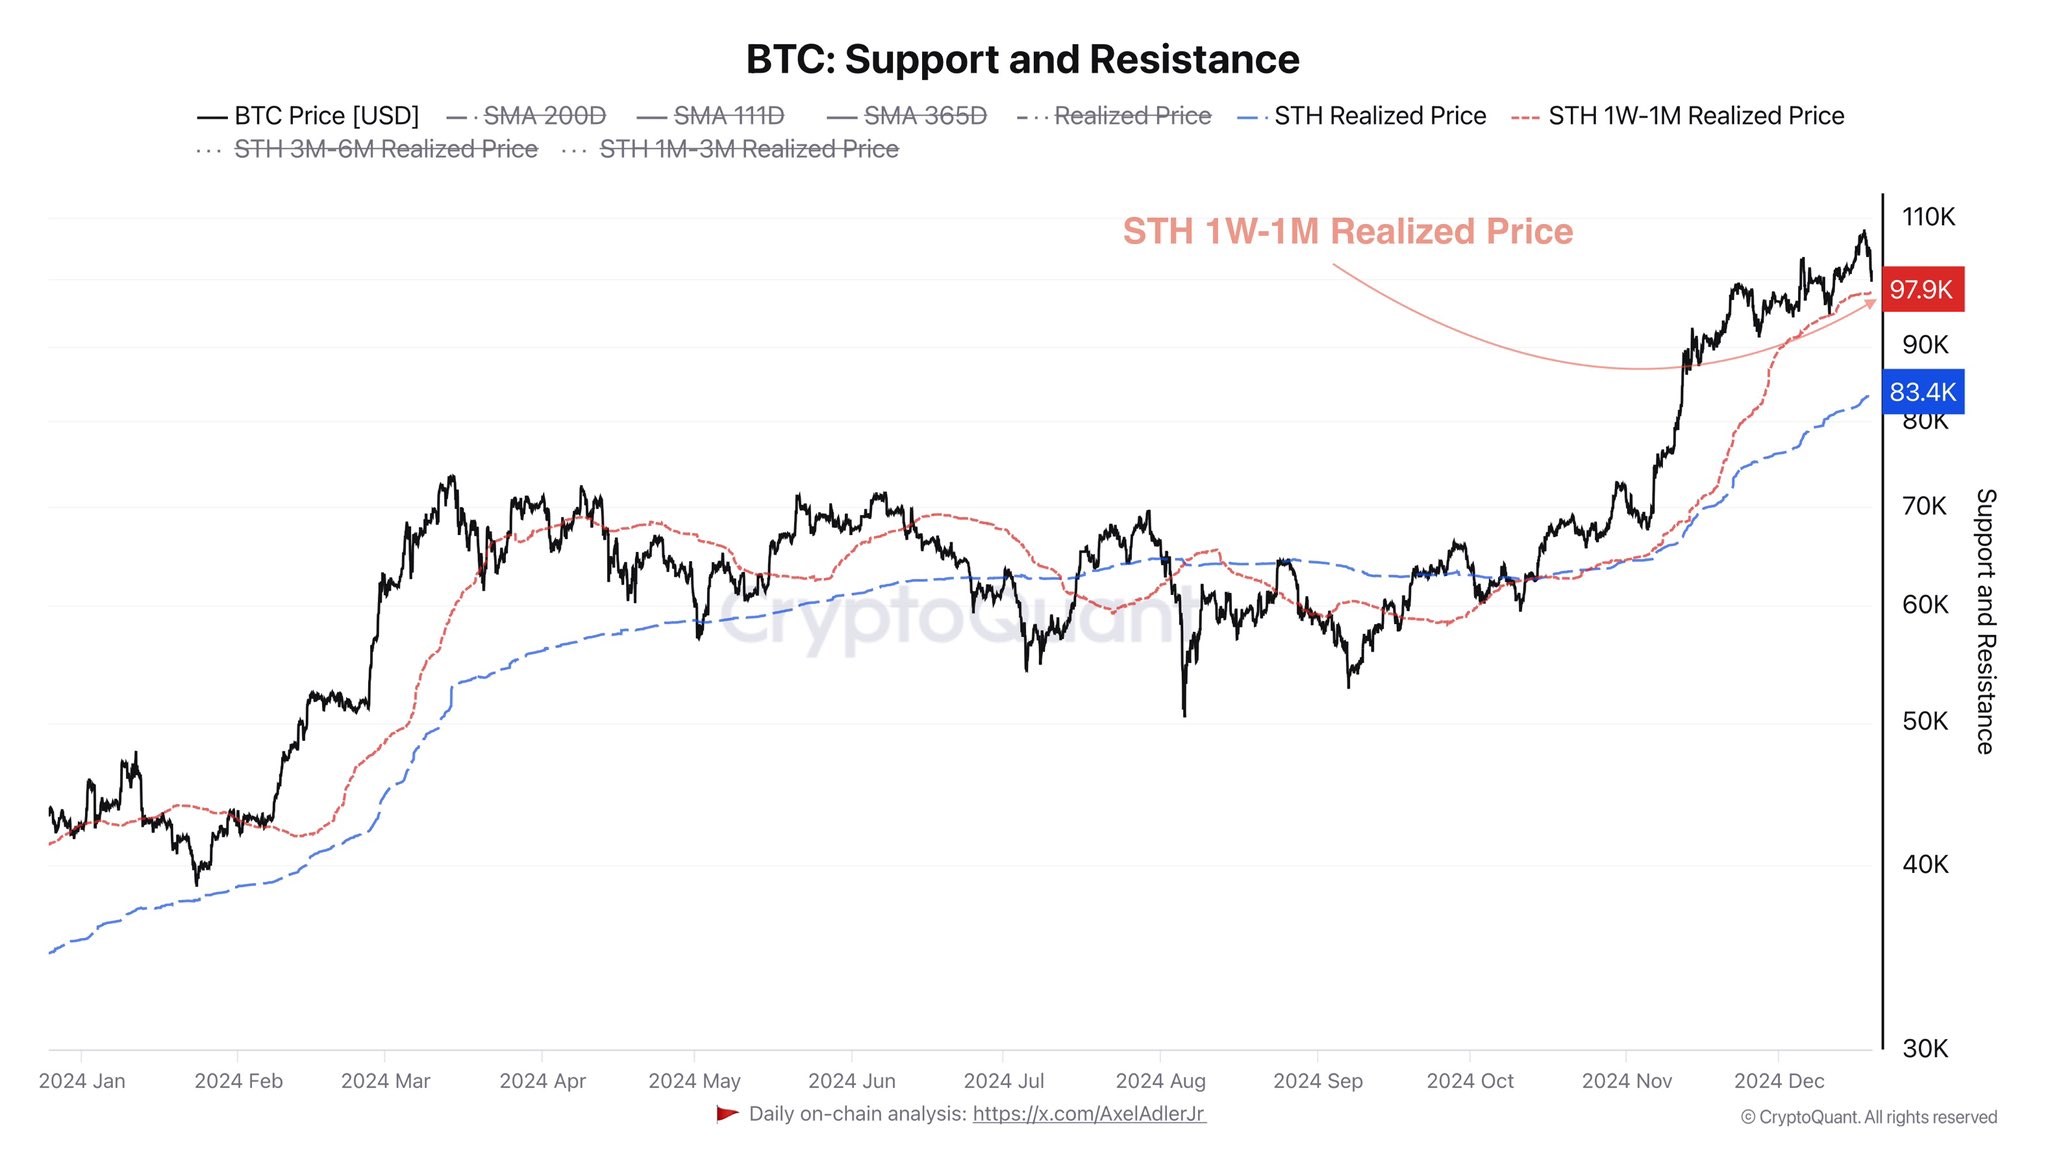
Top analyst Maartunn shared a sobering on-chain analysis on X, highlighting a disconnect between Bitcoin’s price action and network activity. According to his findings, the recent surge is largely driven by ETF flows and rising open interest in the derivatives market—factors that often precede a reversal rather than a sustainable rally. Maartunn describes the current state of the Bitcoin network as a “ghost-town,” noting a lack of new visible on-chain demand.

Bitcoin Network Activity Index | Source: Maartunn on X

This divergence between price and network fundamentals raises questions about the sustainability of the current move. For Bitcoin to push convincingly past $95K and set up a run toward $100K, stronger spot demand and an uptick in real user activity will likely be necessary. Until then, traders should remain cautious and watch key support levels closely.

Price Action Details: $95K In Sight

Bitcoin is trading at $93,600 after several days of bullish price action that saw it reclaim key resistance levels. The price has now entered a consolidation phase around the $93K level, as bulls prepare for a potential breakout toward $95K. A sustained move above that mark would open the door for a push toward the highly anticipated $100K milestone, signaling renewed strength across the crypto market.

BTC testing supply levels | Source: BTCUSDT chart on TradingView

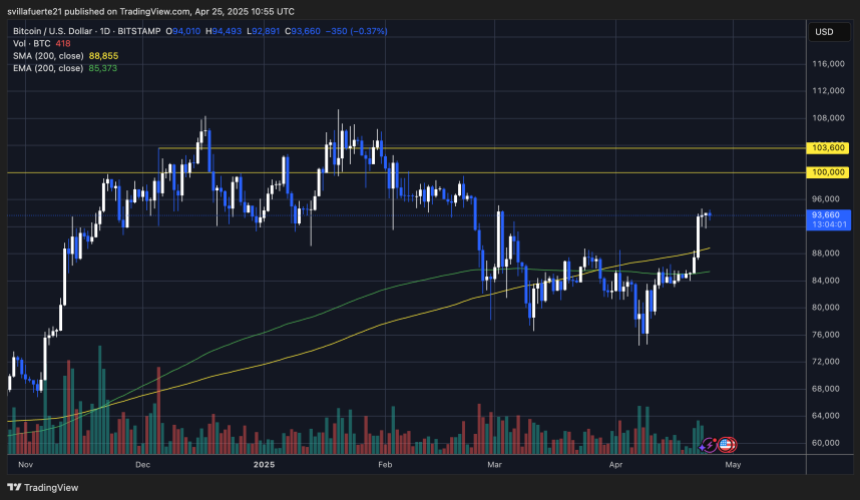
However, the path forward remains uncertain. While short-term sentiment appears optimistic, Bitcoin must hold above the $90K support level to maintain bullish structure. A failure to do so could trigger a drop back toward the 200-day moving average near $88K—a level that has served as a key pivot for market structure over the past months.

This zone is being closely watched by both traders and long-term holders, as a breakdown below $90K would likely undermine the current recovery momentum. As consolidation continues, the next few sessions will be critical in determining whether BTC has enough strength to break higher or if a short-term correction is in store. For now, all eyes are on $95K as the next hurdle in Bitcoin’s push to reclaim market dominance.

Featured image from Dall-E, chart from TradingView

Bitcoin Crashes: Here’s Where The Nearest On-Chain Support Is

Bitcoin has observed a plunge during the past day. Here’s the nearest on-chain level that the asset would end up retesting if the drawdown elongates.

1 Week To 1 Month Bitcoin Holders Have Their Realized Price At $97,900

As pointed out by CryptoQuant author Axel Adler Jr in a new post on X, the Realized Price of the 1-week to 1-month-old BTC investors is the closest support for the asset right now.

The “Realized Price” here refers to an on-chain indicator that, in short, keeps track of the cost basis or acquisition price of the average holder on the Bitcoin network.

When the metric’s value is lower than the spot price of the cryptocurrency, it means the investors as a whole can be considered to be holding a net amount of profit. On the other hand, it being under the BTC value suggests the dominance of loss in the market.

In the context of the current topic, the Realized Price of only a particular segment of the sector is of interest: the 1-week to 1-month-old holders. This cohort includes the addresses that have been holding their coins for at least one week and, at most, one month.

Now, here is the chart shared by the analyst that shows how the Realized Price of this Bitcoin group has changed over the past year:

Bitcoin STH Realized Price

As displayed in the above graph, the Realized Price of the 1-week to 1-month-old Bitcoin investors has been climbing up alongside the price rally. This is naturally due to the fact that the cohort’s cost basis has been getting repriced to higher levels as new investors have been purchasing at the rally highs.

Currently, the indicator’s value sits at $97,900, so these investors would be in profit at the current price. Earlier in the past day, however, the asset came dangerously close to retesting the level as its price saw a brief dip below $99,000.

The 1 week to 1 month old investors make up a section of a larger cohort known as the short-term holders (STHs). The STHs are broadly defined as the holders who bought their coins within the past 155 days.

Statistically, the longer an investor holds onto their coins, the less likely they become to sell. So, the STHs, and especially the 1-week to 1-month-old segment, would contain the holders with the least amount of resolve in the sector, owing to their low holding time.

Because of how fickle they are, the STHs generally show some kind of reaction whenever their average cost basis gets retested by the Bitcoin price. This reaction may come in the form of buying when the retest occurs from above, as these holders could believe the decline to be just a ‘dip.’

As such, the Realized Price of the 1-week to 1-month-old STHs, which is below the current price, could be looked at as a support level for the cryptocurrency. The level has also already helped the asset out once this month.

So far, Bitcoin has been making a recovery from the plummet, but should the bearish momentum return, the retest of the line may be to watch for, considering the past pattern.

BTC Price

At the time of writing, Bitcoin is trading at around $102,200, down almost 3% in the last 24 hours.

Bitcoin Price Chart

Bitcoin Slips Under $64,000: Here’s Where The Next Support Is

Bitcoin has continued its recent bearish trajectory during the past day as the asset’s price has now slipped under $64,000. Here’s what the next support looks like for BTC.

Bitcoin Has Strong On-Chain Support Between $61,900 & $63,800

According to data from the market intelligence platform IntoTheBlock, BTC is floating just above a critical on-chain demand zone. Demand zones refer to price ranges where many investors last bought their coins.

These ranges can be determined through on-chain analysis, as the average cost basis of each address on the network can be readily calculated through its transaction history.

Below is the chart shared by the analytics firm that shows the various price ranges near the current asset price in terms of the present demand.

Bitcoin Support

In the graph, the size of the dot corresponds to the number of addresses bought inside the respective range. It appears that Bitcoin currently has large demand zones both just above and below itself.

According to IntoTheBlock data, the lower range currently holds the cost basis of around 1.23 million addresses for investors who bought 319,700 BTC. Now, what’s the relevance of a demand zone like this?

To any investor, their cost basis is important, so when the price tests it, they may become more prone to making some move. Naturally, if many holders share their break-even level inside a narrow range, the reaction resulting from a retest would also be large.

Because of this reason, zones of major demand are considered to be important support or resistance levels for Bitcoin. Cost basis centers above the price can act as resistance walls, while those below can provide support cushions.

Since BTC is hovering just above a major demand zone between $61,900 and $63,800 after its latest decline, it’s possible that the range could help the asset reach a bottom.

As for the source of the support or resistance effect provided by these demand zones, the answer lies in investor psychology. The holders currently in loss may be looking forward to the price hitting their cost basis to exit with their initial investment.

This selling that may appear upon a retest of many investors’ shared break-even level can pose resistance to BTC. Similarly, the investors below can react to a retest by buying more, as they could look at the drop as a dip opportunity, thus supporting the asset.

It now remains to be seen if the support zone between $61,900 and $63,800 would put an end to Bitcoin’s recent bearish momentum or not.

BTC Price

After the latest drawdown, Bitcoin has just entered into the on-chain demand zone, as its price is now trading around $63,600.

Bitcoin Price Chart

Bitcoin Has Solid On-Chain Cushion Below $68,900: Stage Set For Fresh Rally?

On-chain data shows Bitcoin could have significant support between $66,900 and $68,900, which may help provide solid ground for a fresh surge to higher levels.

A Large Amount Of Investors Bought Their Bitcoin Between $66,900 & $68,900

According to data from the market intelligence platform IntoTheBlock, BTC is currently floating above a major demand zone. In on-chain analysis, the strength of any support or resistance level is based on how much “demand” was present at it.

Below is a chart that shows the various Bitcoin price ranges near the current spot value and how they compare in terms of the total amount of the asset the investors purchased.

Bitcoin Demand Zone

Here, the size of the dot correlates to the total number of tokens that were last acquired at the corresponding price range. It would appear that, out of these zones, the levels between $66,900 and $68,900 currently host the cost basis of the greatest amount of BTC.

More than two million addresses have acquired 1.1 million BTC inside this range. Since the current BTC spot price is above these levels, all investors who buy there will make slight profits.

Investor cost basis is important in the on-chain analysis because the level has special psychological significance. A potential retest of it can result in a flip of the profit-loss balance for the holder.

As such, investors may be prone to making some moves when a retest like this takes place. A holder carrying losses before the retest (that is, the retest is happening from below) may be tempted to sell for fear that the price will go down in the future.

On the other hand, an investor in the green before the retest may have reason to believe the price would go up again and, thus, could decide to accumulate more.

When retests of price ranges thick with investors, one of these reactions may arise on a scale that could be relevant for the wider market, therefore, major demand zones below can act as support points, while those above can act as resistance blocks.

Bitcoin has a large support range of $66,900 to $68,900 right now, which could help cushion any falls should the asset’s price decrease.

From the chart, it’s also apparent that, at the same time, the Bitcoin ranges ahead are thin with holders. This could, in theory, provide the ideal conditions for a rally towards higher levels.

BTC Price

Bitcoin surged past the $70,000 level earlier in the day, but the asset has since retraced to $69,100.

Bitcoin Price Chart

Bitcoin Plunges Under $63,000, Here’s Where Next On-Chain Support Is

Bitcoin has deepened its decline in the past day with its price now slipping below $63,000. Here’s where the next potential support is, according to on-chain data.

Bitcoin Could Find Support At These Price Levels

In a new post on X, analyst Ali has discussed how the Bitcoin support and resistance levels are looking like right now based on on-chain data from Glassnode.

The indicator of relevance here is the “UTXO Realized Price Distribution” (URPD), which, in short, tells us about the amount of coins (or more precisely, UTXOs) that were last purchased at any given price level that the asset has visited in its history so far.

Below is the chart shared by the analyst that shows the data for this distribution for the price levels around the recent spot value of the cryptocurrency:

Bitcoin URPD

From the graph, it’s visible that there are a few price levels not far from the current one that particularly stands out in terms of the amount of buying that took place at them.

In on-chain analysis, the potential for any level to act as support or resistance is based on the total number of coins that have their cost basis at the level in question.

Levels thick with coins that are situated under the current price would be probable to act as points of support, while those above the spot value could prove to be resistance walls.

As is apparent from the graph, the $61,100, $56,685, and $51,530 levels are the ones below the current price that hold the cost basis of a notable amount of the supply right now. Naturally, this means that should the decline continue further, these would be the levels to watch for a possible rebound.

Two levels above, however, are even larger than all three of these support levels: the cost basis centers around $66,990 and $72,880. Interestingly, the latter of these is the single largest acquisition level out of all the price levels listed in the chart, implying that a large amount of FOMO buying has occurred at the asset’s all-time high levels.

In the scenario that Bitcoin regains its upward momentum, these levels of high cost basis population would be where the asset could be most probable to find some trouble.

Now, as for why acquisition centers are considered relevant for support and resistance in on-chain analysis is the fact that investors are likely to show some kind of reaction when a retest of their cost basis takes place.

When such a retest is from above, the holders may decide to accumulate more, believing that the price will go up again in the future. On the other hand, they may sell instead if the retest is from below, as they may think exiting at break-even is better than risking another drop.

A large number of coins having their cost basis at the same level means a potentially large degree of one of these reactions happening and, hence, a strong support or resistance effect on the price.

BTC Price

Bitcoin is inching closer to the first major on-chain support level as it has now dropped to $62,700.

Bitcoin Price Chart

Bitcoin Safe From Drops Under $60,300? On-Chain Data Says So

On-chain data shows Bitcoin currently has a thick supply wall between the $60,300 and $62,155 levels that may prevent the asset from falling lower.

A Large Amount Of Bitcoin Was Bought Near Current Prices

As explained by analyst Ali in a new post on X, BTC has a major support wall just below it right now. In on-chain analysis, the strength of support and resistance levels is gauged through the amount of Bitcoin that the investors bought at them.

The chart below shows how the distribution of the investor cost basis has looked like for BTC across the price ranges near the current spot value:

Bitcoin Support

Here, the size of the dot represents the number of tokens that the addresses bought between the corresponding price levels. From the graph, it’s apparent that the $60,300 to $62,100 range has a particularly high density of coins right now.

Most of the price levels in this range lie just below the current spot price of the cryptocurrency, meaning that the investors who bought here would be making some profit, albeit only a slight one.

Generally, when the price retests the cost basis of such investors who were in profit prior to the retest (meaning that the price has approached their cost basis from above), a buying reaction may be produced by these addresses.

This is because holders like these may have reason to believe that if they were able to get into profits before, they might be able to do so again in the near future, so they may just accumulate on this “dip.”

Such a reaction can naturally provide support to the cryptocurrency. The scale of this support, however, is naturally not anything significant if only a few investors bought at the level to begin with. Narrow ranges that are thick with addresses, on the other hand, might just prove to be a source of noticeable support.

In the aforementioned price range near the current spot price, one million addresses acquired a total of about 671,000 BTC. “This accumulation zone highlights strong investor confidence and could serve as a crucial level of support for BTC, potentially cushioning against further drops,” notes the analyst.

While the price ranges under the current price are heavy with coins, it’s visible in the chart that this isn’t the case for the ranges above. Just like how supply wallets below can be a source of support, they can instead act as resistance when above.

The fact that the supply walls above are quite thin suggests that there wouldn’t be too many investors waiting to quickly exit at their break-even, and thus, selling pressure due to them should be low.

That said, it doesn’t mean there isn’t any impedance at all. Bitcoin is approaching all-time highs at this point, meaning that the vast majority of the supply is in profit. At these levels, mass selling for harvesting these gains can be the main challenge preventing the run from continuing.

BTC Price

At present, Bitcoin is trading around the $62,000 level, meaning that it’s right on the edge of the major support wall.

Bitcoin Price Chart

Bitcoin Crash To $38,000: Here’s What Could Trigger It

Data shows Bitcoin is losing a major region of on-chain support with its latest plunge. Here’s the range where the next zone lies for the asset.

Bitcoin Has Slipped Under $41,200 To $42,400 Support Region

As explained by analyst Ali in a post on X, BTC has slipped under a key on-chain support zone today. An “on-chain support” range refers to a price below the current spot price of the cryptocurrency that hosts the cost basis of many investors.

For any holder, the cost basis, the price at which they bought their coins, is a fundamental level, as a retest of it by the cryptocurrency can change their profit-loss balance.

Investor psychology works such that if this retest of the cost basis happens from above (meaning that the holder had been carrying profits before this), the holder might react by buying more of the asset because they may believe this same price range could turn out to be profitable again in the future.

On the other hand, any investor who had been in a loss earlier could become likely to sell when the price reaches its break-even mark, as they wouldn’t want to miss out on the opportunity to escape without any losses if the asset happens to drop again shortly.

The individual investors’ reactions aren’t generally relevant to the market as a whole. Still, if many holders show this reaction at once, the combined force can cause fluctuations in the price.

Now, here is a chart that shows what the different price ranges look like for Bitcoin in terms of the number of addresses who bought at them:

Bitcoin Support And Resistance

As displayed in the above graph, the Bitcoin range between $41,200 and $42,400 is quite thick with investors. In total, 1.87 million addresses have bought 727,520 BTC at these levels.

Bitcoin has been moving in and out of this crucial support region the past day, suggesting that the zone may weaken. If the range gets lost, BTC might see an extended drop below towards the next major support zone.

The chart shows that the $37,400 to $38,700 range is where substantial on-chain support could next be available, as 1.28 million addresses have their cost basis.

Thus, Bitcoin may be at risk of declining to as low as $38,000 (the average price of the range) shortly. In the potential scenario of such a drawdown, the current $41,200 to $42,400 range could also become resistance, as these addresses would become loss holders desperate to leave.

BTC Price

Bitcoin slipped toward the $40,500 level during the past day but has since recovered to the $41,600 mark. It would appear that the support may not be entirely lost yet.

Bitcoin Price Chart