Bitcoin Battles Key Support: Daily EMA-100 Must Hold to Prevent Deep Correction

Bitcoin briefly fell below the critical $100,000 level over the weekend, reaching a low of approximately $98,200 and triggering a wave of panic selling across crypto markets. The sharp drop came after news broke of US military strikes on Iranian nuclear facilities, a move that significantly escalated the already volatile conflict between Israel and Iran. The geopolitical shock sent global markets into risk-off mode, with Bitcoin reacting quickly to the growing uncertainty.

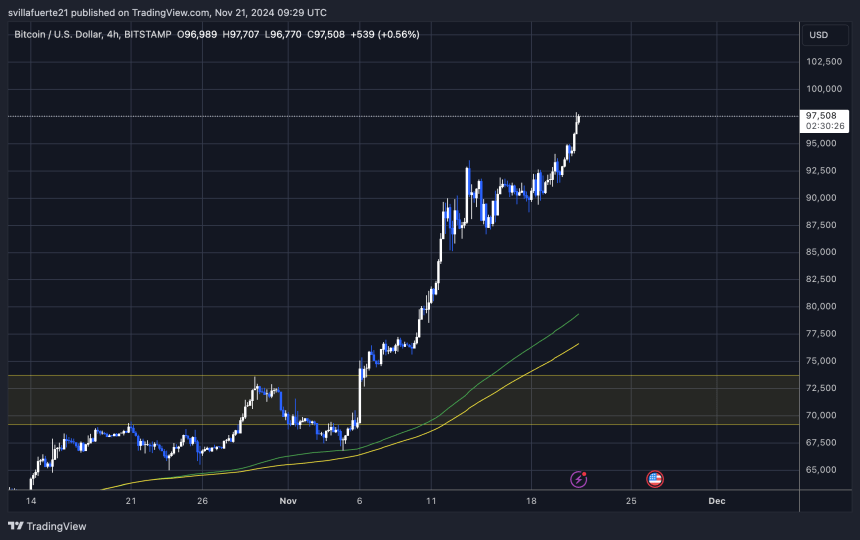
Despite the weekend dip, BTC has since reclaimed the $100K mark, but sentiment remains fragile. Investors are now watching key technical levels closely to determine the next move. According to top analyst Ted Pillows, Bitcoin must hold the daily EMA-100 to avoid further downside pressure. A decisive close below this level could open the door for a deeper correction, especially if macroeconomic and geopolitical risks persist.

As volatility spikes and fear grows, Bitcoin’s ability to maintain support at these levels may define whether the bull cycle continues or enters a prolonged consolidation phase. All eyes are now on the $100K zone, which has become a critical battleground for bulls and bears in a market driven by both technicals and global tension.

Bulls Defend $100K As Dominance Rises and Market Faces Crucial Test

Bitcoin is once again at a pivotal moment. After dipping below the psychological $100,000 level over the weekend amid growing geopolitical tensions, BTC quickly reclaimed this critical threshold, offering a glimmer of hope to market participants. Although bulls managed to push the price back up, the overall structure remains fragile, and technical indicators now carry more weight than ever.

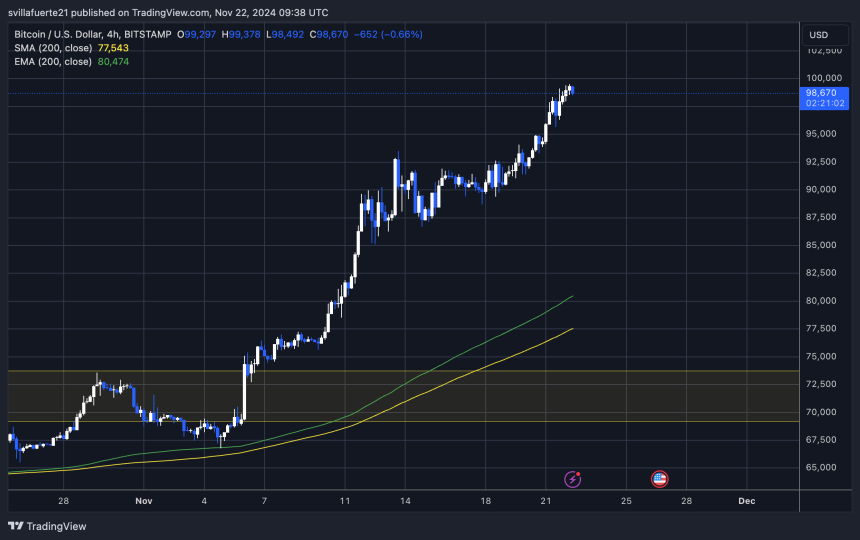
Ted Pillows noted in a recent update that Bitcoin must hold its daily EMA-100 to preserve bullish momentum. A daily close below $99,000 would confirm a break below this key support zone, likely triggering a retest of the $92,000–$94,000 region. Such a move could create significant downside pressure, particularly on altcoins, which are already lagging behind in performance. In Pillows’ words, “If Bitcoin loses this level, alts will be annihilated.”

Bitcoin testing daily 100-EMA | Source: Ted Pillows on X

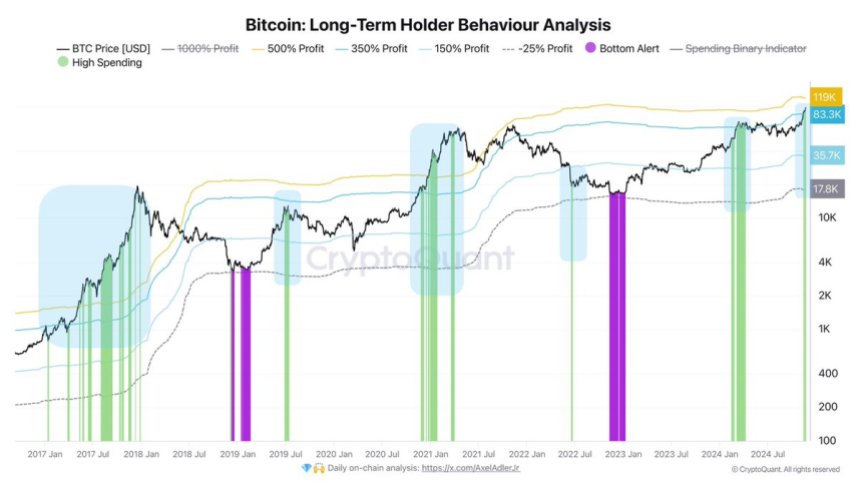
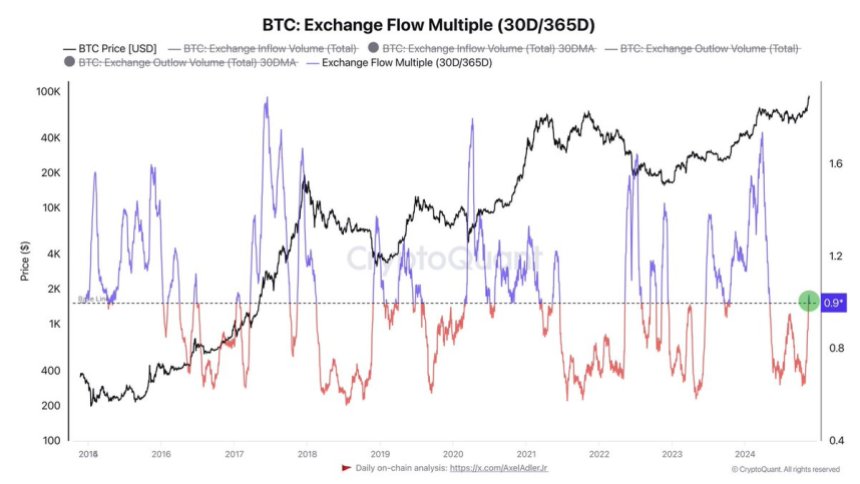
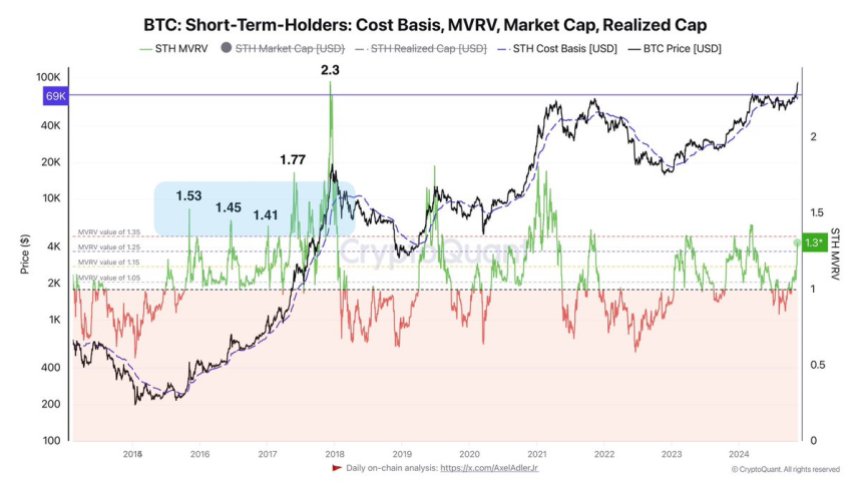
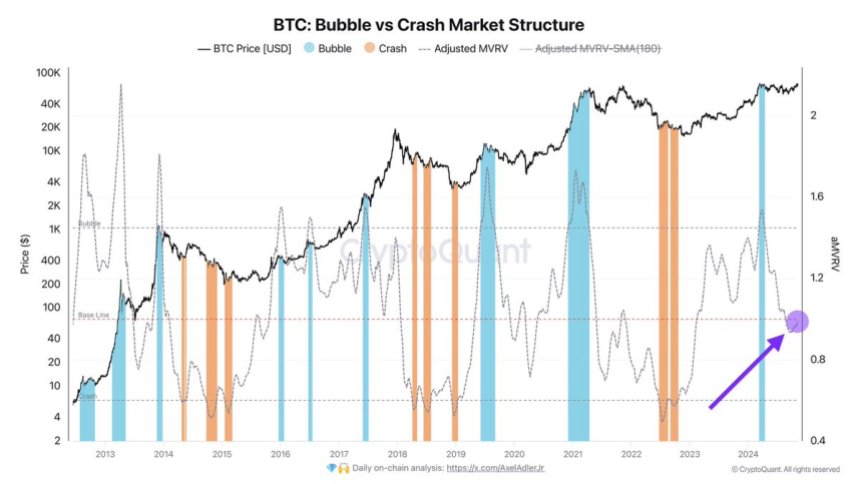
Despite the looming risks, fundamentals remain solid. Bitcoin dominance continues to hover near its highest levels of the year, reflecting growing investor preference for BTC over high-beta assets during uncertain times. On-chain metrics still indicate strong holder conviction, and macro narratives continue to favor Bitcoin as a hedge amid fiat instability and rising geopolitical uncertainty.

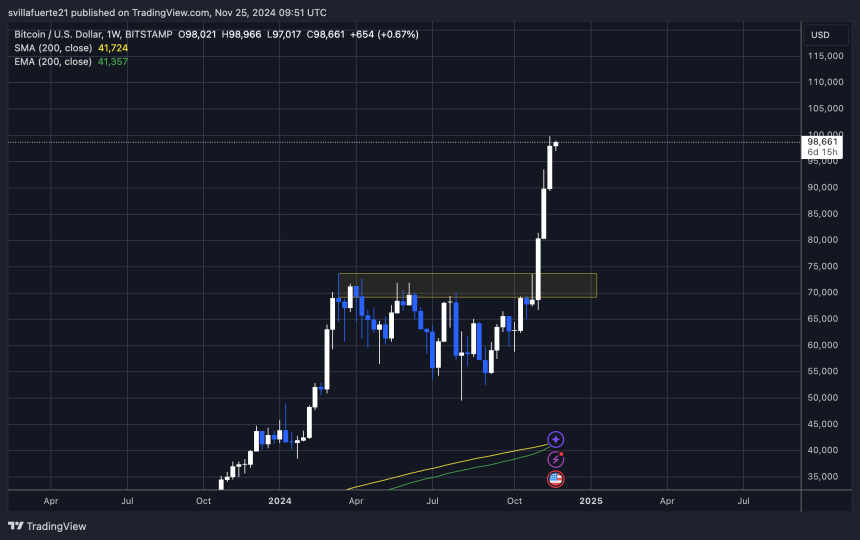
If Bitcoin can hold the $100K level and reclaim momentum, it could lead to renewed strength and eventually a push toward the $109K resistance zone. For now, however, bulls are on the defensive. Price action over the next few days will likely define the trajectory for the remainder of Q3, with a close watch on EMA support, macro headlines, and risk sentiment across global markets.

Bitcoin Struggles Below Resistance Amid Bearish Price Structure

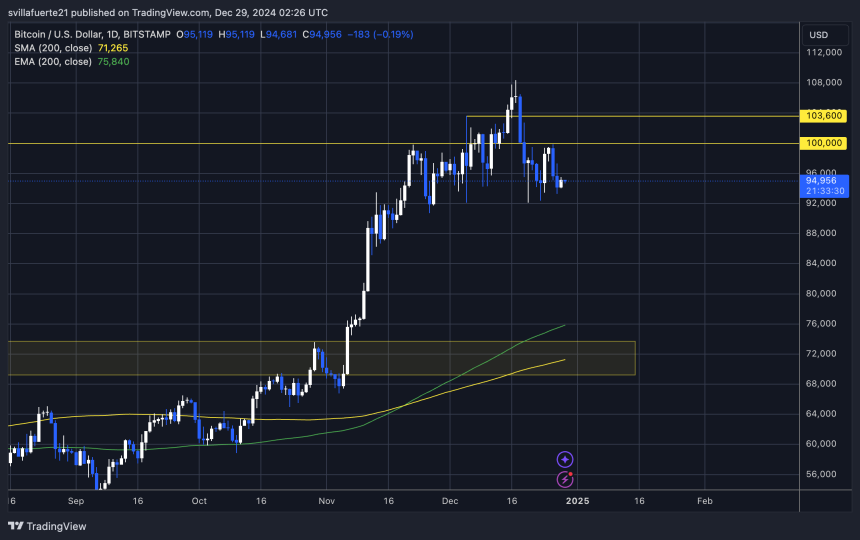
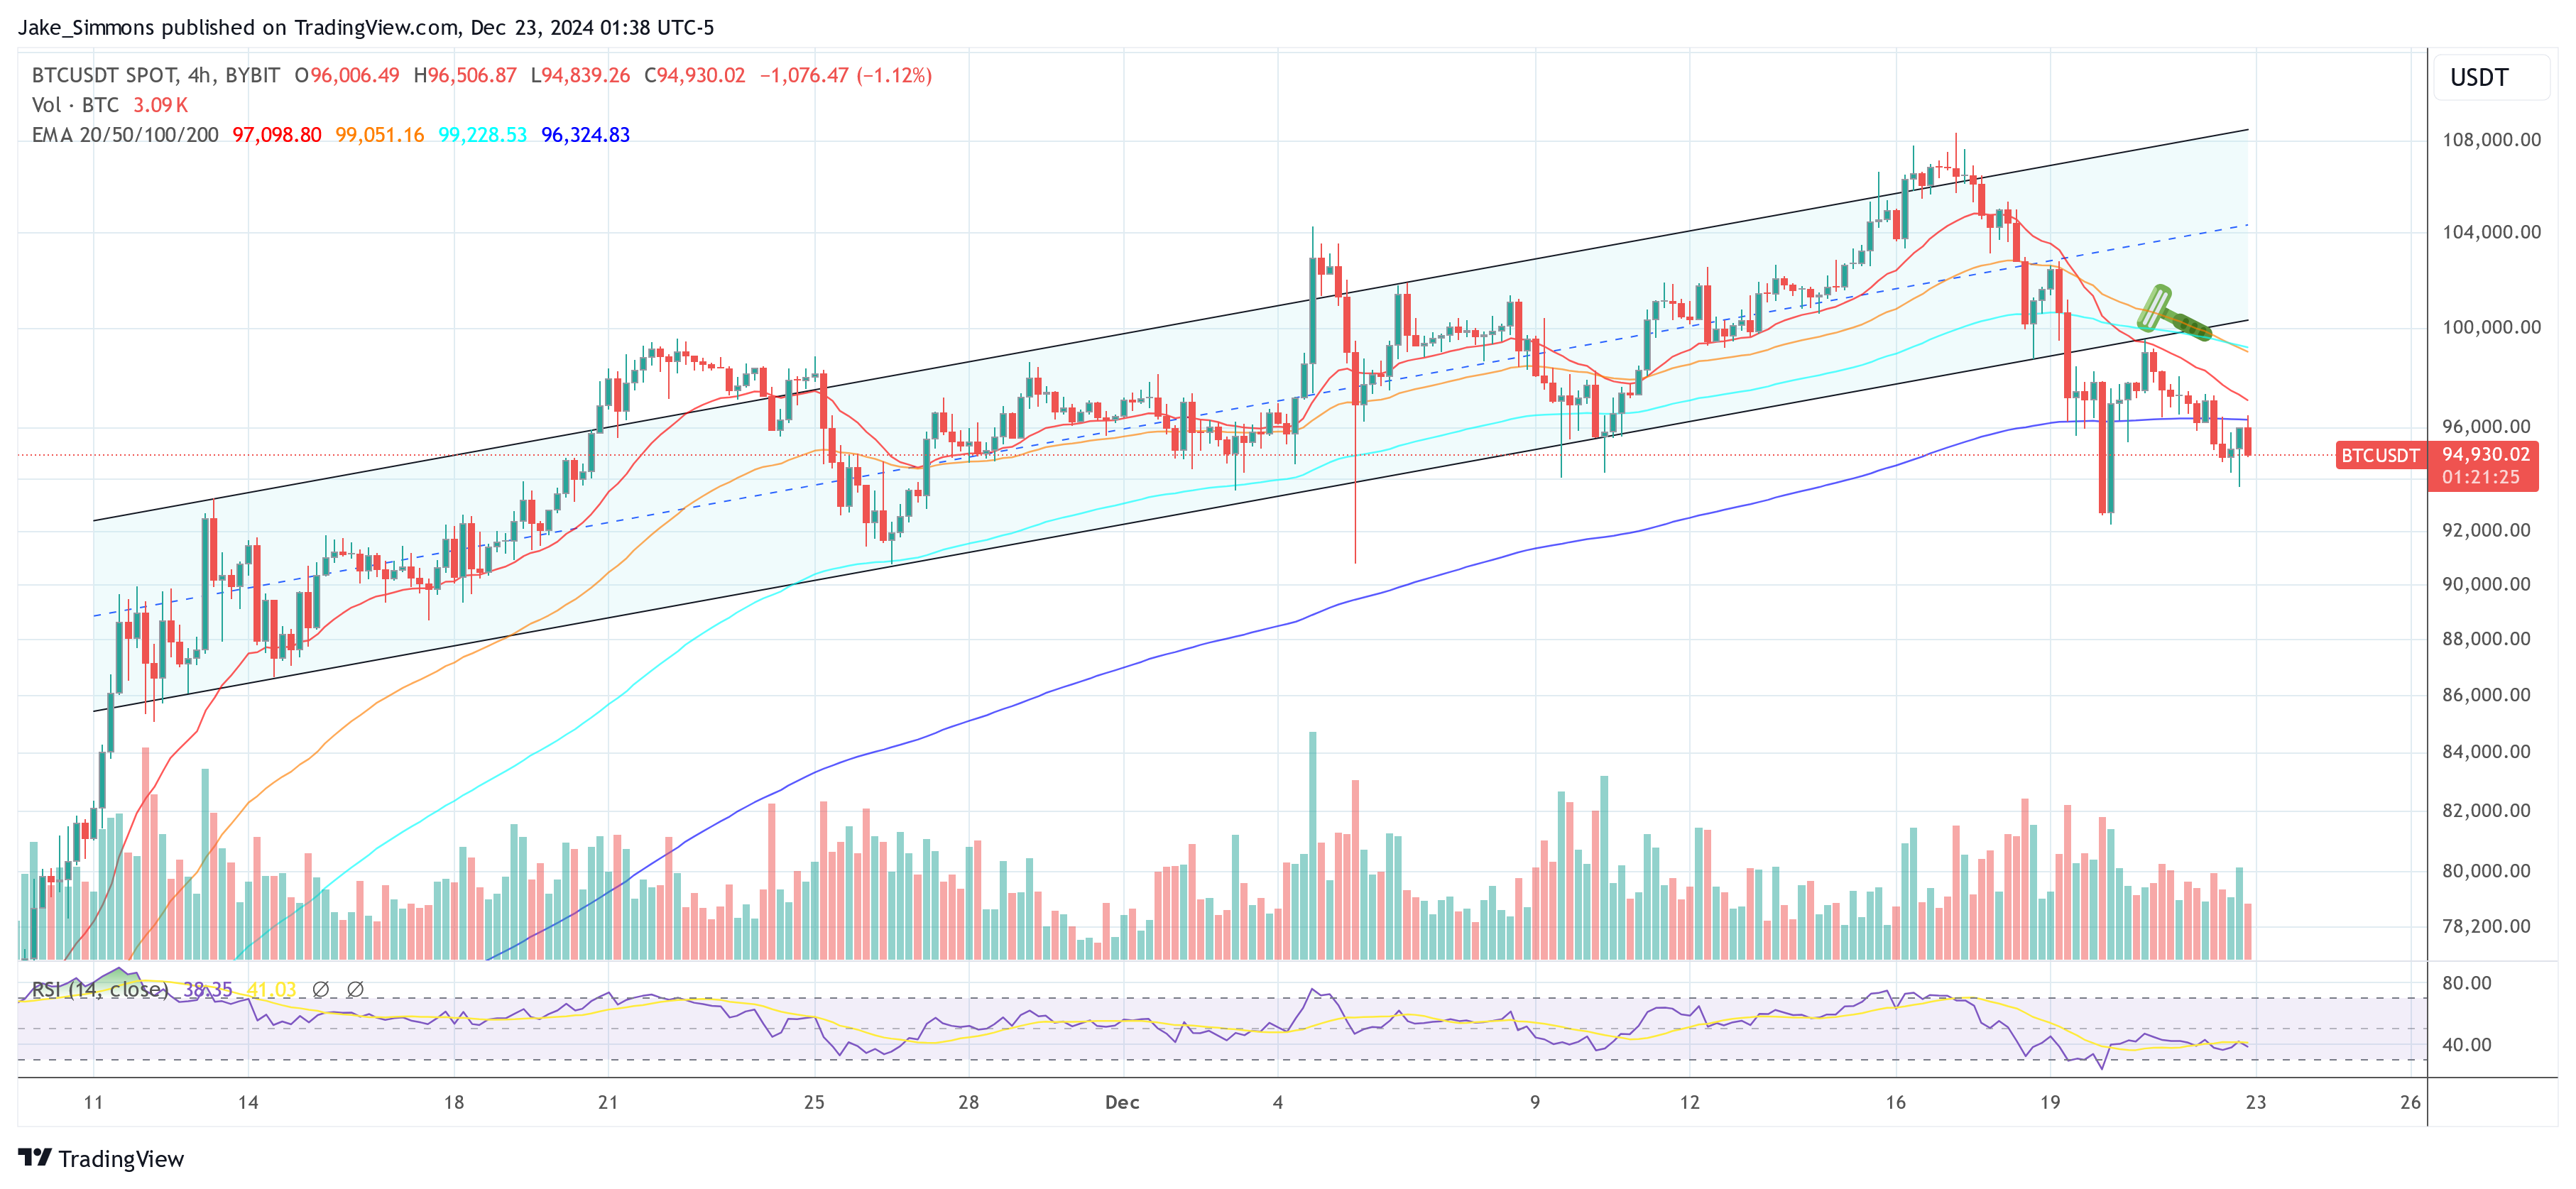
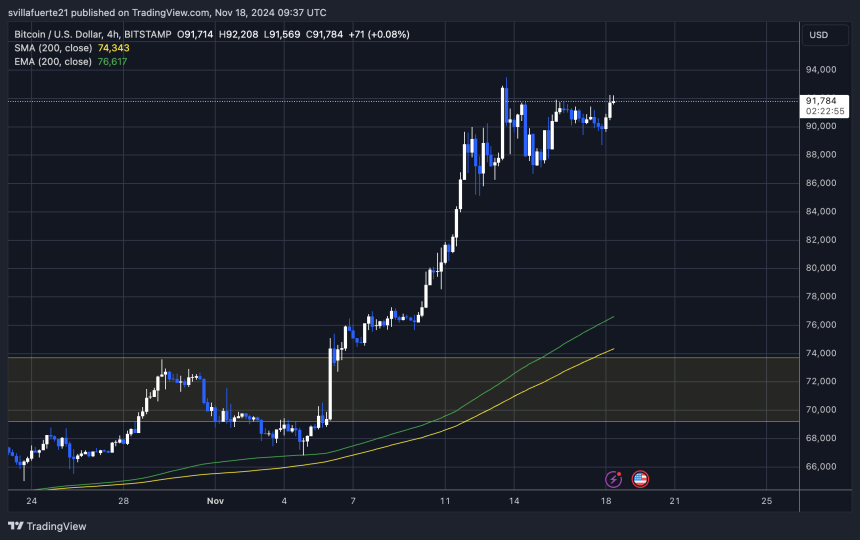
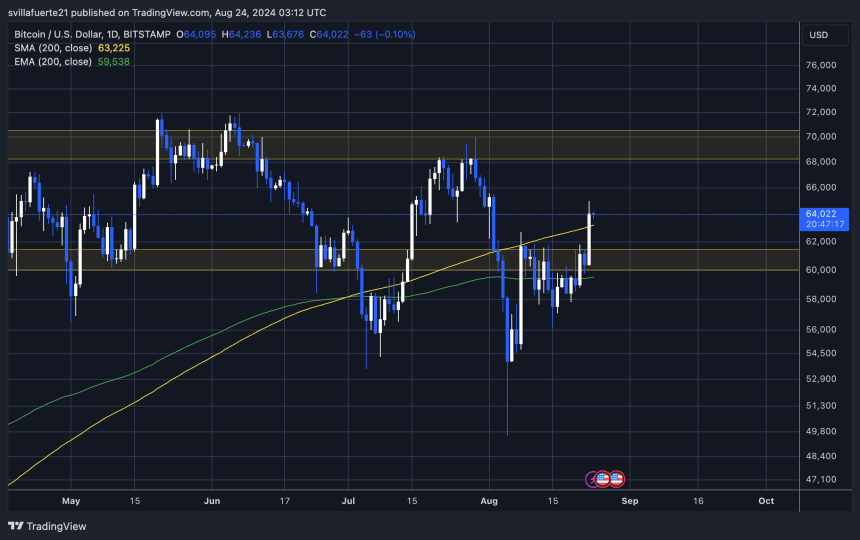
The 12-hour chart for Bitcoin reveals a bearish structure following the breakdown below the $103,600 support zone. After forming a symmetrical triangle throughout mid-June, BTC failed to break upward and instead reversed direction, confirming a downward breakout. This move triggered a sharp decline to $98,200 over the weekend, followed by a modest recovery to the current $101,250 level.

BTC sets new low | Source: BTCUSDT chart on TradingView

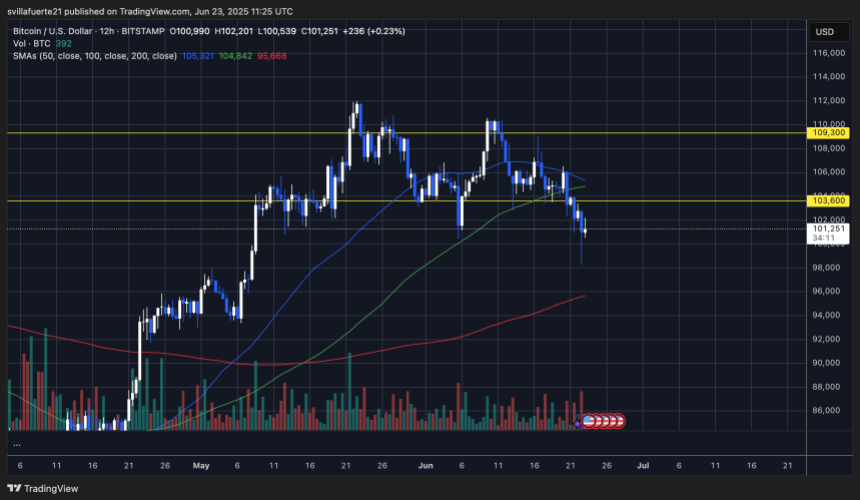
The price is now trading below both the 50 and 100-period simple moving averages, which are beginning to curl downward, signaling a shift in momentum away from bulls. The 200-period SMA, currently near $95,600, stands as the next major support if downside pressure continues. Volume has picked up notably on the red candles, adding weight to the bearish case and confirming active selling during the recent drop.

Bitcoin must reclaim the $103,600 zone and hold above it to invalidate the bearish pattern and regain control. Failure to do so could result in further downside toward $95,000 and possibly even $92,000. As long as BTC remains below the broken triangle support and the $103K resistance, the path of least resistance remains downward. Bulls face an uphill battle, and confidence may erode quickly if the $100K psychological level is breached again.

Featured image from Dall-E, chart from TradingView

Bitcoin Whale Moves 8,000 BTC Aged 5-7 Years – What Happened Last Time

Bitcoin continues to grapple with the psychological $100,000 milestone, failing to break above this critical resistance after a retrace from all-time highs. This prolonged stagnation has sparked discussions about a potential correction or deeper retrace as the market awaits confirmation of Bitcoin’s next major move. Both analysts and investors are closely monitoring the situation, eager to discern whether the cryptocurrency will rally to new heights or succumb to selling pressure.

Adding fuel to these concerns, renowned analyst Maartunn recently highlighted alarming on-chain activity. Over 8,000 BTC, aged between five and seven years, have moved on-chain, raising questions about long-term holders’ intentions. Historically, such movements have often preceded market shifts, with increased selling pressure signaling potential weakness.

The activity from these seasoned wallets could reflect fading confidence or profit-taking, keeping Bitcoin subdued under the $100K threshold. While bulls and bears remain locked in a battle for dominance, this significant metric underscores the growing uncertainty. As Bitcoin’s trajectory hangs in the balance, market participants brace for clarity on whether this pivotal level will eventually transform into solid support—or mark the start of a downward correction.

Smart Money Moving Bitcoin  

Since early December, Bitcoin has entered a prolonged consolidation phase, struggling to establish clear momentum in either direction. Recent on-chain data suggests that whale activity is playing a pivotal role in keeping the price suppressed. According to top analyst Maartunn, a familiar entity—an old Bitcoin whale—has resurfaced, making significant moves that could influence the market’s trajectory.

Maartunn emphasizes that the movement of more than 8,000 BTC echoes a pattern seen just 10 days ago. At that time, the same whale reportedly shifted more than 72,000 BTC in total since the consolidation phase began. This whale, often referred to as “smart money,” has been active like never before, signaling strategic positioning rather than impulsive selling.

Bitcoin whale moved 8,000 BTC aged between 5y - 7y

The implications of this activity are profound. As long as this whale continues to offload BTC, the selling pressure could hold Bitcoin below key psychological levels, extending the current consolidation period for a few more weeks. However, this accumulation and redistribution phase could set the stage for a massive rally once the activity subsides.

Analysts interpret this as a period of preparation by seasoned market participants, suggesting that when the dust settles, Bitcoin might experience a powerful upward breakout.

BTC Above Key Demand Level

Bitcoin is currently trading at $95,000 after managing to hold above the critical $92,000 support level. Despite bears maintaining control over the market in recent weeks, they have been unable to break through the key demand zones at $92,000 and $90,000. These levels have acted as a strong base, preventing further downside and signaling resilience among buyers.

BTC holding above $92K

If Bitcoin continues to defend these crucial levels, it could pave the way for a swift challenge to its all-time high (ATH). Holding above $92,000 would reinforce bullish sentiment and attract renewed interest from traders and institutional investors eyeing the psychological $100,000 milestone.

However, the path ahead is far from guaranteed. A failed attempt to reclaim $100,000 could signal exhaustion among buyers, potentially triggering a deeper correction. Such a scenario might see Bitcoin revisiting lower support zones as market participants reassess their strategies.

The coming weeks will be critical for Bitcoin’s trajectory. Whether it rallies to new heights or faces a significant retrace will depend on its ability to hold key levels and overcome the psychological barriers that have kept it below $100K. Investors are watching closely, anticipating Bitcoin’s next decisive move.

Featured image from Dall-E, chart from TradingView

What’s The Worst Case Scenario For Bitcoin Right Now? Analyst Explains

In his latest video published on December 21, crypto analyst Rekt Capital tried to answer the question “What’s The Worst Case Scenario For Bitcoin Right Now?”. After reaching a new all-time high at $108,374 on December 17, the BTC price is down more than -11%.

How Low Can Bitcoin Price Go?

Rekt Capital put the Bitcoin price pullback in a historical perspective, underscoring the historical importance of weeks 6, 7, and 8 in a “price discovery uptrend.” Drawing upon past cycles such as 2013, 2016–2017, and 2021, he explained that Bitcoin has a strong tendency to correct during these specific windows, with some dips reaching as steep as 34% or even higher.

“Understanding these weeks is crucial because they tend to be problematic for Bitcoin,” Rekt Capital stated, referencing past cycles where significant downturns occurred within this timeframe. For instance, in week 7 of the 2013 cycle, Bitcoin experienced a dramatic 75% pullback over 13 weeks. Similarly, the 2016-2017 period saw a 34% decline in week 8, underscoring the recurring vulnerability during these specific weeks.

As of the current cycle, Bitcoin has undergone a 10%+ retracement, bringing its price into a historically critical support zone at $96,537 on the weekly chart. Rekt Capital emphasized the importance of this support level, noting, “This area of historical support has enabled the move to $108,000.” He cautioned that failure to maintain this support could trigger a more severe correction down to $89,830.

Bitcoin price analysis weekly chart

Examining the price action of the last few days, Rekt Capital pointed out the emergence of a bearish engulfing candle in the weekly timeframe—a technical indicator often associated with potential reversals. “We’re losing resistances that turned into support,” he observed. This loss signifies a potential transition into a corrective period, as the price struggles to maintain its upward trajectory.

Rekt Capital also pointed out the importance of maintaining the 5-week technical line in his analysis. “If we lose this 5-week technical uptrend and the orange trend line, it would be mounting evidence that we might be transitioning into a corrective period,” he warned.

Bitcoin weekly chart

Furthermore, he addressed the CME gap between the $78,000 and $80,000 price levels, a critical area that has remained unfilled. “Delving into 26%, 27%, 28% dips could fill the entire CME gap,” Rekt Capital noted.

Historically, CME gaps have the tendency to get filled whereas there are a few ones which have never been filled.
Despite all cautionary signals, Rekt Capital maintains a bullish stance in the long-term “These pullbacks are what enable future uptrends in the parabolic phase of the cycle,” he explained. Drawing from previous cycles, he illustrated how corrections have historically provided the necessary “breather” for the market.

In the 2021 cycle, for example, Bitcoin experienced a 16% pullback in week 6 and an 8% dip in week 8, yet the overall trend continued upward. Similarly, the current 10% retracement, while significant, could serve as a preparatory phase for the next leg of price discovery.

At press time, BTC traded at $95,000.

Bitcoin price

Bitcoin Stuck Between $99K And $102K – Analyst Explains Macro Situation

Bitcoin has remained range-bound between $99,000 and $102,000 since breaking above the psychological $100,000 level. While the breakout initially sparked excitement among investors, the current price action reflects market indecision, with no clear direction for the weeks ahead. Concerns about a potential correction linger as the broader market awaits stronger signals to confirm the next trend.

Top analyst Axel Adler recently shared insights on X, supported by data from CryptoQuant, highlighting two crucial support levels at $90,000 and $93,000. These levels represent key demand areas, underscoring that the market floor has moved higher—a positive sign of resilience even amid the uncertainty. According to Adler, these supports could act as safety nets, absorbing selling pressure if Bitcoin fails to sustain its momentum above $100,000.

Despite the hesitation, Bitcoin’s ability to hold above $100,000 for consecutive days has provided some optimism among investors. It remains uncertain whether the market will break out of its current range to continue the bull run or face a correction. For now, all eyes are on Bitcoin’s price action near these critical levels as traders look for clues that could set the tone for the remainder of the year.

Bitcoin Technical Details Explained

Bitcoin has faced choppy price action recently, leaving the market in anticipation of the next big move, whether upward or downward. Traders and investors remain cautious, closely watching key technical and macroeconomic signals. The uncertainty has kept Bitcoin trading between $99,000 and $102,000 as market participants wait for a decisive breakout.

Top analyst Axel Adler recently shared a detailed macro analysis on X, shedding light on Bitcoin’s current position. According to Adler, the market has established two crucial support levels at $90,000 and $93,000, signaling that the overall market floor has shifted higher.

These levels could act as strong safety nets if Bitcoin experiences a short-term pullback. Adler emphasized that these supports reflect growing confidence in Bitcoin’s long-term potential despite the current indecision.

Bitcoin Relative Volatility Deviation

One notable observation is the decline in trading volume peaks, which presents a neutral signal. This indicates that traders avoid excessive risk, preferring to wait for clearer market signals before entering significant positions. The declining volume also suggests a reduced likelihood of extreme price volatility in the immediate term.

With Bitcoin stuck in its current range, the market remains highly sensitive to external factors. Any significant news or events could quickly trigger a breakout or breakdown, setting the stage for Bitcoin’s next major move.

BTC Price Action 

Bitcoin is trading at $100,100 after failing to break above its all-time high of $103,600. The current consolidation reflects market indecision while the price remains above key demand levels. Bitcoin’s resilience above $100,000 suggests bullish momentum may still be in play, as buyers look for opportunities to push the price higher.

BTC testing liquidity at $100K

However, the next few days will be critical. A correction could be imminent if Bitcoin fails to hold above the psychologically significant $100,000 level and struggles to find the momentum to surpass $103,600. Analysts warn that a break below $100,000 could trigger a wave of selling pressure, pushing the price toward lower support zones.

The $93,000 level is a crucial area to watch during a downturn. Losing this key support would significantly heighten bearish risks, as it represents a critical demand zone for the market. A failure at this level could result in a sharper correction, potentially challenging Bitcoin’s bullish structure.

Bitcoin’s ability to hold above $100,000 provides a cautious sense of optimism. If bulls can maintain support and fuel a breakout above the all-time high, Bitcoin could enter a new price discovery phase. However, the high stakes make every move above or below these levels pivotal for short-term direction.

Featured image from Dall-E, chart from TradingView

Bitcoin Attempt To Dip Below $96K ‘Led To Nothing’ – Analyst Expects $100K Soon

Bitcoin has been on a remarkable upward trajectory, pushing above the $96,000 mark for several days after consolidating below the psychological $100,000 level. As the leading cryptocurrency, Bitcoin has consistently broken all-time highs over the past three weeks, with yesterday marking a milestone weekly close at $98,000—the highest in its history. 

CryptoQuant analyst Axel Adler shared an insightful analysis on X, emphasizing that Bitcoin’s recent attempt to dip below $95,000 met with significant resistance, reinforcing the strength of current support levels. According to Adler, the market is now poised for a critical test of the $100,000 mark, a barrier that could catalyze further bullish momentum or signal a short-term consolidation phase.

With Bitcoin’s bullish trajectory showing no signs of slowing, traders and investors are closely watching for a breakout above $100,000. Such a move could ignite broader market optimism and drive renewed interest in altcoins, potentially shaping the next phase of the crypto market’s growth. However, failure to break above this key level might trigger a healthy correction, setting the stage for a more sustainable rally.

Bitcoin Price Action Remains Strong

Bitcoin’s price action has remained exceptionally bullish despite a recent retrace from $99,800 to $95,800—a minor dip of less than 4%. Investors widely see this pullback as a brief consolidation phase before a potential breakout above the pivotal $100,000 mark. 

The resilience demonstrated during this retrace has bolstered confidence among market participants, with many viewing it as a healthy pause in an ongoing uptrend.

Renowned CryptoQuant analyst Axel Adler weighed in on the recent market movements via X, sharing a technical analysis that reinforces Bitcoin’s robust bullish structure. Adler highlighted that pushing BTC to lower demand levels was unsuccessful, further solidifying current support zones. 

BTC Hourly High, Low, Median, Volume and 24H Change Analysis

According to his insights, the stage is now set for Bitcoin to finally test the critical $100,000 area and gauge the market’s reaction at this psychological threshold. As BTC approaches this milestone, investor sentiment appears divided. Many traders view the $100,000 level as an ideal price to begin taking profits, citing historical patterns of pullbacks after significant round-number milestones. 

However, others remain optimistic about Bitcoin’s continued strength, forecasting a potential surge beyond $100,000. Predictions for the rally’s peak range between $105,000 and $120,000, reflecting a broader belief in the cryptocurrency’s long-term potential. Whether Bitcoin consolidates or continues climbing, all eyes remain on its next moves.

Bullish Weekly Close Could Send BTC Higher

Bitcoin has achieved its highest weekly close in history, recording an impressive $98,000. This milestone is a technical achievement and a critical psychological boost for market participants. It signals a strong bullish environment that could soon propel Bitcoin above the coveted $100,000 mark.

BTC highest weekly close ever

The $98,000 level now serves as a robust support zone, and maintaining this price—or at least staying above $95,000—in the coming days will be pivotal. A breakout above these levels could propel Bitcoin towards $100,000 with significant momentum. Such a move would solidify Bitcoin’s uptrend and attract further interest from retail and institutional investors.

However, continued consolidation below $100,000 remains a possibility. Bitcoin may take several weeks of sideways movement to gather the strength needed for the next leg up. While potentially frustrating for short-term traders, this consolidation phase would provide a healthy foundation for sustainable growth. 

Featured image from Dall-E, chart from TradingView

Bitcoin LTHs Start Taking Profits – Metrics Reveal Whales Are Actively Spending

Bitcoin has reached new all-time highs for four consecutive days, hitting $99,500 just hours ago. The relentless surge has fueled extreme bullish sentiment in the market, with investors eagerly anticipating Bitcoin’s historic breakthrough of the $100,000 mark. However, on-chain data suggests that the rally may face challenges as signs of profit-taking emerge.

Key insights from CryptoQuant reveal that Long-Term Holders (LTHs) are actively spending their Bitcoin, capitalizing on profits exceeding 350%. This behavior indicates that some seasoned investors are beginning to lock in gains after the aggressive uptrend. Whale activity and profit-taking by LTHs could temporarily slow the rally, potentially triggering a consolidation phase before the next leg up.

While Bitcoin remains shy of the six-figure milestone, the market closely examines whether it can sustain its momentum or if a pullback is imminent. Consolidation at these levels could provide the foundation for BTC to reclaim its bullish trend and break through the psychological $100,000 barrier.

Bitcoin Rally Seems Unstoppable

Bitcoin has surged an impressive 45% since November 5, displaying relentless upward momentum that appears unstoppable. Despite increasing selling activity, demand continues to support the price, driving Bitcoin to new highs and maintaining its bullish trajectory. Market participants are now closely watching for potential signals of a slowdown or correction as BTC pushes deeper into uncharted territory.

CryptoQuant analyst Axel Adler recently shared X data highlighting a significant trend among Long-Term Holders (LTHs). According to Adler, LTHs are actively spending their Bitcoin, capitalizing on profits exceeding 350%. This marks a critical juncture, as these holders are often regarded as market stabilizers, and their selling activity could indicate potential shifts in sentiment.

Bitcoin LTH Behaviour Analysis

Adler further notes that if Bitcoin’s price surpasses $119,000, LTH profits would soar to over 500%. Such extraordinary profit levels could trigger a wave of selling pressure, potentially leading to the first major correction after this unprecedented rally. However, he emphasizes that predicting an exact price point for a correction remains speculative, as no definitive threshold exists to determine when LTHs might overwhelmingly exit their positions.

While the rally shows no signs of slowing down, this dynamic between demand and LTH profit-taking underscores the importance of monitoring market behavior. Traders should remain cautious as Bitcoin’s rapid ascent unfolds.

BTC About To Reach $100K

Bitcoin trades at $98,600, less than 2% from the highly anticipated $100,000 mark. This psychological level is expected to be a significant supply zone, with many investors closely watching price movements around this milestone. Recent “only up” price action has left little room for traders to buy at lower levels, frustrating those who hoped to accumulate during dips.

BTC reaches new ATH at $99,500

If Bitcoin holds above the crucial $93,500 support level in the coming days, market sentiment suggests a powerful surge above $100,000 could follow. Breaking this barrier would likely usher in further bullish momentum, pushing Bitcoin into uncharted territory and fueling optimism for additional gains.

However, failure to maintain support at $93,500 could trigger selling pressure, leading to a price pullback. In such a scenario, Bitcoin might test lower demand zones, with $85,000 and $80,000 identified as key levels to watch. These zones could provide new accumulation opportunities for investors looking to capitalize on price corrections.

As Bitcoin approaches this historic level, the next few days will determine whether the market sustains its bullish trend or enters a consolidation phase. Traders and investors should remain vigilant as BTC navigates this critical juncture.

Featured image from Dall-E, chart from TradingView

Bitcoin Open Interest Hits ATH As BTC Nears $100K – What To Expect?

Bitcoin has shattered records again, reaching a new all-time high of $97,903 just hours ago. The cryptocurrency market is exciting as Bitcoin leads the charge, delivering explosive gains that have fueled widespread bullish sentiment. Investors and traders alike speculate this rally is far from over, with Bitcoin edging closer to the monumental $100,000 mark.

Key data from Coinglass reveals another significant milestone: Bitcoin’s Open Interest has reached an all-time high. This surge in Open Interest indicates a flood of capital entering the market, signaling heightened activity and confidence among traders. Such metrics further confirm the euphoric state of the market, where optimism reigns supreme and momentum continues to build.

With Bitcoin’s price rallying at an unprecedented pace and market indicators hitting record levels, the stage is set for what many believe to be an almost inevitable breakout above the psychological $100,000 level. The market’s focus is whether BTC can sustain its trajectory or if a temporary pullback will precede the next leg up. Either way, the spotlight remains firmly on Bitcoin as it cements its status as the leading force in this explosive bull run.

Bitcoin Greed Enters The Market 

Greed has gripped the Bitcoin market, with the average Fear and Greed Index hitting 76%, signaling heightened optimism among investors. This elevated level of greed suggests that market participants are buying aggressively, anticipating that Bitcoin’s price will continue its upward trajectory without significant setbacks. Such sentiment often leads to increased speculative behavior as traders look to capitalize on the ongoing rally.

Critical data from Coinglass supports this narrative, revealing that Bitcoin Open Interest—representing the total value of outstanding derivative contracts—has reached an all-time high of $62.69 billion.

This unprecedented figure highlights the speculative nature of the current market, as traders use leveraged instruments like futures to amplify their potential gains. While this fuels bullish momentum, it also adds volatility, making the market susceptible to sharp moves in either direction.

Bitcoin Open Interest Hits ATH at $62.69B

Interestingly, Bitcoin’s optimistic environment starkly contrasts the broader crypto market, where altcoins continue to struggle to reclaim yearly highs. While BTC leads the charge with record-breaking performance, altcoins have yet to catch up, underscoring Bitcoin’s dominance during this market cycle phase.

As speculative activity and investor optimism drive Bitcoin’s price action, the market waits to see if the rally has more fuel or if a correction looms. For now, Bitcoin remains the focal point of this euphoric bull run.

BTC Enters Price Discovery Again

Bitcoin is trading at $97,500 after setting a fresh all-time high, continuing its explosive rally. The market leader has entered price discovery—a phase often characterized by parabolic trends like the one currently driving BTC higher. Investor anticipation is growing, with the $100,000 mark only 2.5% away.

This psychological milestone could act as significant resistance, potentially holding Bitcoin down for an extended period. A consolidation phase around this level would benefit the broader market, allowing altcoins to catch up and the rally to maintain stability.

BTC hits new ATH at $97,900

However, price discovery can be unpredictable. If Bitcoin fails to reach the $100,000 mark in the coming days, the market could see a pullback as bullish momentum cools. A retrace to lower demand zones, such as the $88,500 level, would provide the market with a necessary reset before the next leg upward.

Despite the possibility of a short-term correction, Bitcoin’s price action remains strong. Its dominance over the crypto market and the current euphoric sentiment suggest bulls are still firmly in control. As traders and investors closely monitor price movements, Bitcoin’s ability to push through key psychological levels will determine the next phase of this historic rally.

Featured image from Dall-E, chart from TradingView

Bitcoin Demand Outpaces Supply – On-Chain Metrics Reveal Low Seller Volume

Bitcoin spent the weekend trading within a relatively narrow range of $91,700 to $88,700, demonstrating robust price action. Despite the lack of significant price movement, the consistent ability to hold within this range underscores Bitcoin’s current strength and growing market confidence.

Key data from CryptoQuant adds further optimism, revealing a notable reduction in selling pressure. The data indicates fewer sellers in the market, aligning with the broader bullish sentiment that has fueled Bitcoin’s recent momentum. With the supply side constrained, demand could propel BTC higher, reinforcing the strong price action seen over the weekend.

This optimistic backdrop has sparked predictions of aggressive surges in the coming months as Bitcoin remains well-positioned to capitalize on favorable market dynamics. Analysts suggest that with selling pressure limited and demand continuing to grow, Bitcoin could be gearing up for its next significant breakout.

Investors are watching closely to see if this strength will lead to a new phase of upward momentum, potentially pushing BTC into uncharted territory as the market anticipates the next major move in this bullish cycle.

Bitcoin Flow To Exchanges Supports Bulls

Bitcoin has had an exhilarating few weeks, surging 39% in just nine days and marking one of its most aggressive upward moves this cycle. The recent rally has left analysts and investors both excited and cautious as Bitcoin continues to show resilience above key levels. While many expect BTC to maintain its bullish trajectory, opportunities to buy at lower prices are becoming increasingly scarce.

Data from CryptoQuant analyst Axel Adler adds valuable insight into the current market dynamics. Adler notes that the average flow of Bitcoin to exchanges over the past 30 days has not surpassed the average volume over the last 365 days. 

Bitcoin Exchange Flow Multiple

This indicates a lack of significant selling pressure, suggesting that current holders are more inclined to retain their Bitcoin than sell into the rally. With fewer sellers in the market, Bitcoin’s price has the potential to climb further as demand increases.

However, analysts agree that consolidation around the current price range would be a healthy step before the next leg up. Consolidation could allow the market to stabilize, attract fresh demand, and establish stronger support levels for the next growth phase. 

BTC Less Than 2% Away From ATH

Bitcoin is trading at $91,700, just under 2% away from its all-time high (ATH) of $93,483. This proximity to record-breaking levels has fueled optimism among investors, with the price appearing poised to push above the ATH again this week. Bitcoin’s price action remains robust, supported by increasing demand and bullish sentiment in the market.

BTC pushing to ATH again

The sustained strength of BTC’s price has been attributed to its ability to maintain key levels during periods of consolidation. This resilience indicates buyers continue to dominate, reinforcing the possibility of another breakout above the $93,483 mark. Analysts expect breaching this level would likely spark another wave of aggressive buying, potentially driving Bitcoin further into uncharted territory.

However, caution remains warranted. A breakdown below $87,000 would signal a retrace for Bitcoin, potentially initiating a short-term correction in the coming days. Such a move could provide a healthier foundation for the next growth phase, allowing BTC to consolidate and attract fresh demand.

Featured image from Dall-E, chart from TradingView

Bitcoin Spot Is King – STH Selling Pressure Expected To Be Absorbed By ETFs

Bitcoin has experienced a whirlwind of volatility following its recent all-time high of $93,483 set on Wednesday. Over the past few days, the price has oscillated between this record level and a low of $85,100, indicating the potential onset of a consolidation phase before the next major move. Traders and investors are now closely monitoring whether BTC will stabilize or continue its upward trajectory.

Key data from CryptoQuant suggests that selling pressure may increase quickly, primarily driven by speculative traders looking to lock in quick profits. However, this doesn’t necessarily spell trouble for Bitcoin’s bullish momentum.

Analysts predict that much of the selling pressure will be absorbed by the growing demand for Bitcoin ETFs, which have gained significant traction among institutional investors.

This balance between short-term selling and institutional accumulation could set the stage for Bitcoin’s next move. With volatility expected to persist in the coming days, market participants are eagerly watching for signals that might indicate the direction of BTC’s price action. Whether this phase leads to a deeper correction or propels Bitcoin toward new highs, one thing is clear—Bitcoin continues to dominate the financial landscape with its dynamic performance.

Bitcoin Strong Demand Supports Bullish Price Action

Bitcoin’s price action has been impressive, surging by 38% over the past ten days. This rapid rise has caught the attention of many investors, reaffirming the growing strength of Bitcoin’s demand. 

Key data from CryptoQuant analyst Axel Adler offers insight into the current market dynamics, highlighting that Bitcoin is trading above its short-term holder (STH) cost basis of $69,000. This level represents a crucial support threshold for those who acquired Bitcoin in the past few months, indicating solid demand above this price.

Bitcoin STH Cost Basis at $69K and MVRV stands at 1.3

Additionally, the MVRV (Market Value to Realized Value) ratio stands at 1.3, suggesting that Bitcoin is still profitable. However, Adler notes that if this ratio crosses the 1.35 mark, it could trigger selling pressure from short-term speculators looking to lock in profits.

While this may prompt some market volatility, it’s important to note that most of these coins are expected to be absorbed by growing institutional demand, particularly through Bitcoin exchange-traded funds (ETFs).

This data points to a significant shift in Bitcoin’s rally—rather than being fueled by speculative futures trades, the recent surge appears to be driven by strong spot demand. Spot demand typically reflects a more sustainable, stable price move than the volatility often seen in futures-driven rallies. 

As Bitcoin continues to trade above key support levels, the outlook remains bullish, driven by a healthy balance between speculative trading and long-term institutional interest.

BTC Technical View: Prices To Watch 

Bitcoin is trading at $89,240, reflecting a 7% retrace from its recent all-time high of $93,483. The price has consolidated below this level following a period of aggressive upward momentum that propelled it into price discovery territory.

This pause in the rally allows the market to stabilize and test key support levels before determining its next move.

BTC consolidates below its ATH

During this consolidation, the $85,000 mark has emerged as a crucial support level. If Bitcoin can hold above this level in the coming days, it may provide the foundation for another surge, potentially challenging the $90,000 resistance and retesting its all-time high. A successful reclaim of $90,000 would signal renewed bullish momentum, paving the way for further price expansion.

However, failure to maintain the $85,000 support could lead to a deeper correction. In this scenario, Bitcoin would likely seek lower-level demand, with $82,000 emerging as a significant area of interest for buyers.

As the market navigates this critical phase, traders and investors will closely watch price action for signals of either a breakout or a pullback, with both scenarios carrying implications for Bitcoin’s short-term trajectory.

Featured image from Dall-E, chart from TradingView

Bitcoin Indicator Signals Equilibrium After Trump Victory – A Clear Path To New Highs?

Bitcoin is trading around $75,000 following Donald Trump’s victory in the U.S. election, stirring fresh optimism in the crypto market. Trump’s pro-crypto stance has ignited excitement among analysts and investors who anticipate favorable policies for digital assets in his administration. With Bitcoin now sitting at all-time highs, many speculate this could begin a new rally phase.

Related Reading: Ethereum Analyst Sets $3,400 Target Once ETH Breaks Key Resistance – Details

Key data from CryptoQuant indicates that Bitcoin has reached a price equilibrium, suggesting there are no strong market forces pulling the price lower. This positive equilibrium reinforces the bullish outlook and hints at a stable foundation for further growth. Analysts believe Bitcoin may be set for new highs with fewer obstacles in the coming weeks.

As investor confidence builds, some view this phase as a critical moment for Bitcoin to solidify its position in a pro-crypto policy environment. The combination of strong technical support and positive sentiment from Trump’s victory has set the stage for what many hope will be a significant upward trend, potentially driving the broader crypto market higher.

Bitcoin Enters A Bullish Phase

Bitcoin has officially entered a bullish phase after breaking past its previous all-time highs, reaching $76,500. This level has become a new area of focus as many analysts identify it as a potential resistance zone. 

According to CryptoQuant analyst Axel Adler, the market is currently balanced between a “Bubble” and a “Crash” phase. Adler’s analysis, which includes key on-chain data, suggests that Bitcoin’s market structure is at an equilibrium, meaning there are no significant fundamental reasons to anticipate a drop. Instead, this setup provides a stable foundation for possibly continuing Bitcoin’s upward trend.

Bitcoin Bubble vs Crash Market Structure signals equilibrium

With the Federal Reserve’s interest rate decision set to be announced today, the next few weeks promise to be pivotal. A stable or favorable decision from the Fed could reinforce the optimism in the market, drawing in new demand and reinforcing Bitcoin’s position above $76,000. 

Many investors and analysts expect heightened activity from institutional players, particularly given Bitcoin’s resilience around this milestone level. The market’s balance at this juncture is crucial. As long as Bitcoin maintains its current structure, it has the potential to continue its upward trajectory without substantial risk of retracement. 

With fresh demand entering the market and the macroeconomic backdrop shaping up favorably, Bitcoin may soon aim for even higher levels. For now, all eyes remain on the $76,500 mark and how the market will respond in the wake of the Federal Reserve’s announcement. This period of consolidation could be the catalyst for the next leg up, solidifying Bitcoin’s bullish outlook.

BTC Key Levels To Watch 

Bitcoin is trading at $75,000, holding steady above its previous all-time high of approximately $73,800. This level has become a critical support zone as BTC continues in a well-defined 4-hour uptrend. The trend began after a strong bounce from the 200 exponential moving average (EMA) at $66,800, indicating renewed bullish momentum.

BTC trading above previous ATH

Bulls need to keep the price above the $73,000 mark to sustain this momentum, a key psychological threshold. This level boosts market confidence and provides a potential springboard for Bitcoin to reach higher targets soon. A confirmed hold above $73,000 could signal further upside, inviting additional buying pressure and potentially setting up BTC for new highs.

However, if BTC fails to hold this level, it could slip toward a lower demand area of around $70,500. Despite this possibility, current price action shows no significant signs of a downturn. The steady uptrend and firm support levels suggest that Bitcoin’s bullish outlook remains intact, with little indication of an imminent drop.

As long as BTC maintains its structure, the path toward continued gains remains clear, reinforcing confidence in the ongoing rally.

Featured image from Dall-E, chart from TradingView

Bitcoin Open Interest Dropped Significantly – Investors Cautions Amid US Election Week?

Bitcoin has faced significant volatility and uncertainty as it approaches a pivotal week, with tomorrow’s U.S. election expected to play a key role in determining its price action. BTC is holding steady above the $68,000 mark, a critical level that has shifted from resistance to a solid demand zone. Analysts see this level as essential for maintaining bullish momentum, especially with high-stakes events on the horizon.

Key data from Coinglass reveals a notable drop in Bitcoin’s open interest, suggesting that many investors are closing their positions amid the uncertainty surrounding the election and the Federal Reserve’s upcoming interest rate decision on Thursday. This decline in open interest reflects a cautious market stance as traders anticipate the election outcome and its potential influence on broader financial markets and Bitcoin’s trajectory.

With BTC managing to hold above this demand zone, the coming days will be crucial for confirming its direction. A sustained hold could strengthen BTC’s outlook, setting it up for a potential breakout. Conversely, increased selling pressure tied to market reactions could put this level to the test. The week ahead could be a defining moment for Bitcoin’s price action as macro events unfold.

Bitcoin Investors Preparing For This Week

Bitcoin is gearing up for what could be the most defining week of this market cycle. Approaching all-time highs, BTC is facing heightened volatility as two critical events unfold: the U.S. presidential election and the Federal Reserve’s decision on interest rates.

These events are poised to impact Bitcoin and global financial markets, potentially shaping global trade policies and economic stability.

Recent data from Coinglass highlights that investors are bracing for a turbulent week as open interest in Bitcoin dropped significantly, with many traders opting to close their long and short positions before the election.

Bitcoin Open Interest has dropped significantly

This retreat in open interest signals caution, as the crypto market anticipates significant volatility stemming from the election results and the Fed’s rate decision. Coinglass shared an analysis on X, emphasizing that Bitcoin’s price could experience extreme swings regardless of who wins the election, likening it to a “wild rollercoaster.”

This week is crucial for Bitcoin and the broader global economy, with analysts suggesting that the election could set the tone for international economic policies and trade relations in the years to come. The Fed’s rate decision, scheduled just days after the election, adds additional uncertainty, as it could dictate monetary policy direction and market liquidity.

With BTC teetering near historic highs, investors are closely watching these events to learn about market direction. Whether Bitcoin breaks to new heights or experiences a pullback largely depends on the unfolding economic landscape. For now, Bitcoin remains on edge, with investors poised for a week that could define its trajectory for the months ahead.

BTC Testing Crucial Liquidity  

Bitcoin is trading at $68,800 after falling short of breaking its all-time highs last week. This week promises heightened unpredictability for BTC’s price action, driven by major events in the global economy. Key levels will be essential to watch: if Bitcoin can maintain support above $68,000, it will likely set the stage for another attempt to surge past its record high.

BTC holding above the $68K mark

However, volatility may test this support, potentially shaking out “weak hands” before any significant upward momentum. Should BTC dip below $68,000, further pullbacks could follow, allowing institutional buyers to accumulate before a renewed push.

If Bitcoin successfully breaks above its $73,794 all-time high, it will enter a price discovery phase, where the lack of resistance can trigger a rally fueled by FOMO (fear of missing out) among investors. This upward momentum in a price discovery zone often leads to rapid price increases as more buyers enter the market. 

As Bitcoin edges to this level, market participants remain watchful, anticipating a potential breakout that could redefine the broader market sentiment and establish new highs for the cycle.

Featured image from Dall-E, chart from TradingView

Bitcoin Short Positions Face Serious Risk Above $68,500 – Details

Bitcoin has experienced a volatile week, with prices oscillating between a local high of $69,500 and a low of $65,000. After weeks of excitement and upward momentum, the market has cooled off, and BTC is currently consolidating below the critical $70,000 level. This consolidation phase is crucial as traders assess the next potential move for Bitcoin.

Analyst Ali Martinez has shared significant data from Binance, highlighting the high risk for short positions at the $68,500 mark. When such risk levels are present, the price often seeks liquidity, which suggests that it may gravitate toward supply zones. This behavior indicates that the market is potentially targeting areas where sellers may be positioned, which could lead to further fluctuations in price.

The interplay between these resistance and support levels will determine Bitcoin’s trajectory. A decisive move above these levels could signal Bitcoin’s next phase, making it critical for investors to remain vigilant.

Bitcoin Short Squeeze Looms

Bitcoin is reaching a pivotal moment, with the market buzzing with expectations for a potential push toward all-time highs. Martinez recently shared crucial data on X, revealing that a significant number of short positions are at risk of liquidation, particularly around the $68,598 mark. The cumulative short liquidation leverage at this price level is approximately $452.36 million, indicating that a substantial amount of capital could be affected if the price continues to rise.

Bitcoin Binance liquidation map

This scenario sets the stage for a bullish outlook, as overleveraged short positions suggest that Bitcoin could find liquidity at supply levels. This could trigger a cascade of buying pressure. When the price breaks above the key $69,000 mark, it could lead to a wave of Fear of Missing Out (FOMO) among traders and investors watching from the sidelines.

The liquidation of these short positions could propel Bitcoin’s price higher, strengthening the bullish narrative. Market participants closely monitor this critical threshold, as a decisive break above $69,000 could ignite a surge toward previously untested highs.

Maintaining awareness of both market dynamics and key price levels is essential for traders looking to navigate the volatility. The next few days could prove crucial as Bitcoin approaches this significant moment, and how it reacts to these overleveraged positions may determine its trajectory in the coming weeks.

BTC Liquidity Levels

Bitcoin (BTC) is currently trading at $67,100 after a week marked by volatility and uncertainty. The price has pushed above the $66,000 level, signaling strength and hinting at a potential rally in the coming weeks. This upward movement reflects renewed optimism in the market, as investors look for signs of sustained bullish momentum.

BTC holding above $65K

However, it’s essential for BTC to maintain its position above the $65,000 mark. If the price fails to hold this level, a sideways consolidation may occur, allowing the market to gather liquidity before making its next move. This consolidation phase could set the stage for a surge in buying activity as traders look to capitalize on potential opportunities.

A break above the key $70,000 level would further strengthen the bullish outlook, potentially initiating a new uptrend. Such a movement could attract additional investment and excitement in the market, as traders and investors respond to the breakout. 

Featured image from Dall-E, chart from TradingView

Number Of Bitcoin Bulls Increases As Funding Rate Shows Steady Growth – Details

Bitcoin has rebounded strongly from the $65,000 mark after a 6% dip from Monday’s high of around $69,500. Despite the recent pullback, BTC remains in a bullish trend that has been in place since early September. This rebound shows resilience, helping maintain the bullish market structure. 

Key data from CryptoQuant reveals that the average funding rate has steadily grown since September, indicating that bullish sentiment is increasing as more traders actively engage in the market.

The coming two weeks will be pivotal for Bitcoin as it approaches March’s all-time high. Investors and analysts closely watch price movements as BTC builds momentum toward breaking key resistance levels.

If the bullish trend continues, Bitcoin could be poised for another significant rally, with the potential to set new highs shortly. However, any failure to hold current levels could bring renewed volatility.

Bitcoin Showing Strength

Despite a recent dip, Bitcoin remains strong above key demand levels, maintaining the overall bullish structure. Analysts and investors are closely monitoring the price action for confirmation that the current phase is simply a bullish consolidation before the next leg up. 

CryptoQuant analyst Axel Adler shared data on X, highlighting the BTC futures perpetual funding rate, which has shown steady growth since Bitcoin reached the $60,000 level. This indicates a growing number of bulls entering the market, with optimism rising as the price pushes higher.

Bitcoin futures perpetual funding rate growing since $60K level

Adler suggested that bullish momentum will likely continue as long as this funding rate increases, reinforcing that BTC is in a healthy consolidation phase. However, this doesn’t guarantee an immediate breakout. There is still a significant chance that Bitcoin may trade sideways over the next few days. Sideways price action could be essential for building liquidity, allowing the market to gather strength for a larger move.

While the market sentiment remains optimistic, especially with the ongoing increase in bullish activity, investors should prepare for potential fluctuations. The next major price action could go in either direction, but the steady support above key levels is a positive indicator for those betting on further upside in Bitcoin’s price.

BTC Holding Above Key Demand 

Bitcoin is holding strong above the $66,000 level after finding support around $65,000. Currently trading at $67,100, the market seems to be in a consolidation phase, and it may take some time before a breakout above the crucial $70,000 level. 

BTC strong rebound from $65K level

For the bulls to maintain momentum, it’s essential that the price holds above $65,000 or finds support around the $64,300 mark, where both the 4-hour exponential moving average (EMA) and moving average (MA) align.

If Bitcoin fails to maintain these support levels, a deeper correction could be expected, with the price potentially retracing to lower demand zones around $60,000. On the other hand, if BTC manages to break and hold above $70,000 in the coming days, this could trigger a strong rally toward challenging all-time highs.

With investors closely monitoring key support and resistance levels, the next few days will be crucial for determining Bitcoin’s direction.

Featured image from Dall-E, chart from TradingView

Bitcoin ETFs See $1.6B Inflows This Week – Is BTC Reaching A New ATH Soon?

Bitcoin is holding strong above $67,000 after setting a new local high of around $68,300, fueling excitement among investors. This bullish momentum is driven by price action and supported by key market data signaling a potential uptrend continuation.

Daan, a top crypto analyst, shared crucial insights showing that Bitcoin ETFs have been buying heavily for the past four days. This surge in institutional demand is a positive signal for the market, as it could further propel Bitcoin toward new all-time highs.

The next few days will be critical for Bitcoin’s trajectory, with many traders and investors eyeing a potential breakout to historic levels. The anticipation grows as BTC edges closer to these highs, making the upcoming price movements pivotal in shaping the market’s direction.

Bitcoin Demand Rising

The whole market is buzzing with excitement and volatility, with Bitcoin leading the way by establishing a clear uptrend since early September. 

Analysts and investors are attributing part of this surge to the Federal Reserve’s recent interest rate cuts, but other significant factors influence Bitcoin’s price action.

Key data shared by Daan, a top crypto analyst, reveals that Bitcoin ETFs have seen substantial inflows over the past week. 

Bitcoin ETFs inflows for the past 4 trading days

The last four trading days alone have witnessed a combined $1.639 billion in inflows, making this week one of the most successful since the inception of Bitcoin ETFs. This surge in institutional demand signals that traditional investors are increasingly confident in Bitcoin’s future, driving up demand and boosting the price.

Despite the current optimism, there is caution among market observers. Historically, periods of heightened excitement and euphoria in the market are often followed by price retracements or consolidation. 

Bitcoin tends to mark local tops when sentiment peaks, which could signal a cooling-off period before the next major move. Investors are closely watching for signs of a potential pullback or whether Bitcoin will continue to climb toward new all-time highs in the weeks ahead.

Key Levels To Watch 

Bitcoin is trading at $67,000 after a 2% retrace from its recent local top at $68,388. Despite this slight pullback, the price is holding firmly above the previous high of $66,500, signaling a strong consolidation phase that could set the stage for another move higher.

BTC holding above $66,5K

For the bullish momentum to continue, BTC must maintain its position above $66,500. If it does, the price could soon push toward new highs. 

However, if Bitcoin fails to hold above this critical level, a healthy retrace to the daily 200-day moving average (MA) would still indicate strength in the market. The 200-day MA has historically been a reliable support level during uptrends, providing a foundation for further gains.

If the price falls below the 200-day MA, a deeper correction to $60,000 is likely. This level represents significant demand and could offer another buying opportunity before the next leg.

Featured image from Dall-E, chart from TradingView

On-Chain Metrics Reveal Bitcoin Demand Is Growing – Can BTC Break ATHs In Q4?

Bitcoin surged over 5% yesterday, following a positive day across the crypto market. This sudden price boost has sparked optimism among investors and analysts, anticipating even bigger gains in the coming months. Market sentiment is improving alongside price action, fueling hopes for a sustained rally.

Key data from CryptoQuant suggests that Bitcoin demand is rising, supporting the idea that Bitcoin could continue to climb. This growing demand and the improving market sentiment create a favorable environment for bullish momentum.

Continuing the recent price surge could set the stage for Bitcoin to reach new highs, while any hesitation might lead to further consolidation. Either way, market participants are eagerly awaiting the next major move.

Bitcoin Open Interest Reaching New Highs

After surging to test local highs, Bitcoin is at a critical turning point, setting the stage for a potential rally that has analysts and investors optimistic. 

The price has surged over 12% in less than a week, reflecting renewed bullish sentiment in the market. This upward momentum has sparked hopes of continued gains, with many speculating that Bitcoin is on the verge of a significant breakout.

Top crypto analyst and investor Ali Martinez recently shared a compelling CryptoQuant chart, revealing that Bitcoin’s open interest across all exchanges has just hit a new all-time high of $19.75 billion. 

Bitcoin open interest hist new ATH of $19.75 billion

This spike in open interest often precedes large price moves, signaling heightened activity and more capital at stake in the market. A surge in open interest suggests that traders are positioning themselves for significant price action, potentially adding more fuel to the current rally.

The data from CryptoQuant supports the growing bullish outlook for Bitcoin, as it suggests that investors and traders are increasingly confident in the asset’s near-term performance. 

Bitcoin could be on track to test new highs if this momentum continues, paving the way for a broader market rally. As the market eyes this critical juncture, the next few days will be crucial in determining Bitcoin’s trajectory.

BTC Pushing Local Highs

Bitcoin is trading at $65,600 after consolidating following yesterday’s surge to local highs. The price is eyeing the crucial $66,500 resistance level, which, if broken, could send BTC to new all-time highs.

This resistance has been a key barrier for Bitcoin, and a successful push above it would confirm the bullish momentum and likely lead to further gains.

BTC testing local highs around $66K

BTC is now trading well above its 200-day moving average (MA) at $63,336, further solidifying the positive outlook for Bitcoin in the coming weeks. Holding above this MA is a strong indicator that the bulls are in control. The market is poised for a potential rally. 

However, for Bitcoin to continue its upward trajectory, it must break the $66,500 level and set a new high.

On the downside, if BTC fails to surpass this resistance, a retrace to lower demand levels around $62,000 could occur, which would still be a healthy correction within the broader uptrend. 

The market remains optimistic, but the next few days will determine whether BTC can maintain its momentum or face a short-term pullback.

Featured image from Dall-E, chart from TradingView

Is This Bitcoin’s Last Big Drop? Expert Points To Key Indicator

In his latest video analysis titled “BITCOIN’S One Indicator Signaling LAST Major Dip,” Dan Gambardello, a noted crypto analyst with 370,000 subscribers on YouTube, delves into the latest price action of Bitcoin to forecast what could potentially be the final major dip. After dropping as low as $60,000 on Wednesday, the fear of another deeper price crash has grabbed the Bitcoin market.

Why This Could Be The Final Leg Down For Bitcoin

Gambardello emphasizes the significance of the daily and six-hour charts. On the daily chart, Bitcoin is currently testing the 50-day moving average, a level that often serves as a litmus test for short-term market sentiment.

However, the analyst’s main focus is on the six-hour chart’s Relative Strength Index (RSI), a momentum oscillator used to measure the speed and change of price movements, which has hit oversold levels. According to Gambardello, the RSI reaching oversold territory is traditionally viewed as a bullish signal, potentially indicating an approaching end to the current price dip.

“The bottom is actually, I think, close. There could be some type of capitulation in the very short term, but I think there could be a very strong bounce after that happens,” Gambardello noted, suggesting that despite the immediate market turmoil following the Israel-Iran conflict news, the fundamentals point towards an eventual robust recovery.

Via X, Gambardello added, “Nothing like a 6 hour oversold RSI at the beginning of bull season. Also great during bull season.”

Bitcoin price chart

This assertion is grounded in his analysis of past market behaviors during similar conditions, reinforcing the cyclical nature of Bitcoin’s market dynamics. Drawing parallels to historical data, Gambardello highlights the behavioral trends of Bitcoin in previous Octobers, noting a pattern of initial declines followed by strong recoveries by the end of the month.

“October will close green. It’s always [like this] with the dip. People are just freaking out. I guess that’s it, but this gives us a little time. We’re getting all these red candles going into October, give us another week, maybe even two and we could get a pump, a breakout to the upside to end October,” Gambardello claims.

Further deepening the analysis, Gambardello discusses the potential scenarios around Bitcoin’s lower trend line, a recurrent support level over the past six months. He speculates that if Bitcoin approaches this trend line again, it could effectively serve as a robust support level, potentially marking the last significant downturn before a sustained upward trend.

Notably, one final touch of the trendline could bring down the BTC price as low as $50,000. However, Gambardello thinks that this is a less likely scenario as the 6-hour RSI has already hit oversold territory while BTC is currently bouncing off the 50-day moving average.

Bitcoin price chart

Moreover, Gambardello refers to Bitcoin’s performance in past halving years, which are typically followed by bull markets, as seen in 2016 and 2020. Gambardello suggests that the current year could follow a similar trajectory. “This is a Halving year. We’ve seen what’s happened in Halving years in 2020 and 2016 in October. Is it going to repeat?”

At press time, Bitcoin traded at $60,899.

Bitcoin price

Bitcoin (BTC) Ready To Break Past $65,000, On-Chain Data Shows

Yesterday, Bitcoin (BTC) spiked over 6% following Federal Reserve Chairman Jerome Powell’s announcement that they are adjusting its policy and hinting at a potential 25bps rate cut at the next meeting on September 18. This unexpected news has fueled Bitcoin’s recent volatility, with prices swinging unpredictably in the past weeks. 

Crucial on-chain data from CryptoQuant is providing a glimmer of optimism. According to the data, traders are positioning for further price appreciation.

As the market digests the Fed’s new stance, all eyes are on Bitcoin to see if this could mark the beginning of a new bullish phase.

Bitcoin Data Showing Market Optimism

Bitcoin is trading above $63,000 and gaining momentum as it prepares to break past the critical $65,000 mark. 

On-chain data from CryptoQuant reveals growing market optimism, highlighting a significant trend that could drive prices higher. Specifically, Bitcoin exchange reserves on centralized exchanges have plummeted to an all-time low. Since the end of July, the supply of BTC on exchanges has decreased from over 2.75 million to approximately 2.67 million, representing a 3% drop in just 30 days.

Bitcoin Exchange Reserve - All Exchanges

This decline indicates that less BTC is available for trading on exchanges, which could create a supply shock, a situation where demand outstrips supply, leading to a potential price surge. As Bitcoin’s availability on exchanges diminishes, the likelihood of a price increase grows.

With Bitcoin starting to gain strength, the market is closely monitoring this trend, potentially pushing Bitcoin into new bullish territory.

BTC Price Action: $65,000 Next?

After two weeks of volatility and consolidation, Bitcoin is currently trading at $64,100 at the time of writing, holding above the crucial daily 200 Moving Average (MA).

This level is essential for bulls to maintain the uptrend in a higher time frame. For the price to break past the $65,000 mark, it must confirm its bullish structure by holding above the $57,500 level. Ideally, staying above the daily 200 Exponential Moving Average (EMA), which sits at $59,538, is preferable.

BTC close above the daily 200 MA.

These levels are vital for establishing continued upward momentum. Holding above them would signal strength in the market, reinforcing confidence among traders and investors. The data of declining Bitcoin exchange reserves and the central bank’s policy announcement have been met with optimism. Investors are increasingly expecting a Bitcoin rally in the coming months, fueled by these bullish indicators.

Cover image from Dall-E, chart from TradingView.

Market Expert Predicts New Paradigm For Bitcoin: ‘Days Under $100,000 Numbered’

As the Bitcoin (BTC) Halving event concluded for the fourth time, the cryptocurrency market witnessed notable changes in key metrics. 

These developments have led Charles Edwards, a market expert and founder of Capriole Invest, to issue bold predictions that hint at a paradigm shift in the BTC market. 

Bitcoin Trading At ‘Deep Discount’

One of the key metrics highlighted by Edwards is the staggering electrical cost associated with mining a single Bitcoin. Edwards reveals that this cost has now reached an astonishing $77,4000. This figure represents the raw electricity expenses required to power the Bitcoin network for every newly mined BTC.

Another significant metric that Edwards draws attention to is the Bitcoin Miner Price, which soared to $244,000 on Saturday. This metric encompasses the block reward and fees miners receive for every Bitcoin they successfully mine. 

Notably, this surge in miner price coincided with transaction fees skyrocketing to $230, marking a four-fold increase compared to the previous all-time high of $68 set in 2021.

Bitcoin

Considering the metrics above, Edwards suggests that BTC currently trades at a “deep discount.”  This is because BTC’s price is lower than the electrical costs of mining it.

Typically, this situation only lasts for a few days every four years, suggesting that the price will only take a short time to catch up and surpass this price level, which is slightly below BTC’s all-time high (ATH) of $73,7000, reached on March 14th. 

Edwards outlines three possible outcomes in the wake of these developments. First, he anticipates a scenario in which the price of Bitcoin experiences a significant surge. 

Secondly, there is a likelihood that approximately 15% of miners may be forced to shut down due to unfavorable economics. Finally, Edwards suggests that average transaction fees are expected to remain substantially higher.

Based on the analysis of these metrics and the potential scenarios, Edwards boldly predicts that Bitcoin’s days under the $100,000 mark are “numbered.” While it remains to be seen which of the three outcomes will prevail, Edwards expects a combination of all three factors to contribute to Bitcoin’s price appreciation.

Optimal Buying Opportunity? 

Bitcoin has demonstrated significant price consolidation above the $60,000 mark since Friday, following temporary drops below this threshold amid mounting anticipation for the Halving event. 

Crypto analyst Ali Martinez recently analyzed Bitcoin’s current price state, suggesting that a potential bottom may have formed above these levels, increasing the likelihood of surpassing upper resistance levels shortly.

According to Ali Martinez’s analysis, Bitcoin strives to establish the $66,000 price level as a crucial support zone. Data reveals that approximately 1.54 million addresses collectively purchased 747,000 BTC at this level. If Bitcoin successfully secures this support, it may pave the way for further upward movement.

Martinez identifies Bitcoin’s next critical resistance levels, between $69,900 and $71,200. These levels represent significant price barriers for BTC bulls, and Bitcoin may encounter selling pressure at these levels. 

In addition, the analyst points out that the Bitcoin MVRV ratio, a metric that compares the market value of Bitcoin to its realized value, has shown a promising pattern, as seen in the chart below. 

Bitcoin

Martinez highlights that whenever the MVRV ratio falls below its 90-day average since November 2022, it historically indicates an optimal buying opportunity for Bitcoin. Interestingly, such buying opportunities have resulted in average gains of approximately 67%.

According to Martinez, based on current market conditions and an analysis of the MVRV ratio, now may be an opportune time to consider buying Bitcoin. The historical data and the potential for significant price appreciation support this view. 

Bitcoin

BTC is trading at $66,100, up 1.6% in the past 24 hours. 

Featured image from Shutterstock, chart from TradingView.com

Can Bitcoin Overcome Past Trends? Examining The Pre-Halving Rally And Resistance Levels

Bitcoin (BTC), the largest cryptocurrency in the market by trading volume and capitalization, has embarked on a renewed bullish uptrend, reclaiming previously lost territories and surpassing resistance levels, igniting optimism among investors. 

Currently trading just below its 25-month high of $49,000 at $47,900, Bitcoin has experienced a remarkable price increase of over 6% within 24 hours and a significant 11% surge over the past seven days. 

Mapping BTC’s Path Amidst Pre-Halving Rally

However, amidst the market’s excitement, it is crucial to consider historical tendencies and their potential impact on Bitcoin’s trajectory leading up to the upcoming halving event. Market expert and analyst Rekt Capital highlights two noteworthy historical patterns:

Firstly, the “Pre-Halving Rally” phase appears to be commencing. This phase refers to a period where Bitcoin experiences a surge in price before the halving event takes place. 

Secondly, historical data reveals that Bitcoin has struggled to break beyond the macro diagonal resistance before the halving, which Rekt places at $47,000. Additionally, it has encountered difficulty surpassing its Four Year Cycle resistance, which is approximately $46,000 in the current cycle.

It is worth noting that even though the price has surpassed these resistance levels, a consolidation or continuation of the uptrend must be seen, as a retracement could take place and leave the BTC price stuck between these resistances.

Bitcoin

Given these historical trends, exploring how Bitcoin could potentially reconcile these patterns is interesting. Rekt Capital offers insights into one possible path that Bitcoin could take:

During the pre-halving rally phase, Bitcoin may produce limited upside, resulting in an upside wick at the end of February. This pattern has been observed in previous months and 2019. 

Following this, Bitcoin might establish another range at higher price levels in March, potentially allowing altcoin rallies to take center stage. Finally, a few weeks before the halving event, Bitcoin could experience a pullback, creating a pre-halving retrace.

This proposed path suggests that Bitcoin could surpass the Macro Diagonal resistance with an upside wick but remain below it in terms of end-of-month monthly candle closes during this gradually concluding pre-halving period.

Bitcoin Bull Run Indicator Flashing Buy Signal

Crypto analyst Ali Martinez has added to the growing bullish sentiment surrounding Bitcoin by highlighting a key indicator that suggests potential upside movement. 

According to Martinez, the Super Trend indicator flashed a buy signal on the BTC monthly chart. This tool is renowned for its precision in predicting bullish trends in Bitcoin markets.

The indicator’s track record underscores the significance of this buy signal. Martinez points out that the Super Trend has issued four buy signals since Bitcoin’s inception, and all four have been validated, leading to substantial gains. These gains amount to an impressive 169,172%, 9,900%, 3,680%, and 828%, respectively.

Bitcoin

However, amidst the bullish outlook, Martinez also highlights a potential strategy that may soon impact Bitcoin’s price.

According to the Bitcoin liquidation heatmap, a scenario is unfolding where liquidity hunters could drive the price of Bitcoin down to $45,810. The intention behind this move would be to trigger liquidations amounting to a substantial $54.73 million.

It is important to understand that liquidity hunters aim to exploit price movements to trigger forced liquidations among overleveraged traders. By strategically driving the price down, they can force these traders to sell their positions, resulting in cascading liquidations that potentially amplify price downward movements.

Bitcoin

Featured image from Shutterstock, chart from TradingView.com