$96k Or $144k? Bitcoin Mayer Multiple Chart Price Target Options

Bitcoin (BTC) has registered a slight uptick in the last few hours after US President Donald Trump announced a successful airstrike on Iranian nuclear facilities, a move aimed at de-escalating rising tensions in the Middle East after several days of conflict between Iran and Israel.

Despite the short-term price reaction, BTC remains in a corrective phase, having struggled to break through the $110,000 resistance level over the past month with market sentiment being largely shaped by both global uncertainty and technical stagnation.

Amid this backdrop, a crypto analyst with X pseudonym On-Chain College has highlighted two prospective price targets based on on-chain data.

Market Odds Favor Further Upside For Bitcoin – Analyst

In a recent X post on June 21, On-Chain College shares a positive long-term Bitcoin price outlook using the Mayer Multiple, an on-chain metric that measures relationship between Bitcoin’s price and its 200-day moving average (200DMA).

By tracking key valuation bands, the Mayer Multiple helps determine whether Bitcoin is overvalued, undervalued, or fairly valued, based on historical price behavior. Since the bull market commenced in Q4 2024, Bitcoin has consistently moved between 1.0x band i.e. the 200DMA (blue line) and the 1.5x band (orange line) representing the mid price range zone. 

Bitcoin

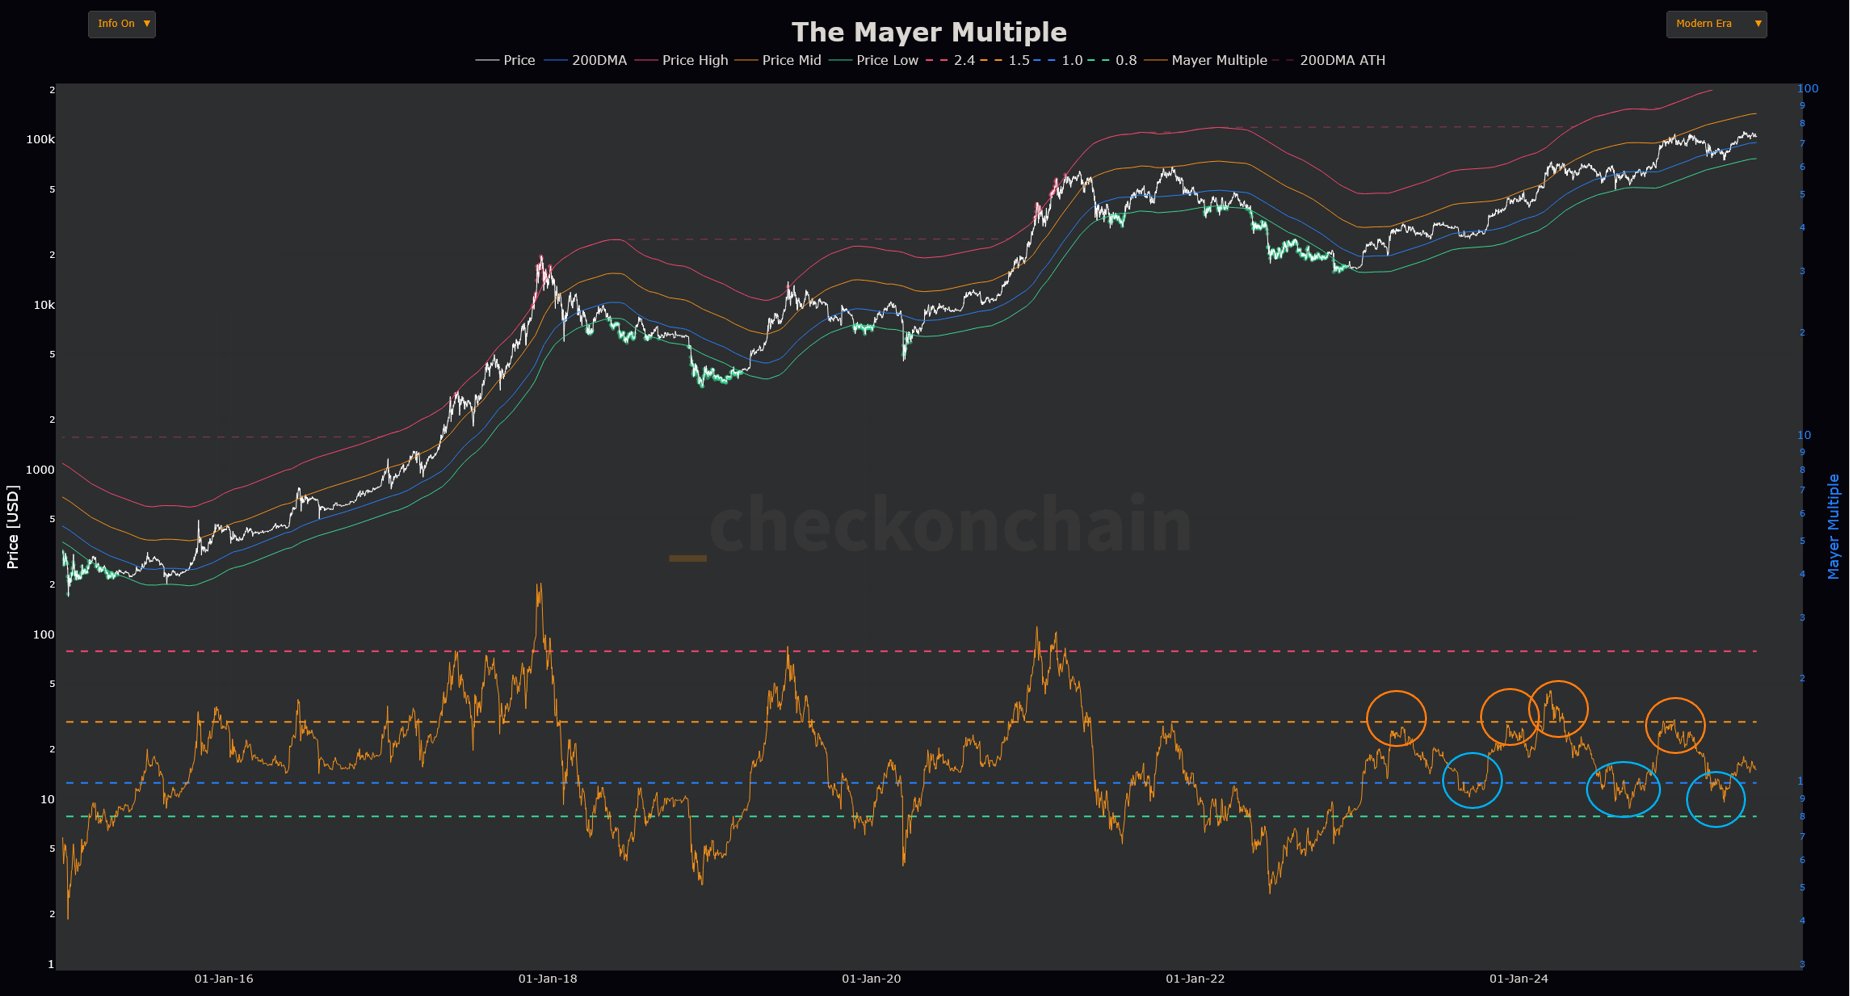
Notably, the Bitcoin price struggles in the past have generated speculations of potential market top at the current market high. However, the Mayer Multiple chart shows that BTC has only ever attained a cycle price peak after hitting the 2.5x band (red line). Therefore, there is still room for price growth in the current bull market.

However, the immediate price targets for premier cryptocurrency lies at $96,000 (1.0x) or $144,000 (1.5x). Notably, there is significant potential to rediscover its bullish form and surge towards $144,000 in line with its defined-range bound movement. However, there are also equal chances of a return to $96,000 which On-Chain College states would aid in flushing out weak hands before a full-scale bullish price reversal.

Bitcoin Price Outlook

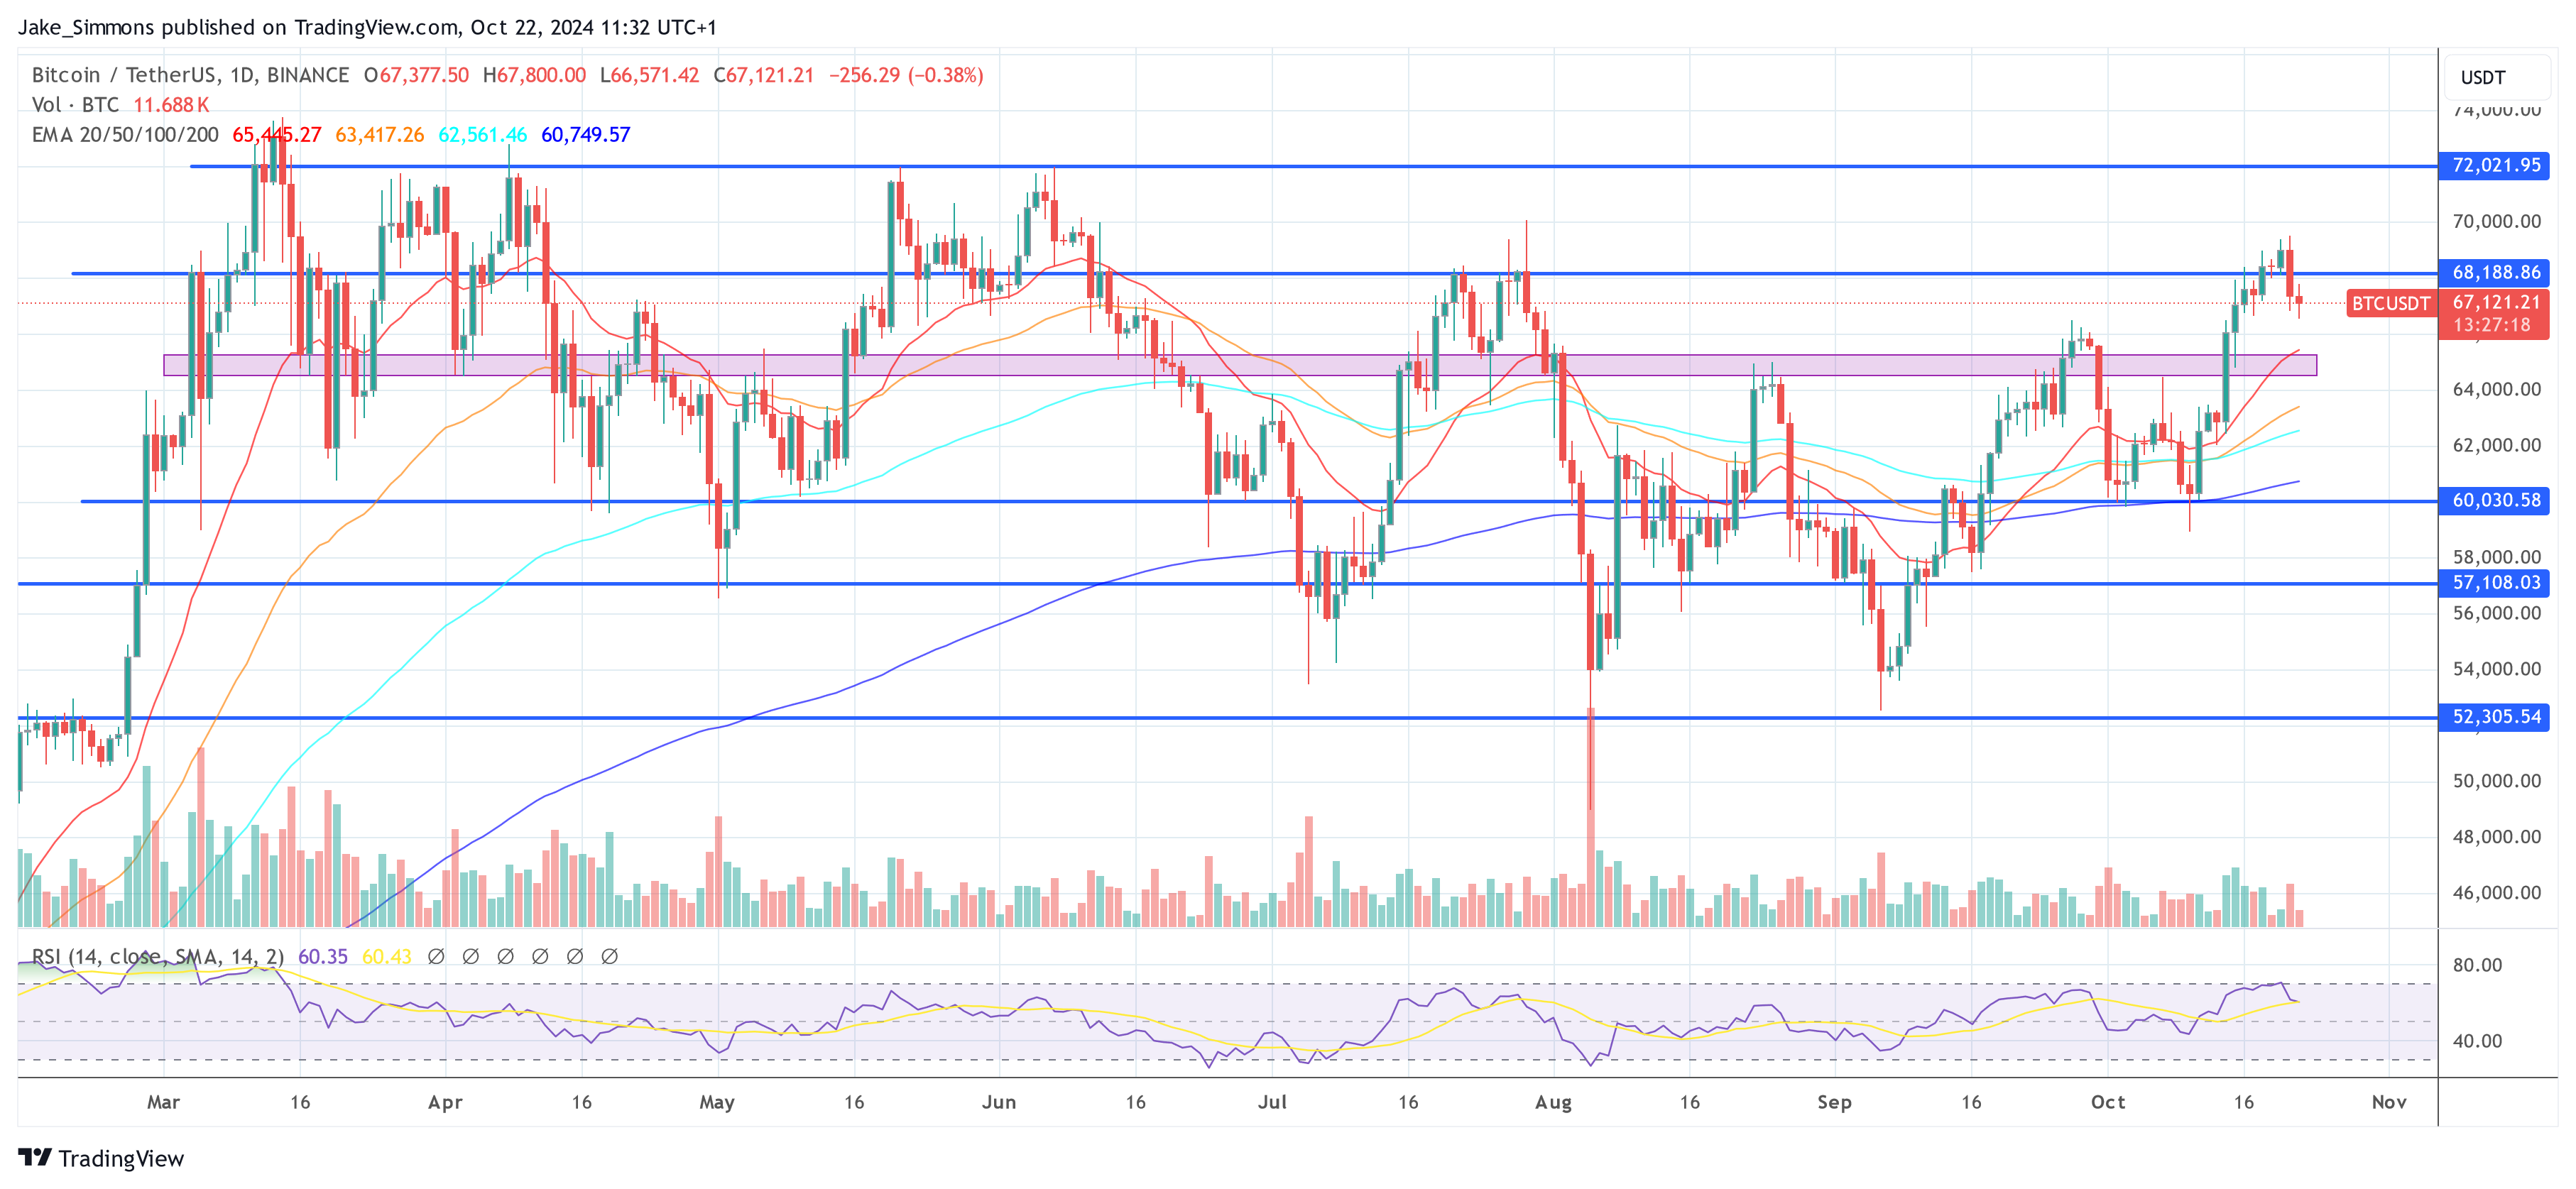
At the time of writing, Bitcoin is valued at $102,700 following a 1.50% decline in the last 24 hours. Meanwhile, the maiden cryptocurrency also reports losses of 2.94% and 8.08% on the weekly and monthly chart, respectively.

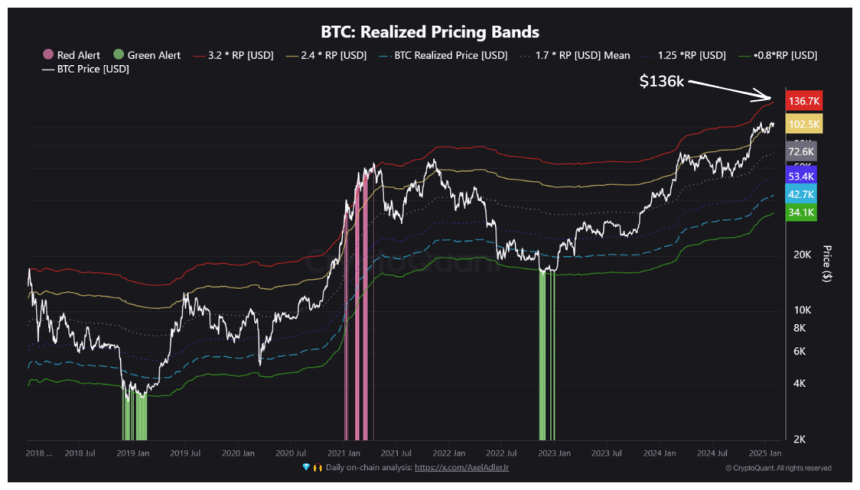
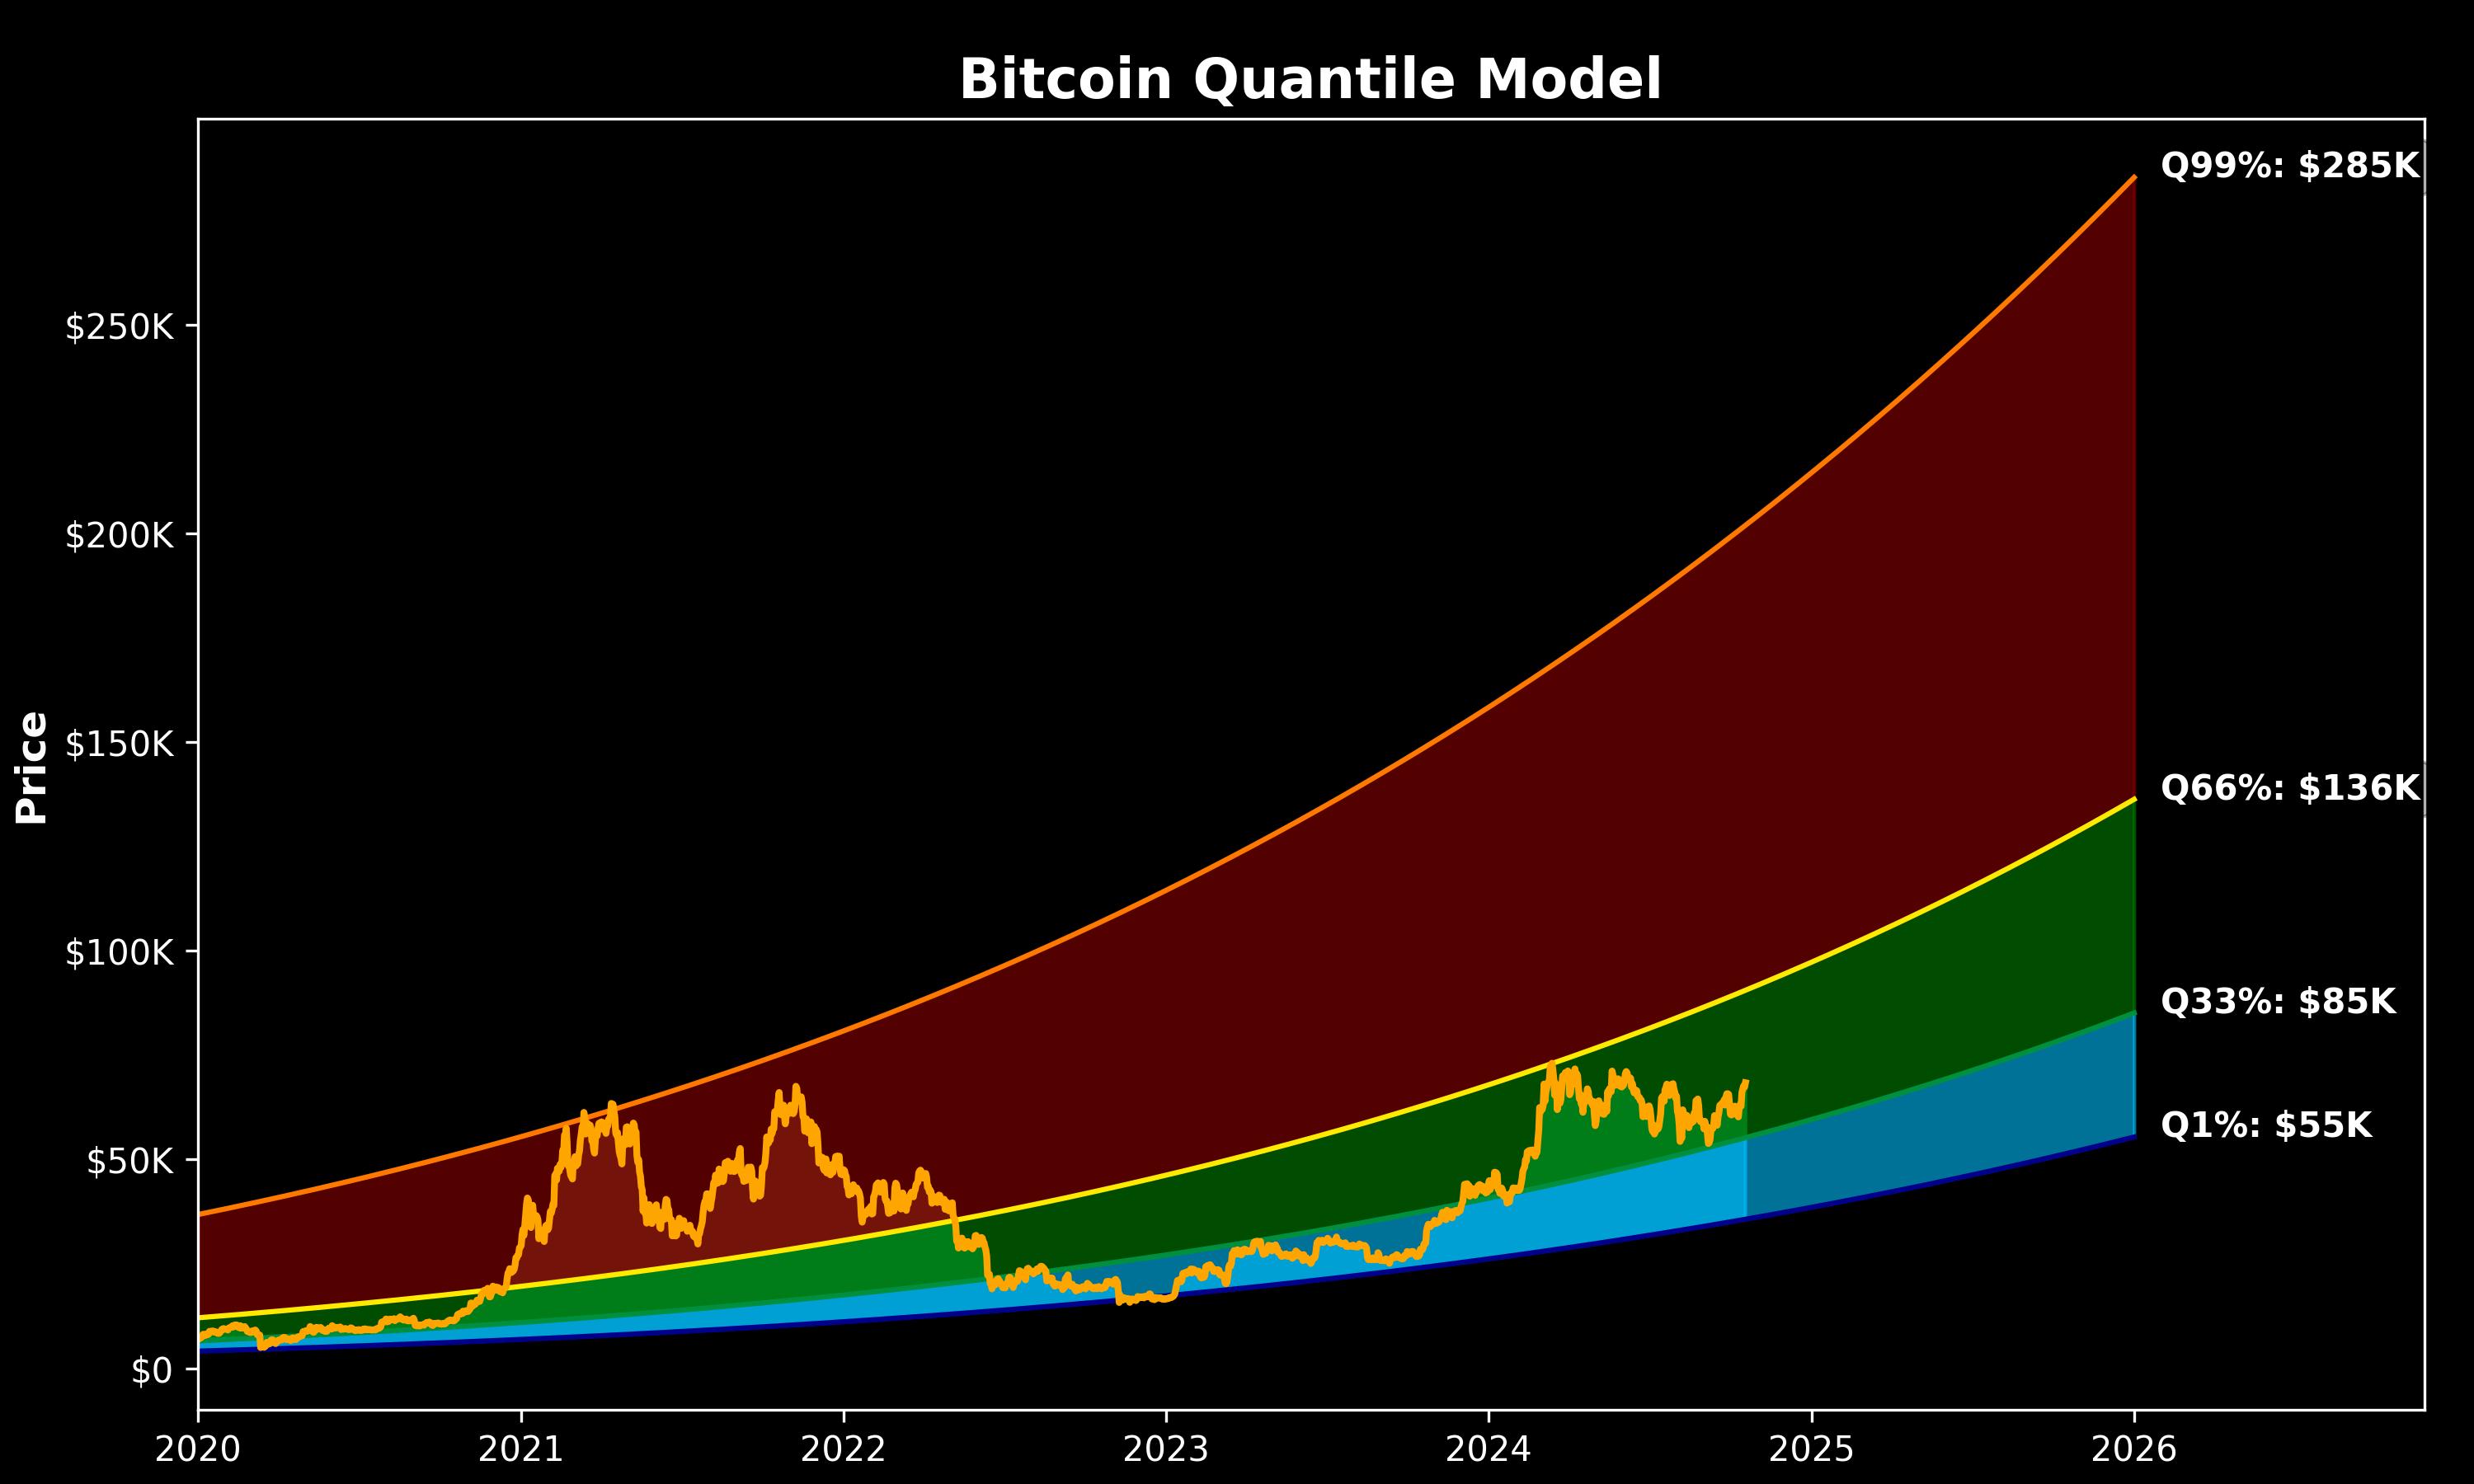
According to CoinCodex, the general market sentiment remains neutral. However, CoinCodex analysts foresee an impending price breakout with an audacious projection of $136,472 within the next five days. Interestingly, it’s worth noting that this level may represent or come close to the cycle market top, as long-term forecasts include $138,379 in three months and $116,115 in six months.

Bitcoin

Featured image from Pexels, chart from Tradingview

Bitcoin’s $10,000 Stairway: Chart Signals March Toward $115,000

In the last week, Bitcoin showed a range-bound movement, with prices oscillating between $105,000 and $101,000 to produce a slight gain of 0.60%. Notably, the flagship cryptocurrency has seen a market cool-off in the past two weeks following a 10.7% price leap in early May. Interesting, a crypto analyst with X handle TATrader_Alan, popularly known as Trader Alan, has highlighted a bullish pattern that points to a price target around $115,000.

Bitcoin Climbs With Precision: $115,000 May Be The Next Stop

Amidst an extended crypto market correction in 2025, Bitcoin prices crashed from $109,000 in January to less than $75,000 in mid-April. Since hitting the local bottom at $74,600, the premier cryptocurrency has recorded an impressive market rebound, rising by over 39.1% in the past month to hit a local peak of $105,800.

In an X post on May 16, Trader Alan provided an interesting technical insight into this uptrend, highlighting that Bitcoin has repeatedly produced the same leap in dollar value, separated by a period of consolidation. The trading chart from the analyst explains that when Bitcoin surges approximately $10,000, it enters a 7-10 period of sideways consolidation before resuming its ascent.

Bitcoin

This bullish behaviour has been repeatedly seen with Bitcoin’s leap from $75,000 to $85,000, then to $95,000, and $105,000. Going by this pattern, the crypto market leader is tipped to hit the $115,000 target following a potential breakout from its current price consolidation. If this projection realizes, Bitcoin would achieve a 10.57% gain from current prices, breaking into a new price discovery.

This kind of price movement is characteristic of a strong uptrend marked by healthy pauses. The consolidations typically allow the market to cool off after sharp runs, allowing traders to accumulate in preparation for the next leg higher. Importantly, these consolidation zones often act as new support levels, strengthening the bull market structure.

Bitcoin Whales Keep Stacking

In other developments, top OKC Partner and Binance KOL Ted Pillows reports that the Bitcoin whales are maintaining an impressive accumulation streak. On May 15, the largest Bitcoin holders acquired an additional 2,180 BTC valued at $226,750,000, signaling a strong market confidence.

Generally, large accumulations by Bitcoin whales are a typical bullish signal, especially amidst the current uptrend, signalling a strong potential for future price appreciation in line with Trader Alan’s prediction.

At press time, Bitcoin continues to trade at $103,281 following a 0.90% decline in the last day. In tandem, the asset’s trading volume is down by 15.76%, suggesting a decline in market interest. 

Bitcoin

Analyst Explains Bitcoin’s Path To $150,000 – Details

The Bitcoin (BTC) market recorded more losses than gains in the past week resulting in a net price decline of 2.37%. Nevertheless, investors and market experts alike remain highly bullish on the premier cryptocurrency’s potential for substantial gains amidst the current bull run.

Bitcoin Ready For $150,000 Price Target – Analyst

In a Quicktake post on CryptoQuant, an analyst with username Percival has touted Bitcoin to achieve a $150,000 price in the current bull cycle. Commenting on the present market state which might be unsettling to certain investors, Percival states that Bitcoin’s price trajectory, marked by sharp upward spikes and periods of consolidation, resembles the structural dynamics of any mature financial asset.

In regards to future price movement, the analyst references a Fibonacci expansion from Bitcoin’s cycle low at $15,450 in November 2022 to the consolidation at $48,934 in 2024. In translating this historical data to the current market, Percival identifies a Bitcoin price target between $136,000 – $150,000 which is further supported by data from Bitcoin Realized Price Bands – a market metric that analyses supply based on different buying levels.

Bitcoin

However, for Bitcoin to trade at $150,000, the asset must attain a total market cap of $3 trillion. Currently, there is strong historical data in support of this postulation. For context, Percival explains that Bitcoin Realized Cap rose by 470% in the previous bearish cycle in 2021. Presently, the realized Cap has only grown by 111% suggesting more potential for market growth.

Furthermore, the analyst identifies possible sources of demand to drive up the projected  $3 trillion market expansion, one of which is the US Bitcoin Spot ETFs.

Notably, these investment funds registered nearly $40 billion in inflow during their debut trading year in 2024.  With the US expected to adopt a pro-crypto stance in the Donald Trump administration, institutional demand is also likely to surge stronger through these ETFs. In addition, Percival includes the Bitcoin Futures market which is currently valued at $95 billion as another potential bullish driver for the projected market expansion

BTC Price Overview 

At the time of writing, Bitcoin trades at 102,334 reflecting a 1.66% decline over the last day. However, the flagship cryptocurrency is up by 7.93% on its monthly chart after a strong positive performance in January.

According to data from the prediction site CoinCodex, market sentiments remain bullish with the Fear & Greed Index of 76 which indicates extreme greed among investors. Looking forward, the analysts at Coincodex predict Bitcoin could trade at $113, 658 and $132,823 in the next five and thirty days respectively. In particular, they project the digital asset to have crossed $150,000 in the next three months.

Bitcoin

Bitcoin MVRV Hints At $85,000 Price Target On This Condition – Details

Bitcoin, the world’s largest digital asset, recorded significant market gains in the past week to resume an uptrend that began in early October. Data from CoinMarketCap shows that Bitcoin rose by 10.58% in the past week as pro-crypto candidate Donald Trump emerged as US President-elect on November 5, followed by a 25 bps rate cut by the US Federal Reserve.

With the crypto market leader recording new all-time highs each day, analyst Ali Martinez has dropped a new price target that hinges on a certain condition.

Bitcoin Must Stay Above $71,480 – Here’s Why

Amidst the current Bitcoin price rally, Ali Martinez predicts the digital asset could reach a local price peak of $85,360. However, this price action can only occur if BTC’s value does not decline below $71,480 based on data from the MVRV Deviation Pricing Bands, a trading tool used to identify extreme bullish and bearish market conditions based on the Market Value to Realized Value (MVRV).

Martinez’s latest insight on Bitcoin’s trajectory follows a previous prediction in which the analyst forecasted the premier cryptocurrency to retrace to around $71,500 after hitting the $78,000 price mark.  With Bitcoin within range of this price target following its recent tourney across $77,000, it is imperative that the market bulls prevent any potential retracement below $71,480, which may result in a further decline to $66,000 at which lies its next major resistance. 

Alternatively, Bitcoin is also well poised to push beyond $78,000, reaching Martinez’s target of $85,360 without experiencing any projected price pullback as market sentiments remain highly bullish due to multiple factors. 

Aside from Donald Trump’s resounding electoral victory which signals an incoming crypto-friendly approach by the US Government, high inflows into the Bitcoin Spot ETFs over the past weeks have also boosted investors’ confidence in Bitcoin’s continuous profitability. Nevertheless, all investors are admonished to remain vigilant as the crypto market is subject to high levels of volatility and sudden price movements.

BTC Social Narrative Backs Potential Retrace

In other news, data from analytics firm Santiment shows that Bitcoin’s rise above $77,000 has induced a change in the social narrative as the general crypto community is anticipating a continuous rise to $80,000. 

According to Santiment, whenever crypto enthusiasts have been overly eager about $80,000 in the past month, Bitcoin has experienced a price retrace. Therefore, there is a need to reduce growing notions around FOMO in order to allow Bitcoin to maintain its current price rally.

At the time of writing, Bitcoin trades at $76,395 reflecting a gain of 0.49% in the past 24 hours.

Bitcoin

Expert Sets $285,000 Bitcoin Price Target Based On Quantile Model

Sina—a professor, consultant, and co-founder & COO of 21stCapital.com—is projecting that the Bitcoin price could rise as high as $285,000 by the end of 2025 in a new analysis shared on X. Utilizing a quantile regression model, Sina identifies distinct phases in Bitcoin’s market cycle.

Can Bitcoin Price Skyrocket Above $200,000?

The model identifies the Cold Zone (<33%) as the price range between $55,000 and $85,000. This zone represents the lowest possible range by the end of 2025 and suggests a period ideal to “aggressively accumulate.”

The Warm Zone (33-66%), spanning from $85,000 to $136,000, marks a period where the market gains momentum, and mainstream attention intensifies. During this phase, rapid price growth is expected as the “train leaves the station.” Sina recommends a standard accumulation strategy here, such as dollar-cost averaging (DCA), to steadily increase holdings.

The most critical phase, the Hot Zone (>66%), ranges from $136,000 to $285,000. This zone is characterized by heightened volatility and significant price swings as mass adoption peaks and leveraged positions become prevalent.

Bitcoin Quantile Model

While there is substantial room for upside, the risk of reversals escalates rapidly. Sina advises investors to either hold and enjoy potential gains or consider gradually exiting positions based on risk assessments, particularly since historical tops occur in the 90th to 99th quantile range. Notably, the 90th quantile starts at $211,000.

What astonishes Sina is how these 33% quantile ranges align seamlessly with Bitcoin’s historical phase transitions. He notes that Bitcoin tends to spend exactly one-third of its time in each zone before transitioning to the next, almost like clockwork. This pattern means that most of the bear market occurs below the 33% quantile, while bull market euphoria begins above the 66% quantile.

Renowned crypto analyst PlanC (@TheRealPlanC) acknowledged Sina’s model, commenting that it is a “perfect explanation—super clear.” Sina, in turn, credited PlanC for the foundational work that influenced his own model.

PlanC has also recently updated his “Power Law Probability Model,” which forecasts Bitcoin prices ranging from $189,733 to $245,264 for the 97% to 99.9% quantile and $145,182 to $189,733 for the 90% to 97% quantile. He emphasizes that despite appearances, the underlying data follows a power-law relationship, independent of how it’s plotted—be it linear, log-linear, or log-log scales.

Power Law Probability Model

“The data follows a log-log relationship with quantile regressions, whereas the rainbow chart uses logarithmic regression with a log-linear relationship. […] I am not ‘drawing’ these lines. These are quantile regressions of the log of price vs. time, based on all the data we have to date,” he explains.

To contextualize the model’s predictive capabilities, PlanC elaborates on the significance of various quantiles. The 99.9% quantile means the price has been above this line only 0.1% of the time, equating to just one day out of every 1,000 days—a very rare event. The 99% quantile indicates the price has exceeded this line 1% of the time, or one day out of every 100 days, also considered rare. Conversely, the 0.1% quantile reflects that the price has fallen below this line only 0.1% of the time.

At press time, BTC traded at $67,121.

Bitcoin price

Is $77,600 The Next Step For Bitcoin? On-Chain Pricing Model Hints So

Data from a Bitcoin pricing model based on an on-chain indicator suggests that $77,600 may be the level where the asset will see its next peak.

Bitcoin MVRV Pricing Bands Could Provide Hints About What’s Next

In a new post on X, analyst Ali discussed what the Market Value to Realized Value (MVRV) Pricing Bands model could suggest about the cryptocurrency’s future.

The MVRV ratio is a popular on-chain indicator that compares the Bitcoin market cap and realized cap. The former is just the total valuation of the asset at the current spot price, while the latter is a model that calculates the asset’s cap by assuming the “true” value of any coin in circulation is the price at which it was last transferred on the blockchain.

The previous transfer of any coin on the network was likely the last time it changed hands, and thus, the price at that time would be its current cost basis. As such, the realized cap keeps track of the sum of the cost basis of every investor in the market.

Therefore, the MVRV ratio tells us how the value the investors hold (the market cap) compares against the value they put in (the realized cap).

Based on this indicator, the on-chain analytics firm Glassnode has developed a pricing bands model. Below is a chart showing what these pricing bands look like.

Bitcoin MVRV Pricing Bands

The pricing bands in this model represent levels corresponding to a specific deviation from the mean for the MVRV ratio. From the chart, it’s visible that the cryptocurrency is currently above the price level, corresponding to a +0.5 standard deviation (SD) from the mean for the indicator.

More specifically, the price level around $65,100 would be where the MVRV ratio would be +0.5 SD above its mean. The next major pricing band in this model is +1 SD, which currently corresponds to around $77,600.

In the past, this level has been where at least local tops have been probable to form for BTC. As is visible in the graph, the rally top back in March also occurred when BTC broke this level.

“Based on the MVRV Pricing Bands, if Bitcoin continues to trade above $65,125, the next local BTC top before a brief correction could be around $77,593!” notes the analyst.

From the current spot price of the cryptocurrency, a potential rally to a new all-time high of $77,593 would mean an increase of more than 11% for the asset. It now remains to be seen how the asset’s price will develop from here and whether it will be able to maintain above the +0.5 SD MVRV level.

BTC Price

Since its sharp surge earlier, Bitcoin’s bullish momentum appears to have cooled off as the asset has fallen to sideways movement around the $69,700 mark.

Bitcoin Price Chart

CryptoQuant Founder Puts $112,000 Target For Bitcoin This Year

The founder of on-chain analytics firm CryptoQuant has said Bitcoin could reach a target of $112,000 this year driven by the ETF inflows.

Bitcoin May Hit $112,000 Based On Inflows Into The ETFs

In a new post on X, CryptoQuant CEO and founder Ki Young Ju talked about the outlook of the cryptocurrency based on the inflows going towards the spot exchange-traded funds (ETFs).

The analyst has used the “Realized Cap” indicator to find price targets for the coin. The Realized Cap refers to a capitalization model for Bitcoin that calculates the total valuation of the asset by assuming that the real value of any coin in circulation is the price at which it was last transacted on the blockchain.

If the previous transaction of any token is assumed to have involved a change of hands for it (that is, buying and selling took place), then the last transfer price would correspond to the cost basis of the coin.

As the Realized Cap essentially adds up the cost basis of all the investors, one way to look at the metric is as a measure of the total amount of investment the holders have put into the coin.

Naturally, the Realized Cap pushes up as trades occur at a higher spot price. Something that could be particularly influential for the Realized Cap this cycle may be the spot ETF inflows.

The spot ETFs, which finally got approval from the US Securities and Exchange Commission (SEC) last month, have been buying up Bitcoin at relatively high prices to add to their holdings, thus elevating the Realized Cap.

The chart below shows the data for the holdings of the spot ETFs and the Bitcoin Realized Cap.

Bitcoin ETF Holdings

“Bitcoin market has seen $9.5B in spot ETF inflows per month, potentially boosting the realized cap by $114B yearly,” explains Ju. “Even with $GBTC outflows, a $76B rise could elevate the realized cap from $451B to $527-565B.”

The Market Value to Realized Value (MVRV) ratio may provide some hints regarding how the Realized Cap could be relevant for the spot price. This indicator tracks the BTC Market Cap and the Realized Cap ratio.

“Historically, BTC market bottoms occur at an MVRV of 0.75 and tops at 3.9,” notes the CryptoQuant founder. Based on this fact, the table below shows that ceiling and floor prices can be defined for the asset.

Bitcoin Target

As the spot ETF inflows continue to come in, the Realized Cap will only push further up, and the potential ceiling of the cryptocurrency will also thus increase.

Bitcoin Realized Cap

“With current spot ETF inflow trends, the top price could reach $104k-$112k,” says the CryptoQuant CEO. “Without hype, maintaining the current level of 2.07, the price would be $55-59k.”

In the best-case scenario, if Bitcoin had reached the $112,000 target, the cryptocurrency would have jumped more than 126% from the current spot price.

BTC Price

At the time of writing, Bitcoin is trading at around $49,400, up over 15% in the past week.

Bitcoin Price Chart