Bitcoin Struggles Below ATH After Weeks Of Failed Attempts – $109K Level In Focus

Bitcoin has been consolidating in a wide range between $100,000 and $112,000, facing heightened volatility driven by rising geopolitical tensions in the Middle East and growing macroeconomic uncertainty. Despite these external pressures, Bitcoin has held strong above the six-figure mark, signaling resilience as it prepares for a decisive move. Market sentiment is cautiously optimistic, with many traders expecting a breakout in the coming weeks.

Top analyst Daan shared a technical analysis highlighting that Bitcoin is now trading just below its all-time high, but continues to face strong resistance around the $109,000–$112,000 zone. Price has tested this level multiple times over the past month, but each attempt has failed to produce a confirmed breakout. During this period, altcoins have suffered sharp drawdowns, with many falling between 10% and 50%, underscoring Bitcoin’s dominance and investor focus.

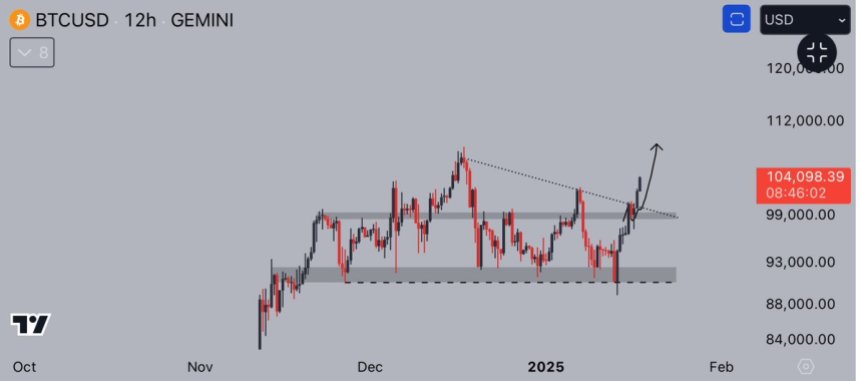
Despite the rejections, bullish momentum is gradually building. Bitcoin’s ability to stay elevated in such a volatile environment suggests that buyers are accumulating, waiting for the right moment to push higher. A confirmed breakout above resistance could trigger a sharp move into price discovery, while failure to hold key support may lead to deeper consolidation before the next leg up.

Bitcoin Bulls Push Toward Breakout

Bitcoin has gained over 15% since early May, extending a bullish trend that began in April when the price rebounded sharply from the $75,000 level. Since then, buyers have remained in control, consistently defending higher lows and reclaiming key technical levels. This steady rise in momentum has fueled speculation that Bitcoin may soon break into new all-time highs, as market sentiment improves and capital continues flowing into crypto.

Analysts are now closely watching the $110,000–$112,000 resistance zone—a level that has held strong despite multiple breakout attempts. Daan noted that Bitcoin is trading just below its all-time high, but has already faced several failed moves above this barrier. Over the past month, price has hovered near resistance, yet hasn’t delivered a confirmed breakout. During this period, altcoins have struggled, with many dropping between 10% and 50%, further highlighting Bitcoin’s dominance and traders’ caution.

Bitcoin consolidates below ATH | Source: Daan on X

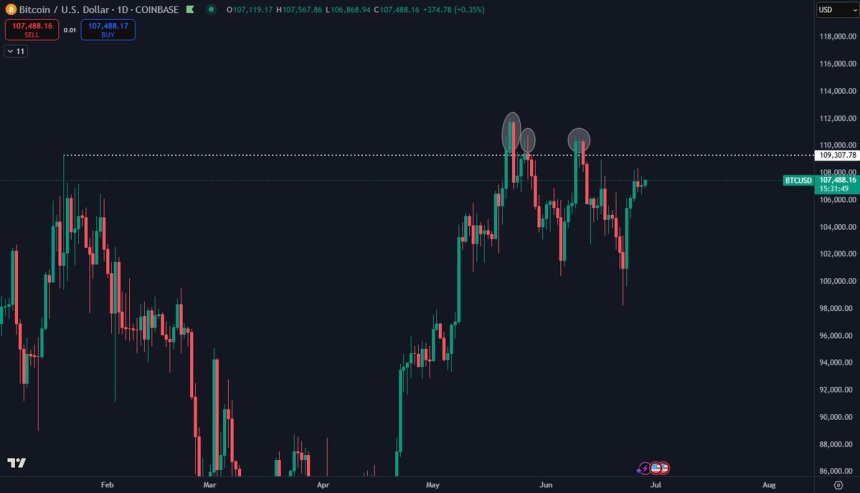
While the setup looks bullish, risks remain. A proper breakout will require not just a brief wick above $110K, but a strong weekly close or at least two consecutive daily closes above resistance. Until then, it’s wise to stay patient. Chasing before confirmation can lead to getting caught in a false breakout. Once Bitcoin breaks and holds above this level, the probability of a larger move increases significantly.

In the meantime, Bitcoin’s ability to hold near highs while absorbing macro volatility and altcoin weakness is a strong sign of underlying demand. Momentum is building—but timing matters. A confirmed breakout will be the signal that the next leg up is ready to begin. Until then, smart traders are watching and waiting.

BTC Weekly Chart Shows Strong Structure

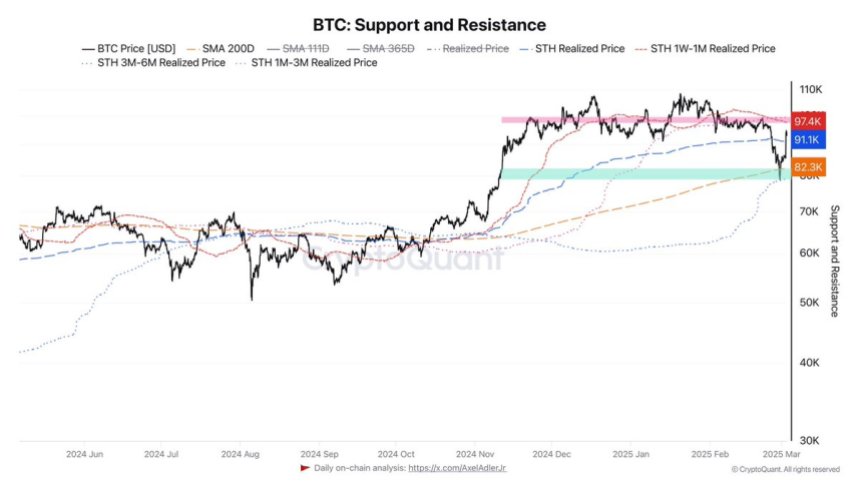
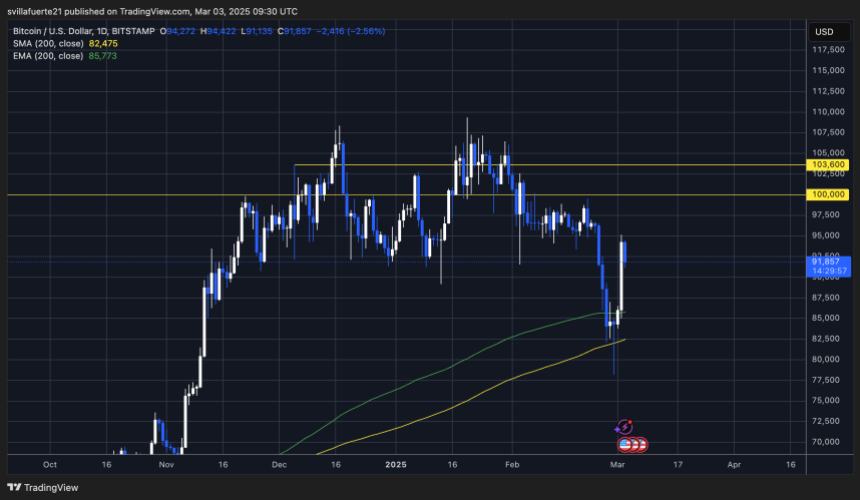
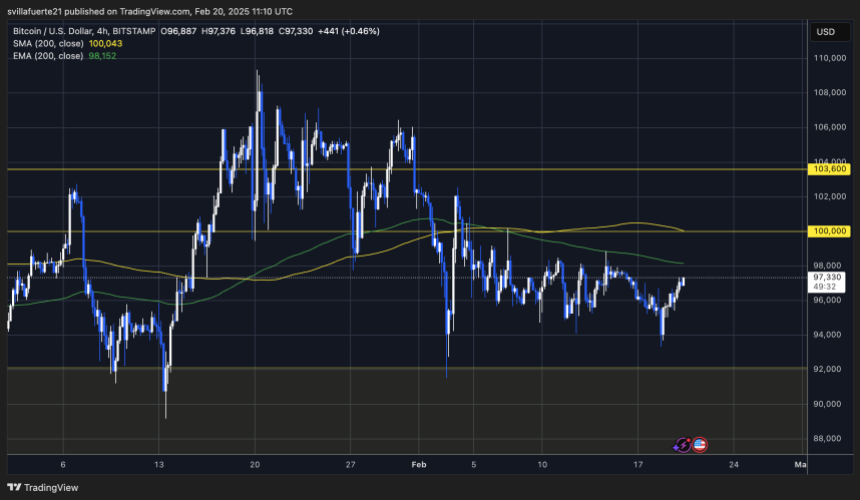
Bitcoin is currently trading at $107,319 on the weekly chart, continuing to hover just below the crucial $109,300 resistance level. Despite multiple attempts, BTC has failed to close a weekly candle above this zone—a critical milestone needed to confirm a breakout and signal the next phase of upward momentum. The $103,600 level now serves as strong weekly support, holding firm through recent pullbacks.

BTC testing key weekly resistance | Source: BTCUSDT chart on TradingView

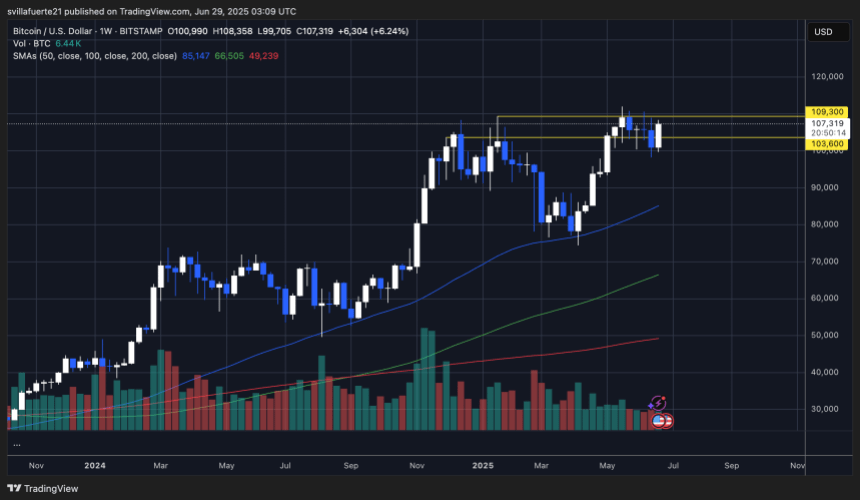
The long-term structure remains bullish. Price continues to trend above all major moving averages, including the 50-week SMA ($85,147), the 100-week SMA ($66,505), and the 200-week SMA ($49,239), all of which are sloping upward. This alignment reflects solid long-term strength, even as Bitcoin consolidates just below all-time highs.

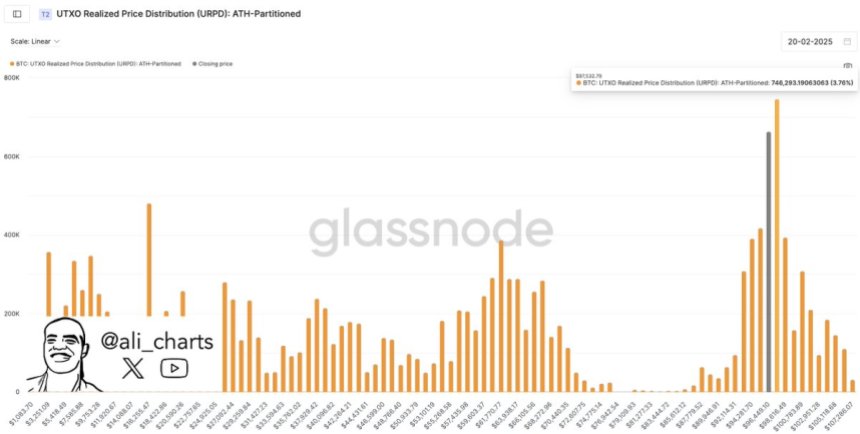
Volume, however, remains relatively muted compared to the breakout seen in late 2024, suggesting that traders are waiting for confirmation before committing to new positions. Until BTC can close a weekly candle above $109,300, this range will remain intact.

If bulls succeed, the market could enter price discovery and spark renewed inflows. But if rejection continues, the $103K–$105K zone becomes critical to hold. For now, Bitcoin’s bullish structure is intact, but confirmation is still required before a larger move can begin.

Featured image from Dall-E, chart from TradingView

Bitcoin Bulls Face Make-Or-Break Moment At $106,500 Resistance – Details

Popular digital asset analyst with X handle Crypto Patel has stated that Bitcoin is currently retesting a crucial price resistance at the $106,500 price region. Based on the asset’s performance at this level, BTC investors could expect a bullish price continuation or a significant price pullback.

After a brief rise above $105,000 on May 12, Bitcoin has remained range-bound, showing no significant price movement since then. However, bullish sentiments remain high as demonstrated by US BTC spot ETFs scooping another almost $2 billion in net weekly investments.

Bitcoin At A Crossroads: Can Bulls Push To $120k — Or Does A Fall To $75k Await?

In an X post on May 16, Crypto Patel shares a simple technical analysis on Bitcoin price movement, highlighting the present major support and resistance levels. According to the analyst, Bitcoin’s most recent price gain shows the asset is retesting a critical resistance around the $106,500 price region.

Notably, this resistance band has proved effective in inducing price rejections in December and January. If Bitcoin bulls can command sufficient market demand to subdue this price barrier, Crypto Patel projects the premier cryptocurrency will sustain its current uptrend with an initial price target set at $120,000.

Bitcoin

On the other hand, another price rejection could harm current investors’ expectations, as such negative development would force prices below the crucial $90,000 support zone to trade as low as the current market bottom at $75,000. This projected correction hints at a potential 27.1% decline from the present market price despite currently robust bullish sentiments.

Interestingly, the Relative Strength Index (RSI) shows that Bitcoin has recently dipped from the overbought territory, thus supporting predictions of an impending price correction. However, macroeconomic developments such as the 90-day tariff truce between the US and China, and strong levels of institutional investment, boost the potential of a bullish trend continuation.

Bitcoin Price Prediction

At press time, Bitcoin is valued at $103,355 following a 1.62% decline in the last week. However, the asset’s monthly performance reflects a 21.46% gain, signalling most new market entrants are still in profit.

According to the prediction site, CoinCodex, investors are showing a high level of greed as indicated by the Fear & Greed Index at 74. Coincodex analysts are predicting Bitcoin to reach $127,872 in the next five days, followed by a price correction that will return prices to around $111,616.

For long-term investment, the analyst projects Bitcoin to hit a valuation of $155,583 in three months and $148,167 in six months.

Bitcoin

Bitcoin Resistance Limited Beyond $100,000, On-Chain Data Suggests

On-chain data suggests Bitcoin may encounter low resistance at $100,000 and beyond, at least from the perspective of investor cost basis distribution.

A Low Amount Of Bitcoin Supply Has Cost Basis At Levels Ahead

In a new post on X, institutional DeFi solutions provider Sentora (formerly IntoTheBlock) has discussed about how the various Bitcoin price ranges look in terms of investor cost basis as BTC approaches $100,000.

Below is a chart that shows the related data for the price ranges near the latest spot value:

Bitcoin Cost Basis Distribution

In the graph, the size of the dot corresponds to the amount of the Bitcoin supply that investors last purchased inside the associated price range. It would appear that all the large dots are under the spot price following the latest rally, meaning that the levels that saw the most demand are now in the green.

It’s also visible that the ranges ahead (that is, those harboring the cost basis of underwater holders) have only small dots associated with them. In total, less than 3% of the cryptocurrency’s supply has its cost basis at these levels that lie above the spot price.

To any investor, their cost basis is an important level, so they may be more likely to show some kind of move when a retest of it happens. Generally, holders who were in the loss prior to this retest might incline toward reacting to it by selling their coins. This is because these investors may fear going back into loss again.

Similarly, the profit investors could decide to buy more during a retest of their acquisition mark, believing that the same level might end up being profitable again in the future.

These buying and selling behaviors are naturally of no consequence to Bitcoin when only a few investors are showcasing them. Tight price ranges where a large amount of investors share their cost basis, however, can produce a reaction sizeable enough to affect the asset.

Clearly, Bitcoin only has such ranges left on the profit side, implying it has no major resistance levels ahead in terms of supply distribution. Thus, an exploration beyond $100,000 may not be hindered by break-even sellers.

Though, while this may true, the run could have something different to worry about: profit-selling. Usually, the more investors are there in gains, the more likely is a mass selloff to occur.

With the vast majority of the Bitcoin supply now in the green, it’s possible that profit-taking would become a threat to the rally. It only remains to be seen whether there would be enough incoming demand able to absorb the potential selling pressure or not.

BTC Price

At the time of writing, Bitcoin is trading around $99,400, up more than 3% in the last week.

Bitcoin Price Chart

Bitcoin At Critical Juncture – Price Levels To Watch: Analyst

Bitcoin maintains its bullish form from April as it gains by over 4% in the first two days of May to surge above $97,000. Following this recent gain, the premier cryptocurrency is experiencing a minor retracement as investors attempt to decipher the current market phase.

Meanwhile, a prominent crypto analyst with the X handle IT Tech has shared some valuable insights on Bitcoin’s market structure, highlighting the key price levels that could decide the asset’s movement in the short term.

Bitcoin Cools Off After Price Rally: Breather Or Bull Trap?

According to IT Tech in an X post on May 2, Bitcoin appears to be catching its breath following a price rally from $93,600 to above $97,000. As market traders await to see if this will be a mere cooling period before another upswing or the start of a deeper price correction, IT Tech has shared some helpful technical and on-chain insights on potential price targets.

The analyst states that the Bitcoin SuperTrend Indicator had printed a buy signal when prices hit $94,000, followed by a sell signal at $97,300. However, with market prices still above $94,000, the  Bitcoin market structure and SuperTrend Indicator remain bullish.

Bitcoin

Meanwhile, liquidation data has also hinted at potential points for price volatility. Most notably,  IT Tech states there are long liquidation zones between the $95,200 – $96,000 price region and another dense cluster of orders at the $93,600 – $94,000 price region. Both regions are expected to act as strong price supports in the case of an unexpected decline. 

In determining Bitcoin’s next move, IT Tech says that market sentiment remains cautiously bullish as long as the $96,000 support level remains valid. This is because a decisive price fall below this level would trigger a liquidation cascade pushing prices back to $94,000.  Meanwhile, another price breakout above $97,400 to allow Bitcoin to trade as high as $98,500.

What’s Next For Bitcoin?

At press time, Bitcoin trades at $96,463, reflecting a 1.64% gain in the past seven days. Meanwhile, the asset’s trading volume is down by 21.82% and valued at $26 billion. 

As earlier stated, bullish sentiment continues to ravage the market as indicated by recent developments, including the surge in Bitcoin Spot ETF inflows.  Meanwhile, the US’s willingness to negotiate a new trade deal with China may signify no further negative developments on international trade tariffs.

Amidst Bitcoin’s recent bullish stint, analysts continue to roll out bullish predictions with lofty price targets as high as $150,000.

Bitcoin

Bitcoin Sandwiched Between Major Support & Resistance Levels—Can Bulls Win Out?

On-chain data shows the Bitcoin spot price is currently sandwiched between two zones where a large number of investors last bought their coins.

Bitcoin Is Trading Between Two Major On-Chain Demand Zones

In a new post on X, analyst Ali Martinez has talked about where the key Bitcoin on-chain support and resistance levels currently lie. In on-chain analysis, support and resistance levels are defined based on investor cost basis.

The reason behind this is naturally the fact that holders are particularly sensitive to retests of their break-even mark. How exactly an investor would react to a retest of their cost basis comes down to multiple factors, like the direction of the retest and the overall sentiment in the market.

In general, holders might be inclined to accumulate more when a retest of their acquisition level happens from above (that is, they were in profit prior to the retest). They may do so believing that the same level would prove profitable again in the future.

On the other hand, the addresses who were sitting underwater just prior to the retest might decide to exit, fearing that the cryptocurrency would decline once more.

Obviously, when only a few investors are showing these buying/selling reactions, Bitcoin doesn’t feel any visible fluctuations. When the asset is retesting a narrow range with the cost basis of a large number of them, however, the story can be different.

Now, here is the chart shared by the analyst that shows how the ranges around the current BTC spot price look in terms of holder cost basis distribution:

Bitcoin Cost Basis

As is visible in the above graph, Bitcoin has managed to break above a major supply wall with its recent recovery surge. This cost basis center, lying inside the $93,700 to $96,600 range, contains the acquisition mark of 2.13 million addresses. These investors bought a total of 1.39 million BTC here.

The asset is now looking to challenge the $96,900 to $98,700 range, which carries the cost basis of 750,800 BTC. Since these investors are holding at a loss, it’s possible that the coin would have trouble breaking through this zone.

The fact that the more massive $93,700 to $96,600 range has now turned green, however, could be an optimistic sign. This potential strong support could mean that even if Bitcoin finds it hard to find a break above, it would at least have a cushion to drop back on after every rejection.

In the scenario that this support gives out, though, the asset doesn’t have any other major zone until $82,000 to $85,000. It now remains to be seen whether demand would be strong enough to keep the BTC price recovery run going or not.

BTC Price

At the time of writing, Bitcoin is floating around $96,800, up over 2% in the last seven days.

Bitcoin Price Chart

Bitcoin’s Bullish Fate Hinges On These 2 Resistance Zones – Details

The Bitcoin (BTC) market continues to remain in consolidation following another trading week with no convincing price breakout. As multiple analysts continue to speculate on the asset’s next movement, prominent market expert Ali Martinez has identified two resistance zones that could be pivotal to reigniting a crypto bull run.

Bitcoin Must Break Past $85,470 And $92,950 – Here’s Why

Over the past month, Bitcoin has struggled to maintain a sustained uptrend, with investor uncertainty dominating the market. During this period, the leading cryptocurrency has faced multiple rejections, most notably at the $85,000 and $88,000 resistance levels. However, in an X post on Friday, Martinez identified the two resistance zones critical to a Bitcoin bull rally using on-chain data from IntoTheBlock.

According to the crypto analyst, the first resistance lies at $85,470 which marks the upper boundary of a price barrier that begins at $83,023. Notably, 1.13 million wallet addresses have traded 607,200 BTC within this price range suggesting a strong historical activity that backs potential heavy selling pressure at these levels.

Bitcoin

If Bitcoin bulls can push past this initial threshold, the next resistance zone lies at $92,950 – the lower boundary of another price ceiling that extends to $95,514. Compared to the initial resistance, this zone has seen lower investor participation, with 795,830 active wallet addresses. However, its potential market impact is more significant, as approximately 627,410 BTC have been traded within this range.

If Bitcoin can successfully clear both resistance zones, Ali Martinez postulates the premier cryptocurrency could enter a prolonged uptrend and resume its bull rally. However, Bitcoin bulls must avoid any price fall below a crucial support zone at the $80,450 price level.

According to the on-chain data presented, the $80,450 level represents the lower boundary of a key support zone, which extends up to $82,907. Within this range, approximately 516,770 BTC have been transacted, involving around 738,580 active wallet addresses. This data indicates substantial buying activity that could serve as a buffer in the advent of a price fall.

Bitcoin Fees Fall By 57%

In other developments, IntoThe Block also reports that Bitcoin network fees dropped by 57.3% in the past week indicating a decline in user engagement and general investor activity. Albeit, the premier cryptocurrency has shown only a minor 0.11% decline in price during this period.

Following the recent announcement of new US tariffs on imports, Bitcoin and the broader crypto market have responded more positively compared to previous tariff-related news. Ryan Rasmussen, Head of Research at Bitwise Invest, notes that Bitcoin has risen by 2.2% since the announcement on April 2. In contrast, traditional stock markets have seen notable losses, with the “Magnificent Seven” falling by an average of 12.18%.

Bitcoin

Bitcoin Lost And Retested The 200-Day MA As Resistance – Here’s What Happened Last Time

Bitcoin is trading below crucial support levels after massive selling pressure swept through the market. Since late January, BTC has lost over 29% of its value, fueling fear and uncertainty among investors. With global trade war fears intensifying and volatile macroeconomic conditions shaking the crypto and U.S. stock markets, traders are bracing for further downside risk.

Market sentiment remains overwhelmingly bearish as Bitcoin fails to hold key technical levels. Crypto analyst Daan shared a technical analysis on X, revealing that BTC has broken below the Daily 200-Moving Average (MA) and has now retested it as resistance. Historically, this pattern signals a continuation of bearish price action, indicating that BTC could see more downside in the coming weeks.

With Bitcoin struggling to regain momentum, the market’s next major move will depend on whether bulls can reclaim lost ground or if further selling pressure will drive BTC toward lower support levels. As uncertainty grows, investors remain cautious, waiting for clear signals before making significant moves. The coming days will be crucial in determining whether Bitcoin can stabilize or if the current downtrend will continue.

Bitcoin Downtrend Deepens as Bears Maintain Control

Bitcoin has remained in a persistent downtrend since late January, with fear continuing to set lower price targets among investors. Many now question whether the BTC bull cycle is over, as selling pressure intensifies and market sentiment turns increasingly bearish.

The uncertainty surrounding macroeconomic conditions has fueled this decline, with volatility increasing since the U.S. elections in November 2024. Given the ongoing trade war fears and unstable global markets, it appears that this period of uncertainty will continue to weigh on Bitcoin’s price action.

Crypto analyst Daan recently shared technical insights on X, highlighting that BTC has lost the 200-day moving average (MA) and has now retested it as resistance. This signals that bears remain in control, and bulls have a lot of work to do to reclaim this level.

Bitcoin trading below 200-day MA & EMA | Source: Daan on X

According to Daan, Bitcoin experienced a similar scenario last year, where price action chopped around these levels for over three months before breaking out. If history repeats itself, BTC could be entering another extended consolidation phase, keeping prices range-bound for months.

However, if bulls fail to reclaim the 200-day MA/EMA, further downside could follow, bringing Bitcoin to even lower price levels. With bears still in control, the market remains highly fragile, and investors are watching closely to see whether BTC can stabilize or if another major drop is on the horizon. The next few weeks will be critical as Bitcoin either finds a foothold or continues deeper into bearish territory.

Bitcoin Stuck Between $80K and $85K as Fear Continues

Bitcoin (BTC) is currently trading between $80,000 and $85,000, struggling to reclaim key price levels amid growing panic selling and fear. With selling pressure dominating the market, investors remain uncertain about Bitcoin’s next move as bulls fail to push BTC into a recovery phase.

BTC trading below key levels | Source: BTCUSDT chart on TradingView

For a bullish reversal, BTC must hold above $80,000 and reclaim the $86,000 level, which would signal renewed buying interest and possibly set the stage for a stronger uptrend. However, Bitcoin may enter a sideways consolidation phase below $90,000–$88,000, prolonging the uncertainty and keeping price action choppy for weeks.

If BTC fails to defend the $80K level, the risk of a deeper correction increases, potentially pushing prices below critical support zones. A breakdown below $80K could trigger another wave of selling, sending BTC toward lower demand levels and extending the current bearish market structure. Traders remain cautious, closely watching whether Bitcoin can stabilize or if another major decline is ahead.

Featured image from Dall-E, chart from TradingView

This Bitcoin Range The Next Key Resistance, Analytics Firm Says

The market intelligence platform IntoTheBlock has revealed where the next major obstacle for Bitcoin could lie, according to on-chain data.

Bitcoin Has A Major Supply Wall Between $95,400 & $98,200

In a new post on X, IntoTheBlock has discussed about how the various BTC price ranges are looking in terms of on-chain resistance and support. In on-chain analysis, the strength of any support or resistance range is assumed to lie in the amount of supply that was last purchased/transacted by investors at price levels falling in said range.

That is, strong support/resistance ranges carry the cost basis of a large number of addresses. The reason behind this is that to any investor, their break-even level is naturally a special level, so when retests of it happen, they are probable to make some kind of move.

Holders who were in loss prior to such a retest may be tempted to sell, as they would at least recoup all of their investment. Investors who were in profit, however, may decide to buy more instead, as they could believe the same acquisition level would end up paying off again in the future.

Naturally, just a few investors showing this buying/selling would have no effects on the cryptocurrency’s price, so the range would need to contain the cost basis of a significant amount of addresses if it has to act as a resistance or support boundary.

Now, here is the chart shared by the analytics firm, that shows how the Bitcoin supply is distributed at ranges around the current spot price:

Bitcoin Resistance

In the graph, the size of the dot correlates to the amount of coins that the investors purchased inside the corresponding range. It would appear that one range ahead of the current price particularly stands out in terms of the size of its dot: $95,400 to $98,200.

At these price levels, around 2.29 million addresses purchased a total of 1.66 million tokens. Given that the range is above the asset’s price at the moment, all of these investors would be in the red.

Bitcoin has recently gone through a rollercoaster where it plunged below $80,000 and recovered back above $90,000, all within the matter of a few days. As such, these underwater holders may be especially eager for the price to get back to their cost basis.

“Fearful sentiment can trigger these holders to sell at break-even prices, thus providing resistance,” explains IntoTheBlock. It now remains to be seen whether demand would be enough to outpace these potential sellers, if BTC can rally far enough to retest this range.

BTC Price

Bitcoin neared the $95,000 level during the latest price rally, but it seems its price has since faced a retrace as it’s now back to $90,700.

Bitcoin Price Chart

Bitcoin Reclaims Key Levels And Faces Resistance At $97K – Can It Break $100K This Week?

Bitcoin is trading above $90K after experiencing extreme selling pressure last week, which drove the price as low as $78,100 and broke through key demand levels. However, the market quickly recovered following President Trump’s announcement that he plans to establish a U.S. strategic crypto reserve, including Bitcoin and select altcoins like XRP, SOL, ADA, and ETH. This statement injected confidence back into the market, fueling Bitcoin’s rebound.

Despite this recovery, the road ahead remains uncertain as Bitcoin faces key technical levels that could define the next move. According to top analyst Axel Adler’s data on X, Bitcoin is currently trading at $92K, with support levels resting around the 200-day simple moving average (SMA) at $82,314 and the realized price for short-term holders in the 3-to-6-month range at $79,290. On the resistance side, Bitcoin must break through the realized price for short-term holders in the 1-week-to-1-month range at $97,478 and the 1-month-to-3-month range at $99,395.

As Bitcoin continues to stabilize above $90K, analysts believe a breakout above $100K could trigger renewed bullish momentum, while failing to hold above key support levels could result in another wave of selling pressure. The next few days will be critical in determining Bitcoin’s next major move.

Bitcoin Price Action Remains Uncertain

Bitcoin is about to enter a critical phase as the market shifts from fear to excitement following President Trump’s announcement of a U.S. crypto strategic reserve. The announcement has ignited bullish sentiment across the market, with Bitcoin surging over 12% since the news broke. Just three days ago, Bitcoin was breaking down below key demand levels, and now, speculation is growing about the potential for a massive bull run.

Market sentiment flipped from extremely bearish to bullish in a matter of hours, reinforcing the argument that Bitcoin remains in a strong uptrend. Analysts are watching key levels closely to determine if BTC can sustain this momentum. Adler’s insights on X reveal that Bitcoin is currently trading at $92K, with critical support resting around the 200-day simple moving average (SMA) at $82,314 and the realized price for short-term holders in the 3-to-6-month range at $79,290.

Bitcoin Support and Resistance | Source: Axel Adler on X

On the resistance side, Bitcoin must break through the realized price for short-term holders in the 1-week-to-1-month range at $97,478 and the 1-month-to-3-month range at $99,395. Additionally, the short-term holder realized price at $91,096K could act as a local support level.

While the price action has improved significantly, some analysts warn that BTC needs to hold above $90K to maintain bullish momentum. The futures market also remains stable, with no significant leverage buildup, reducing the chances of sudden liquidations. Investors are closely monitoring the $97K–$100K range, as breaking above it could trigger an explosive rally.

The market is heating up quickly, but the big question remains: Can BTC reclaim $100K this week? With renewed optimism and rising speculation, all eyes are on Bitcoin’s next move.

Price Action Details: Holding Key Levels

Bitcoin is trading at $91,800, holding above the key $90K mark after experiencing a sharp recovery from last week’s extreme selling pressure. The price struggled below this level for several days, dropping as low as $78K, fueling speculation that Bitcoin could be entering a bear market. However, bulls have regained some control, and Bitcoin has managed to stabilize above this crucial demand zone.

BTC rebounds from long-term demand | Source: BTCUSDT chart on TradingView

This recovery has shifted market sentiment, with many analysts now considering the possibility of a renewed bullish phase. If BTC continues to hold above $90K and pushes toward $95K in the coming days, it could set the stage for an attempt to reclaim the psychological $100K level. Breaking above this milestone would likely confirm a full recovery and signal the continuation of Bitcoin’s long-term uptrend.

However, losing the $90K level again could spell trouble for bulls. A breakdown below this key support could reignite bearish momentum, potentially sending BTC back toward the $85K or even $80K regions. The next few days will be critical as bulls attempt to solidify their position and push BTC toward a stronger recovery phase. All eyes are now on whether Bitcoin can maintain this level and build momentum for another rally.

Featured image from Dall-E, chart from TradingView

On-Chain Metrics Reveal The Most Critical Resistance For Bitcoin – Can BTC Break $97.5K?

Bitcoin continues to trade within a tight range, holding above the $94K level while struggling to break past the $100K mark. The long-term outlook remains bullish as BTC maintains key demand levels, but short-term price action remains uncertain. Investors and analysts are closely watching for a breakout, with speculation rising that this period of consolidation is the calm before the storm.

While bulls have defended crucial support levels, they have been unable to push BTC above key resistance, leading to growing frustration in the market. Analysts suggest that an aggressive move in either direction is imminent. Key metrics from Glassnode reveal that the most critical resistance level for Bitcoin is currently at $97,533. This level has acted as a key rejection zone in recent weeks, preventing BTC from reclaiming momentum.

If Bitcoin manages to break and sustain a move above this resistance, it could signal the start of a new uptrend, potentially driving prices toward ATH and beyond. However, failure to do so may lead to continued sideways trading or even another retest of lower demand zones. As market participants await confirmation, Bitcoin remains at a pivotal moment that could define its next major move.

Bitcoin Prepares For An Aggressive Move

Bitcoin has remained in a quiet consolidation below the $100K mark, creating an environment filled with uncertainty and frustration among traders. Price action remains range-bound, fluctuating between $94K and $100K without any clear direction. Analysts continue to speculate about the next move, with most agreeing that an aggressive breakout is inevitable. However, the major question remains—will it be a bullish surge into price discovery or a selloff into lower demand levels?

Top analyst Ali Martinez shared Glassnode data on X, revealing that the most critical resistance level for Bitcoin is currently at $97,533. This level has repeatedly acted as a barrier, preventing bulls from regaining control. Martinez suggests that a sustained breakout above this level could signal further upside, potentially paving the way for a move toward the $100K psychological barrier.

Bitcoin UTXO Realized Price Distribution | Source: Ali Martinez on X

Investor sentiment is mixed, with some expecting Bitcoin to reclaim momentum and push past ATH, while others remain cautious due to the prolonged consolidation and weakening volatility. Historically, extended periods of low volatility often precede major price moves, but the market remains divided on which direction BTC will take.

For now, Bitcoin continues to trade within a tight range, and investors eagerly await confirmation of the next major trend.

BTC Price Action Details

Bitcoin is trading at $97,300, attempting to reclaim key moving averages that could define its short-term direction. The 4-hour 200 exponential moving average (EMA) at $98K and the 200 moving average (MA) at $100K serve as critical resistance levels that bulls must overcome to confirm an uptrend. If Bitcoin breaks above these levels and holds them as support, it could ignite a massive rally toward new highs.

BTC testing crucial prices | Source: BTCUSDT chart on TradingView

However, uncertainty still dominates the market as BTC struggles to sustain bullish momentum. Investors are closely watching whether the price can break through these resistance zones or if another rejection will occur. A failed attempt to push above the $98K-$100K range could result in increased selling pressure, leading BTC into lower demand zones around $91K.

Despite the cautious sentiment, Bitcoin’s long-term structure remains bullish as it continues to hold above key support levels. The coming days will be crucial as traders look for confirmation of either a breakout or a potential retracement. If BTC manages to reclaim these key moving averages, confidence could return to the market, fueling further upside momentum. Until then, Bitcoin remains in a critical consolidation phase, awaiting its next decisive move.

Featured image from Dall-E, chart from TradingView

Bitcoin Unable To Break Upward As 1.6 Million BTC Resistance Wall Blocks Path

On-chain data shows the presence of a massive Bitcoin supply wall around the $97,200 level, something that could impede BTC’s advances beyond the mark.

Bitcoin Has Significant Resistance At Price Levels Just Ahead

In a new post on X, the market intelligence platform IntoTheBlock has discussed how BTC support and resistance levels are looking from an on-chain perspective right now. In on-chain analysis, the potential of any price level to act as support or resistance lies in the amount of supply that was last transferred or purchased at it. Below is the chart shared by the analytics firm, that shows the supply distribution of the cryptocurrency at price levels near the current spot Bitcoin value.

Bitcoin Resistance

In the graph, the size of the dot correlates to the amount of BTC that the investors bought in the corresponding price range. It would appear that the $96,400 to $98,400 range currently has a particularly large dot associated with it, which implies these levels host the cost basis of a significant number of holders.

More specifically, around 1.6 million addresses last acquired a total of 1.57 million BTC inside the range. Since Bitcoin is trading under these levels at the moment, all of these investors would be underwater.

Holders in loss can be desperate to recoup their investment, so selling from them can sometimes occur as soon as the price of the cryptocurrency rises back to its cost basis.

Naturally, such selling is of no relevance to the asset when just a few investors participate in it, but when the price is retesting a range holding the acquisition level of a significant number of addresses, a reaction large enough may be produced to influence the asset’s value.

The $96,400 to $98,400 range is clearly quite large, so it’s possible that it could be the reason why Bitcoin has been unable to find any bullish breaks during the past week.

Just like how supply blocks above the spot price can end up acting as a source of resistance for the asset, those below can be a point of support. This happens because investors who were once in profit may believe that the price would go up again in the near future so they could decide to double down on their bet, taking advantage of the ‘dip’.

Currently, $93,400 to $96,200 is the strongest support wall that BTC has out of the nearby ranges. However, it contains a lower amount of supply than the aforementioned resistance block, meaning that its effect should be weaker.

If the support range is lost, there are only thin walls waiting for Bitcoin up to $81,800. It now remains to be seen whether Bitcoin can surpass the resistance, or if it would find itself retesting one of these weaker support levels.

BTC Price

At the time of writing, Bitcoin is floating around $96,000, down around 2% in the last 24 hours.

Bitcoin Price Chart

Bitcoin Reclaims Crucial Liquidity Level – No Resistance Left Below ATH

Bitcoin is trading near the $103,000 level following a highly bullish Friday that has energized the market. The recent surge has positioned BTC for a potential rally toward new all-time highs, with analysts closely monitoring its next moves. This renewed momentum comes after a significant breakout that many believe has cleared the path for further price appreciation.

Top analyst Jelle has shared a technical analysis that highlights the bullish outlook for Bitcoin. According to Jelle, BTC now faces virtually no resistance following the recent breakout, suggesting that the cryptocurrency could be poised for a rapid ascent. This lack of overhead resistance is a rare and encouraging sign, bolstering investor confidence in Bitcoin’s ability to sustain its upward trajectory.

The coming days will be pivotal for Bitcoin as traders and investors look for confirmation of this bullish trend. If BTC continues to hold key support levels and build on its momentum, a rally to uncharted territory appears increasingly likely.

With market sentiment turning optimistic and technical indicators aligning, Bitcoin’s current position could mark the start of a transformative phase for the leading cryptocurrency. All eyes are now on BTC as it edges closer to rewriting its own history.

Bitcoin Enters A Key Phase 

Bitcoin has officially entered a pivotal phase as it broke above the highly anticipated $100,000 mark, signaling the start of what many expect to be an explosive rally. This breakout has ignited widespread optimism among investors, who now believe BTC is on the verge of entering price discovery—a phase where it explores uncharted territory beyond its previous all-time high (ATH).

Top analyst Jelle recently shared a detailed technical analysis on X, emphasizing the significance of Bitcoin’s recent price action. According to Jelle, Bitcoin’s ability to reclaim critical supply levels has effectively cleared the last major resistance zones. With these levels now behind it, BTC faces virtually no resistance as it prepares to surge higher. Jelle also highlighted that the recent breakout aligns with broader market dynamics, adding further weight to the bullish narrative.

Bitcoin breaking key supply levels | Source: Jelle on X

The next few days will be crucial as Bitcoin tests its newfound strength above the $100K level. Holding this psychological and technical support is essential for sustaining the rally. If BTC maintains its position above this threshold, the move into price discovery becomes almost inevitable, paving the way for rapid gains and new ATHs.

This bullish momentum comes at a time when market sentiment is overwhelmingly positive. Investors are positioning themselves for what could be one of Bitcoin’s most transformative periods yet. With fundamentals, technicals, and sentiment all pointing upward, Bitcoin is poised to lead the cryptocurrency market into a new era of growth. As the rally unfolds, the potential for unprecedented price levels underscores Bitcoin’s enduring role as the flagship of the crypto world.

BTC Prepares To Surge

Bitcoin (BTC) is currently trading at $103,000, maintaining its bullish momentum after an impressive surge on Friday. The price is now holding above the previous local high, signaling strength as it tests demand in a former supply zone. This critical level has shifted from resistance to support, showcasing the market’s growing confidence in Bitcoin’s upward trajectory.

BTC testing crucial liquidity | Source: BTCUSDT chart on TradingView

Analysts are optimistic that if BTC continues to hold above the $102,000 mark, a push toward new all-time highs (ATH) becomes inevitable. This level represents a strong foundation for the ongoing rally, and maintaining it would confirm short-term strength while supporting the long-term bullish trend. A decisive move above $103,000 would likely trigger heightened market activity, further fueling Bitcoin’s rally into price discovery.

However, losing the $102,000 level could lead to a period of consolidation. Such a pullback might delay Bitcoin’s ascent but could also provide an opportunity for the market to regroup before making another attempt at breaking ATH.

With Bitcoin now in a pivotal position, traders and investors are watching closely for confirmation of the next big move. Holding key support levels will be essential to sustaining the bullish momentum and keeping Bitcoin on track for its next major breakout.

Featured image from Dall-E, chart from TradingView

Bitcoin Set For Encounter With Key $99,900 Price Level – Analyst

The Bitcoin market has begun 2025 on a positive note with gains over 5% in the first four days of the year. Amidst this renewed bullish strength, Bitcoin is preparing for a vital encounter with the $99,900 capable of significantly altering its price trajectory in the short term.

Bull Flag Or Bear Flag, Bitcoin Bulls To Call 

In an X post on January 3, crypto analyst with username Plan D shared an analytical commentary on Bitcoin’s price. Plan D stated the premier cryptocurrency is currently forming a “moon flag” that will face major resistance at $99,900. 

A “moon flag” here likely refers to a chart pattern that will result in a dramatic price gain upon confirmation. It is based on the bull flag which is a continuation pattern that occurs during an uptrend indicating potential breakout and further price gains. A bull flag is characterized by a period of consolidation after a sharp price gain followed by an uptrend.

For Bitcoin’s “moon flag” to become valid, Plan D states the asset must break and stay above $99,900, which may result in a sustained price rise to around $108,000. However, if Bitcoin fails to move above $99,900, this development may indicate confirmation of a bear flag—a bearish chart pattern that mirrors the bull flag but indicates downward momentum instead.

In this case, Bitcoin is projected to fall as low as 78,000 indicating a potential 20.3% from its current market price and 27.7% from its all-time high of $108,268. Plan D notes that while altcoins are currently a profit zone for most investors with Bitcoin Dominance on the decline, the crypto market is not safely on an upward trajectory until Bitcoin breaks above $99,900.


Bitcoin


BTC Price Overview

At press time, Bitcoin continues to trade at $97,903 after price gains of 0.72% and 3.95% in the past one and seven days respectively. However, the premier cryptocurrency remains in the red zone on its monthly chart with a 0.77% loss

Amidst Bitcoin’s ongoing price rebound, traders are taking profit as evidenced by a recent reduction in long position on Binance from 66.33% to 56.85%. However, long positions remaining dominant over short positions by 13.7%, indicate that the majority of Binance traders still anticipate Bitcoin to maintain its current uptrend.

These bullish sentiments in the Bitcoin market are only likely to grow stronger in the coming days as Donald Trump’s presidential inauguration approaches.  Many enthusiasts expect the US President-elect to lead a pro-crypto government based on his electoral campaign promises.

Bitcoin

These Are The Biggest Bitcoin Support & Resistance Zones, Analyst Reveals

An analyst has revealed the Bitcoin price zones that could act as major support and resistance centers for the cryptocurrency.

A Large Number Of Investors Bought Bitcoin Inside These Zones

In a new post on X, CryptoQuant author IT Tech has discussed the Bitcoin price levels that could act as support and resistance for BTC. In on-chain analysis, the potential for any price level to behave in this manner lies in the amount of tokens purchased.

Below is the chart from the market intelligence platform IntoTheBlock shared by the analyst, which shows how the price ranges near the current one look in terms of the number of coins that share their cost basis.

Bitcoin Cost Basis Distribution

In the graph, the size of the dot corresponds to the number of coins purchased at the price range. The dots of two ranges stand out: $59,160 to $60,973 and $64,670 to $66,483.

Bitcoin had been just above the first of these ranges when the analyst made the post, but now the coin has dipped into it, meaning it’s retesting the zone.

To any investor, their cost basis is naturally an important level, so they may be more likely to make some move when the cryptocurrency’s price retests it. When many holders share their cost basis inside the same narrow range, this reaction can emerge on a scale that can affect the market.

Almost 1.7 million addresses purchased 965,239 BTC inside the $59,160 to $60,973 range, and after the pullback in the price, these holders would be sitting at their break-even.

Generally, when the asset retests an investor’s cost basis from above, they are probably to react by buying more, as they could believe the asset would go up again to put them in profits. The coin can naturally feel support when this reaction is produced on an appreciable scale.

As the range at hand is quite large, the analyst has called it the biggest support zone for Bitcoin. Since BTC is retesting it now, it remains to be seen whether investors would truly step in and buy the “dip.”

If BTC feels support and finds a rebound, it will have to retest the resistance levels ahead. As mentioned before, the $64,670 to $66,483 range is host to the acquisition level of many coins.

Holders at a loss may look forward to a retest of their cost basis to exit at their break-even and regain the entirety of their capital. So, large demand zones can provide resistance when Bitcoin retests them from below.

The $64,670 to $66,483 range could prove a significant challenge for the cryptocurrency because of this.

BTC Price

At the time of writing, Bitcoin is trading at around $60,200, up 1% over the past week.

Bitcoin Price Chart

Bitcoin Resistance: Here Are The Challenges Ahead For BTC

Bitcoin has certain on-chain resistance levels coming up that could threaten future rallies. Here are the exact prices at which they lie.

Bitcoin Short-Term Holders Have Their Cost Basis At These Levels Ahead

As explained by CryptoQuant author Axel Adler Jr in a new post on X, the BTC short-term holders currently have their cost basis levels between $62,000 and $65,000. The on-chain relevance metric here is the “Realized Price,” which keeps track of the average acquisition price on the Bitcoin network.

When this indicator is above the cryptocurrency’s spot price, it means the average investor in the market is underwater right now. On the other hand, it being below BTC’s value suggests the dominance of profits on the network.

In the context of the current topic, the Realized Price of the entire userbase isn’t of interest, but only that of a specific segment of it called the short-term holders (STHs). The STHs refer to the investors who bought their coins within the past six months.

This Bitcoin cohort has historically acted erratically, easily selling whenever a major change in the market has occurred, like the emergence of a rally or crash.

Below is the chart shared by the analyst that shows the trend in the Realized Price of the STH group, as well as that of a few subdivisions of it, over the past year:

Bitcoin Short-Term Holder Realized Price

As is visible in the above graph, the Bitcoin STH Realized Price is currently around $64,000, which means these investors are in a state of net loss. The Realized Price broken down for each segment of the cohort reveals the STHs who bought between 3 and 6 months ago are in the deepest loss as their cost basis is at $65,800.

The 1- to 3-month investors are close to the average of the whole cohort, with the metric being $64,200. The most recent buyers (1 week to 1 month) are in the best position as they acquired their coins at an average cost of $62,400 per token.

To any investor, their cost basis is naturally an important level, but the STHs especially can be sensitive to retests of it. Thus, if the price rallies to one of these levels, then it’s likely that these holders will produce some reaction.

However, as the STHs are currently carrying a loss, they may be looking forward to the retest so they can sell and get their investment back. As such, Bitcoin could feel some resistance when it travels up to these Realized Price levels.

BTC Price

Bitcoin had risen above the $61,000 level but appears to have seen a sharp retrace since then, as its price is already back at $59,000.

Bitcoin Price Chart

Bitcoin Makes Sharp Recovery, But Watch Out For Resistance At $64,000

On-chain data shows that the Bitcoin short-term holder whales have a cost base above $64,000, which could be a potential resistance point for BTC.

Bitcoin Is Not Far From Realized Price Of Short-Term Holder Whales After Rally

As pointed out by an analyst in a CryptoQuant Quicktake post, the BTC price had slipped below the Realized Price of the short-term holder whales earlier. The “Realized Price” here refers to an indicator that keeps track of the average cost basis that the investors of a particular group currently share.

When the asset’s spot price is under this metric, the holders belonging to the cohort are in a state of net unrealized loss. Similarly, it being above the indicator implies the group is enjoying profits.

In the context of the current topic, there are two market segments of interest: the short-term holder and long-term holder whales. The short-term and long-term holders are the two main divisions of the Bitcoin sector based on holding time.

The short-term holders (STHs) are the investors who bought their coins within the past 155 days, while the long-term holders (LTHs) include the hands who have kept their coins dormant for longer than this period.

The “whales” generally refer to the entities that carry at least 1,000 BTC in their wallets, so the STH and LTH whales would naturally correspond to the large members of the respective cohorts.

Now, here is a chart that shows the trend in the Realized Price for these two Bitcoin groups over the past few years:

Bitcoin Realized Price

As displayed in the above graph, the Bitcoin spot price had slipped considerably below the Realized Price of the STH whales during the recent market downturn. However, with the price observing recovery, it has now neared back to that level.

The average cost basis of the STH whales is between $64,000 and $65,000, so a retest of it could be coming soon. However, Such a retest could prove difficult for the cryptocurrency.

The STHs represent the weak hands of the market, which can be sensitive to changes in the market. The cost basis is naturally an important level for any investor, but this cohort especially can be likely to react when such a retest happens.

Since most STH whales have been at a loss recently, some may be desperately looking forward to a retest taking place so they can exit from the market at their break-even level. It remains to be seen whether Bitcoin will overcome this obstacle if the current recovery rally continues that far.

While the STH whales suffer losses, the LTH whales continue to be in high profits as their Realized Price is at just $22,000, implying that their patience has paid off.

BTC Price

Bitcoin had briefly broken above $62,000 during the past day, but the coin’s price has since seen a retrace to $60,500.

Bitcoin Price Chart

Minimal Bitcoin On-Chain Resistance Ahead: Price Set For New ATH?

On-chain data suggests minimal resistance for Bitcoin, which could facilitate a rally toward a new all-time high (ATH).

Almost All Bitcoin Investors Are Back In The Green With Latest Recovery

According to data from the market intelligence platform IntoTheBlock, resistance looks light in the price ranges ahead. In on-chain analysis, the strength of support and resistance levels is based on the number of investors who last bought their coins at them.

The chart below shows what the cost basis distribution on the Bitcoin network looked like at the time of the analytics firm’s post.

Bitcoin Resistance

In the graph, the size of the dot corresponds to the addresses that purchased their coins inside the corresponding range. As is apparent, when IntoTheBlock shared the data, the price ranges ahead all had small dots, while those below had big ones.

This suggested that few investors left in the market had their cost basis higher than the spot price. That is, there weren’t many holders in loss left anymore.

Since then, however, BTC has seen some pullback into the first of the big circles. Nonetheless, at the current price, most holders should still be in the green.

To any investor, their cost basis is naturally an important level, and they may be more likely to make a move when a retest of it happens. Investors in loss may look forward to such a retest to exit at their break-even to escape away with their initial investment.

A few investors selling at their break-even isn’t of any consequence to the entire market, but if a large amount of them share their cost basis inside a narrow range, then perhaps a reaction large enough to cause fluctuations in the price can emerge.

This is why the strength of support and resistance price levels is related to the number of investors who have their cost basis in on-chain analysis.

As investors in loss may react to a retest of their cost basis by selling, large red dots can be potential sources of resistance. However, BTC has no significant obstacles left, so the price could be set to travel to higher levels.

As investors in loss react by selling, those in profit can look at the retest of their acquisition level as an opportunity to buy more instead. Thus, green dots can be support centers for the cryptocurrency. As BTC has fallen to one of these green dots, it’s possible the coin can use the cushion to spear ahead at the relatively light red ranges.

Something to keep in mind, however, is that while there may not be many investors desperate to exit at their break-even, there is also a different obstacle BTC could face: profit-taking.

With an extreme majority of investors in profits, many would likely become tempted to harvest some of their gains as the coin surges toward a new ATH. It remains to be seen whether demand would be able to absorb this potential selloff.

BTC Price

Bitcoin had neared the $70,000 level earlier in the day, but the coin has since plunged towards the $67,800 mark.

Bitcoin Price Chart

Last Resistance: Bitcoin Now Testing Final Short-Term Holder Cost Basis

On-chain data shows that the Bitcoin price reiterates the last cost basis level associated with the short-term holder group.

Bitcoin Price Has Surged Past Final Short-Term Holder Cost Basis

As explained by CryptoQuant author Axel Adler Jr in a new post on X, Bitcoin has only one Realized Price of the short-term holders left to break. The “Realized Price” here refers to an on-chain indicator that keeps track of the average cost basis of the investors in the BTC market.

Investors carry net profits when the cryptocurrency’s spot price is above this level. On the other hand, it being under the metric suggests the dominance of losses in the market.

In the context of the current discussion, the Realized Price of the entire market isn’t of interest but rather that of a small segment of it. The group in question is a section of the “short-term holders” (STHs), broadly including the investors who bought their coins within the past six months.

Below is the chart that shows the trend in the Realized Price specifically for the STHs who have been holding since between one and three months ago:

Bitcoin STH Realized Price

This segment of the STHs sits right in the middle of the group, between the newcomers who have just bought into the asset and those who have started to gain some resilience, with a promotion into the long-term holder (LTH) group potentially coming up for them.

According to the analyst, Bitcoin has already surged past the Realized price of the other two parts of the STH group, meaning that the investors falling in them would be in profits now.

The chart shows that the Realized Price of the 1 month to 3 months old investors, the one level BTC is yet to break, is valued at $67,100. This cryptocurrency price is currently floating around, suggesting that this cohort’s profits are canceling their losses.

The STH cost basis levels have historically been relevant for the cryptocurrency, as these investors, who are generally fickle-minded, are likely to show some reaction when the price retests their cost basis.

In bullish periods, these investors tend to buy at their own cost, while if the atmosphere is bearish, they may sell instead. As such, a successful break above this potential resistance boundary that Bitcoin is retesting right now could indicate the presence of bullish sentiment among the STHs.

BTC Price

At the time of writing, Bitcoin is trading at around $67,200, up almost 6% over the past week.

Bitcoin Price Chart