Chainlink Struggles At Key Resistance Level – $10 Support Back In Focus

After weeks of consistent buying pressure and bullish sentiment, Chainlink (LINK) is now facing a critical moment. The price failed to reclaim the $18 resistance level and has since dropped more than 16%, showing signs of weakening momentum. This recent rejection has sparked concerns among investors and traders, as downside risk intensifies in the short term.

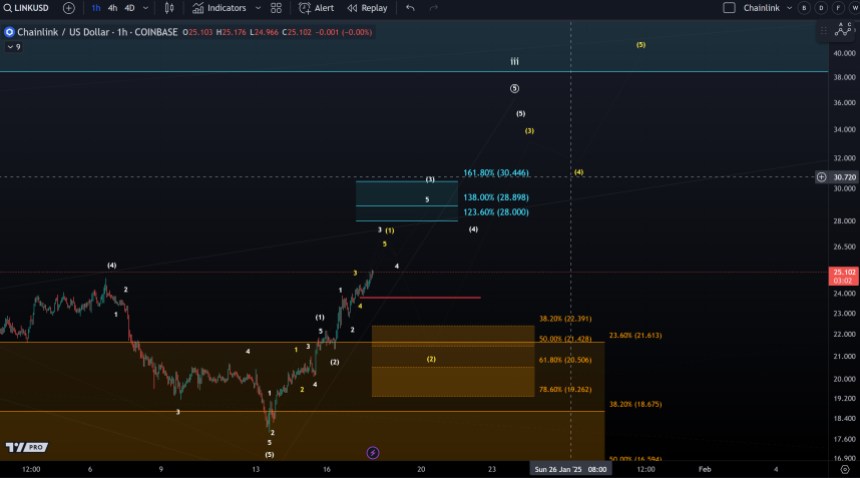
Top crypto analyst Ali Martinez shared a technical analysis pointing to a potential retracement toward lower demand levels. According to Martinez, the recent failure to break above key resistance may trigger further selling pressure, especially if broader market conditions remain uncertain. He suggests that LINK appears to be losing its bullish structure and could be preparing to revisit lower support levels before any meaningful rebound.

Chainlink’s current position highlights a shift in sentiment, as bulls struggle to hold key zones. While the broader market remains relatively stable, LINK’s inability to maintain higher levels could signal an early sign of deeper correction if volume and momentum do not pick up.

With volatility returning to the altcoin space, the coming days will be decisive for Chainlink. Holding above interim supports will be key if bulls want to regain control and avoid further losses.

Chainlink Struggles As Momentum Fades: Downside Risks Grow

Chainlink (LINK) is showing signs of exhaustion after weeks of upward movement, now trading under mounting pressure as the market grapples with renewed volatility and global financial uncertainty. Bulls remain active, defending key demand zones and continuing to call for a breakout, but fading momentum and growing fear are starting to weigh on sentiment.

The failure to breach the $18 resistance level marked a turning point. Since then, Chainlink has slipped over 16%, losing critical support zones and entering a vulnerable technical position. According to Martinez, this rejection could be the start of a deeper correction. Martinez’s analysis suggests that LINK is now poised to revisit the $10 level — a psychological and structural support that aligns with historical price behavior.

Chainlink retraces after $18 Rejection | Source: Ali Martinez on X

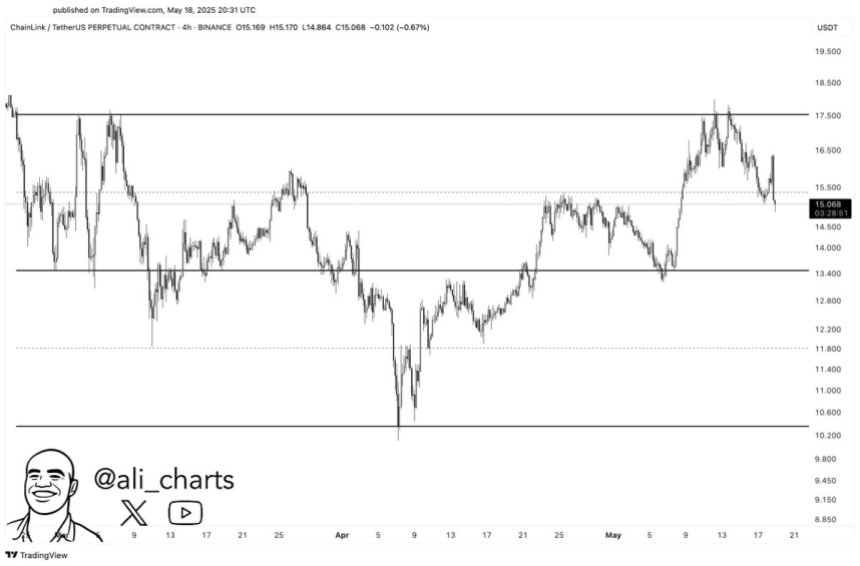
The next few trading sessions will be crucial. If bulls can’t reclaim higher levels or at least stabilize price action above $14, the selling pressure could accelerate. Adding to the uncertainty is a broader lack of clarity in global markets, with investors closely watching central banks, inflation data, and geopolitical developments for guidance.

While some traders are still positioning for a bounce, the current structure points to caution. Chainlink’s performance in the coming days could either confirm a local top or offer a high-risk, high-reward entry point if support holds and momentum returns. Either way, the $10–$12 range may soon be tested, and how LINK responds there will define its next major trend.

LINK Faces Pullback As Buy Pressure Weakens

Chainlink (LINK) is under pressure after failing to hold above the $17.50–$18 resistance zone. The daily chart shows a sharp rejection near the 200-day SMA (currently at $17.79), followed by a 16% drop that pushed LINK below the 200-day EMA ($16). This move confirms a breakdown of bullish momentum and highlights growing downside risk as traders reassess short-term expectations.

LINK retraces from the 200-day SMA | Source: LINKUSDT chart on TradingView

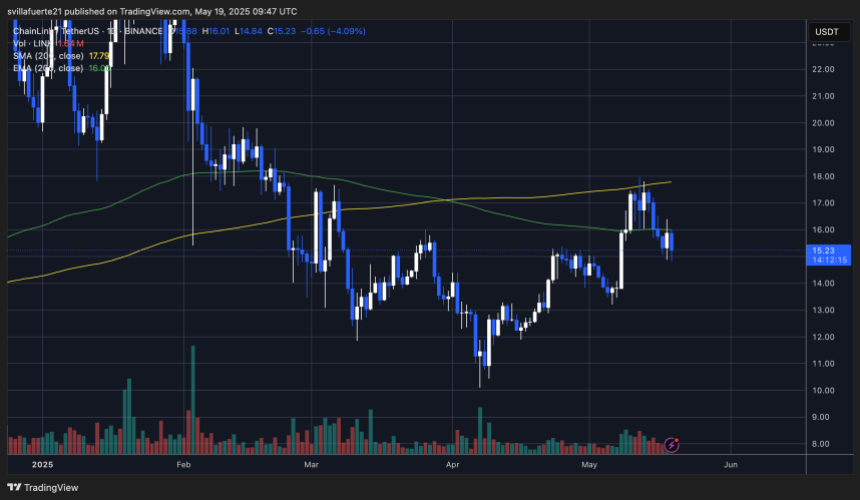
Volume has picked up during the recent pullback, suggesting active profit-taking or renewed selling interest. The current support zone lies around $14.80–$15.00, a region previously tested in late April and early May. If bulls fail to hold this level, the next major support rests closer to $13.20, potentially opening the door for a deeper correction toward the $10 mark—an area cited by analyst Ali Martinez.

To regain momentum, LINK must first reclaim the $16 zone and flip the 200 EMA back into support. A daily close above both the 200 EMA and SMA would shift sentiment and restore the bullish structure. Until then, traders should watch for continuation signals or further weakness, especially if broader market volatility persists. LINK is in a make-or-break phase, with the next few days likely to set the tone for its short-term trajectory.

Featured image from Dall-E, chart from TradingView

Chainlink (LINK) Bullish Structure Hangs On Key Support Zone – Analyst

In line with the general crypto market, Chainlink (LINK) registered a significant price gain in the last week rising by 20.41% according to data from CoinMarketCap. Interestingly, X-based market analysts More Crypto Online have rolled out a market condition critical to sustaining this price uptrend.

Chainlink Faces Potential Correction

In a recent X post, More Crypto Online shared a cautious technical analysis of the LINK market. Using the Elliott Wave Theory, these analysts have determined Chainlink must stay above $23.85 to preserve its current bullish trend. For context, the Elliott Wave Theory is a trading tool used by traders to predict market breeds based on crowd psychology and market cycles.

Chainlink

In price prediction, the Elliott Wave Theory can often present a white scenario i.e. the optimistic bullish case and the yellow wave i.e. an alternative case most likely a correction before an uptrend continues. For the LINK market, the white scenario assumes upward movement will continue provided the asset stays over $23.85 which represents a critical support zone.

Any price fall below $23.85 could cause a shift in market dynamics, potentially halting Chainlink’s bullish charge. However, there is also potential for a corrective yellow wave. In this context, this yellow wave follows as an initial upward movement and represents only a temporary pullback before the trend resumes its bullish trajectory.

According to the analysts at More Crypto Online, if LINK dips below $23.85, the corrective wave is expected to occur between $19.26 and $22.39, converting this region to a potential retracement zone for further gains.

Chainlink Heading For Major Price Break? 

In other news, certain crypto analysts are highly bullish on LINK amidst the asset’s price rally. In an X post, market pundit AMCrypto has backed Chainlink to experience massive price gains in February.

According to AMCrypto, LINK is currently still in consolidation despite recent gains. The analyst predicts the cryptocurrency will experience more weeks of range-bound movement below $30, before executing a major price breakout in February. Based on AMCrypto’s forecast, Chainlink is expected to trade as high as $54 in this projected price surge indicating a potential 125.37% gain on the coin’s current market price.

At the time of writing, LINK trades at $23.95 following a 2.75% decline in the past day. On the other hand, the tokens’ trading volume valued at $957.45 million reflects a 13.97% gain in the past day. With a market cap of $23.94 billion, Chainlink continues to rank as the 12th largest cryptocurrency in the world. 

Chainlink

Chainlink Retests $14: Here’s What Will Happen If Support Holds

Chainlink has registered some drawdown and has recently retested the $14 level. Here’s what might happen if support holds at this mark.

On-Chain Data Suggests Resistance Is Thin At Higher Chainlink Levels

As pointed out by analyst Ali in a new post on X, Chainlink is currently in a critical on-chain demand zone. In on-chain analysis, a price range is defined as major support or resistance based on the number of investors or addresses that bought their coins inside the said range.

To any holder, their cost basis is naturally fundamental, as their profit/loss situation can flip whenever the cryptocurrency retests it. For this reason, an investor becomes more likely to show a move whenever such a retest takes place.

If the holder had earlier been holding a loss, but the price has now risen and reached its equilibrium point, they might lean towards selling. This is because they might fear their holdings would go into loss again shortly, so exiting at break-even wouldn’t sound like a bad idea.

The opposite can be true when the retest occurs from above: the investor might be willing to buy more, thinking that if this same cost basis proved profitable earlier, it would do so again soon.

A single investor making such buy or sell moves is insignificant for the rest of the market, but if many investors share the same cost basis, the asset could feel a sizeable reaction when the price retests the level.

Now, here is a chart that shows how the Chainlink ranges around the current price look in terms of the density of investors who bought inside them:

Chainlink Cost Basis

As displayed in the above graph, the Chainlink levels from $13.8 to $14.2 host the cost basis of about 11,470 addresses, which acquired 23.45 million LINK inside this range.

This range is notably thicker than any other range immediately below or above the asset’s current price. LINK has been floating around this range recently, meaning it has been retesting this major support zone.

From the chart, it’s apparent that the ranges above don’t contain that many investors, so in theory, a move toward the higher levels shouldn’t be too hard for the asset.

However, the trouble would be if this support area is lost and LINK slips under it for an extended duration. This dense zone will turn into a resistance wall if this happens, making it hard for the cryptocurrency to recover above it.

Ali notes, though, that if Chainlink can remain above this zone, the price could climb towards new highs for the year 2023.

LINK Price

Chainlink had slipped below this range just earlier, but the asset was quick to recover above it, implying that it’s still holding up as support.

Chainlink Price Chart

Chainlink Has Massive Resistance Ahead, Will The Rally End Soon?

On-chain data shows there is major resistance ahead for Chainlink, a sign that could be troubling for the rally’s sustainability.

Only 55% Of Chainlink Investors Are In Profit So Far

As explained by an analyst in a post on X, Chainlink is still behind Bitcoin in terms of investor profitability despite the LINK price outperforming BTC in the year so far.

The below chart shows what the LINK address concentration looks like on the different price ranges that the asset has previously visited:

Chainlink Cost Basis

Here, the size of the dot represents the number of investors or addresses who purchased their coins inside the particular price range. It would appear that the ranges below $10 are host to the cost basis of a hefty number of holders.

Since the LINK price is above these levels right now, these investors would naturally be in a state of profit. These addresses only make for about 55% of the network total, however, implying that a significant number of them are still sitting at a loss. From the chart, it’s visible that the $16 to $27 range in particular has a considerable density of investors.

In on-chain analysis, major support and resistance levels are defined on the basis of the number of investors that are at a particular range. This is because of the fact that whenever the spot price interacts with the cost basis of an investor, they become more likely to show a move.

When the price retests the cost basis from above, the holder may decide to buy more. The reason behind this is that they might tend to believe that the level, which had been profitable for them earlier, might produce gains in the future again, so it would appear like an ideal point of accumulation for them.

On the other hand, the red holders might see the break-even point as a decent exit point, as they might fear that the cryptocurrency would go back down in the near future, so going out here at least means they can avoid taking any losses.

Such buying or selling from just a few investors when the price retests their common cost basis doesn’t produce any effects on the macro scale, but if a large number of investors bought at the same level, the reaction might be more pronounced.

Thus, the Chainlink levels ahead until the $27 mark might prove to be a source of some heavy resistance, making the rally hard to sustain through them.

The analyst notes, however, “once LINK breaks the $27 mark, the ensuing rally is expected to be substantial. Alongside this, the wallet profitability ratio is projected to surpass 80%.”

As mentioned before, Bitcoin’s investor profitability distribution is looking much better so far, as the below chart from IntoTheBlock shows:

Bitcoin Cost Basis

Bitcoin is currently battling against the resistance offered by the current investor-packed $34,100 to $35,100 range. Once BTC is through these levels, however, the road towards $40,000 might prove to be relatively easy.

LINK Price

Following its 12% rally in the past week, Chainlink is now sitting just below the $12.9 mark.Chainlink Price Chart