Investors Flock To Stacks (STX) As It Gains 10% Against The Bears – Here’s Why

Although the market is experiencing an enormous pullback from its month-long rally, a few outliers continue on their upward march. Stacks (STX) is one of the few altcoins that stemmed the bearish tide and even went against the grain of the market. According to Coingecko, the token is up nearly 21% in the weekly timeframe.

However, STX is starting to feel the pressure. As of writing, the token is already down 3% in the past hour. This brings the question of whether STX bulls can continue the rally or will falter along with the others. 

A New Project Enters The Fray

In an exciting turn of events, the Stacks Status X account posted an update about network congestion that happened yesterday. 

“An exciting new project bringing Ordinals and Stacks closer together launched this weekend. We’re thrilled to see it, but flagging that as a result, the network is seeing increased fees and likely congestion,” said the X account on their recent thread. 

This event is taken as a sign that Stacks is entering a painful growing phase that may or may not signal a brighter future for the network. However, running alongside this congestion is the most recent blog post of the dev team. 

According to muneeb.btc, the code for the Nakamoto Testnet (now branded as Neon) is not complete and will be launched by the end of the month. 

Nakamoto will be the update that will define the network. 

The Stacks’s Notion site announced

“The Nakamoto release brings many new capabilities and improvements to the Stacks blockchain by focusing on a set of core advancements: improving transaction speed, enhancing finality guarantees for transactions, mitigating Bitcoin miner MEV (miner extractable value) opportunities that affect PoX, and boosting robustness against chain reorganizations.” 

If this testnet launch betters the usability of the network and the experience of its users, it will bring a certain bullish yearend for STX.

Related Reading: Internet Computer Loses Grip On $10, But Still Inks 82% Rally – Details

Stacks Stuck In Between Two Rocks

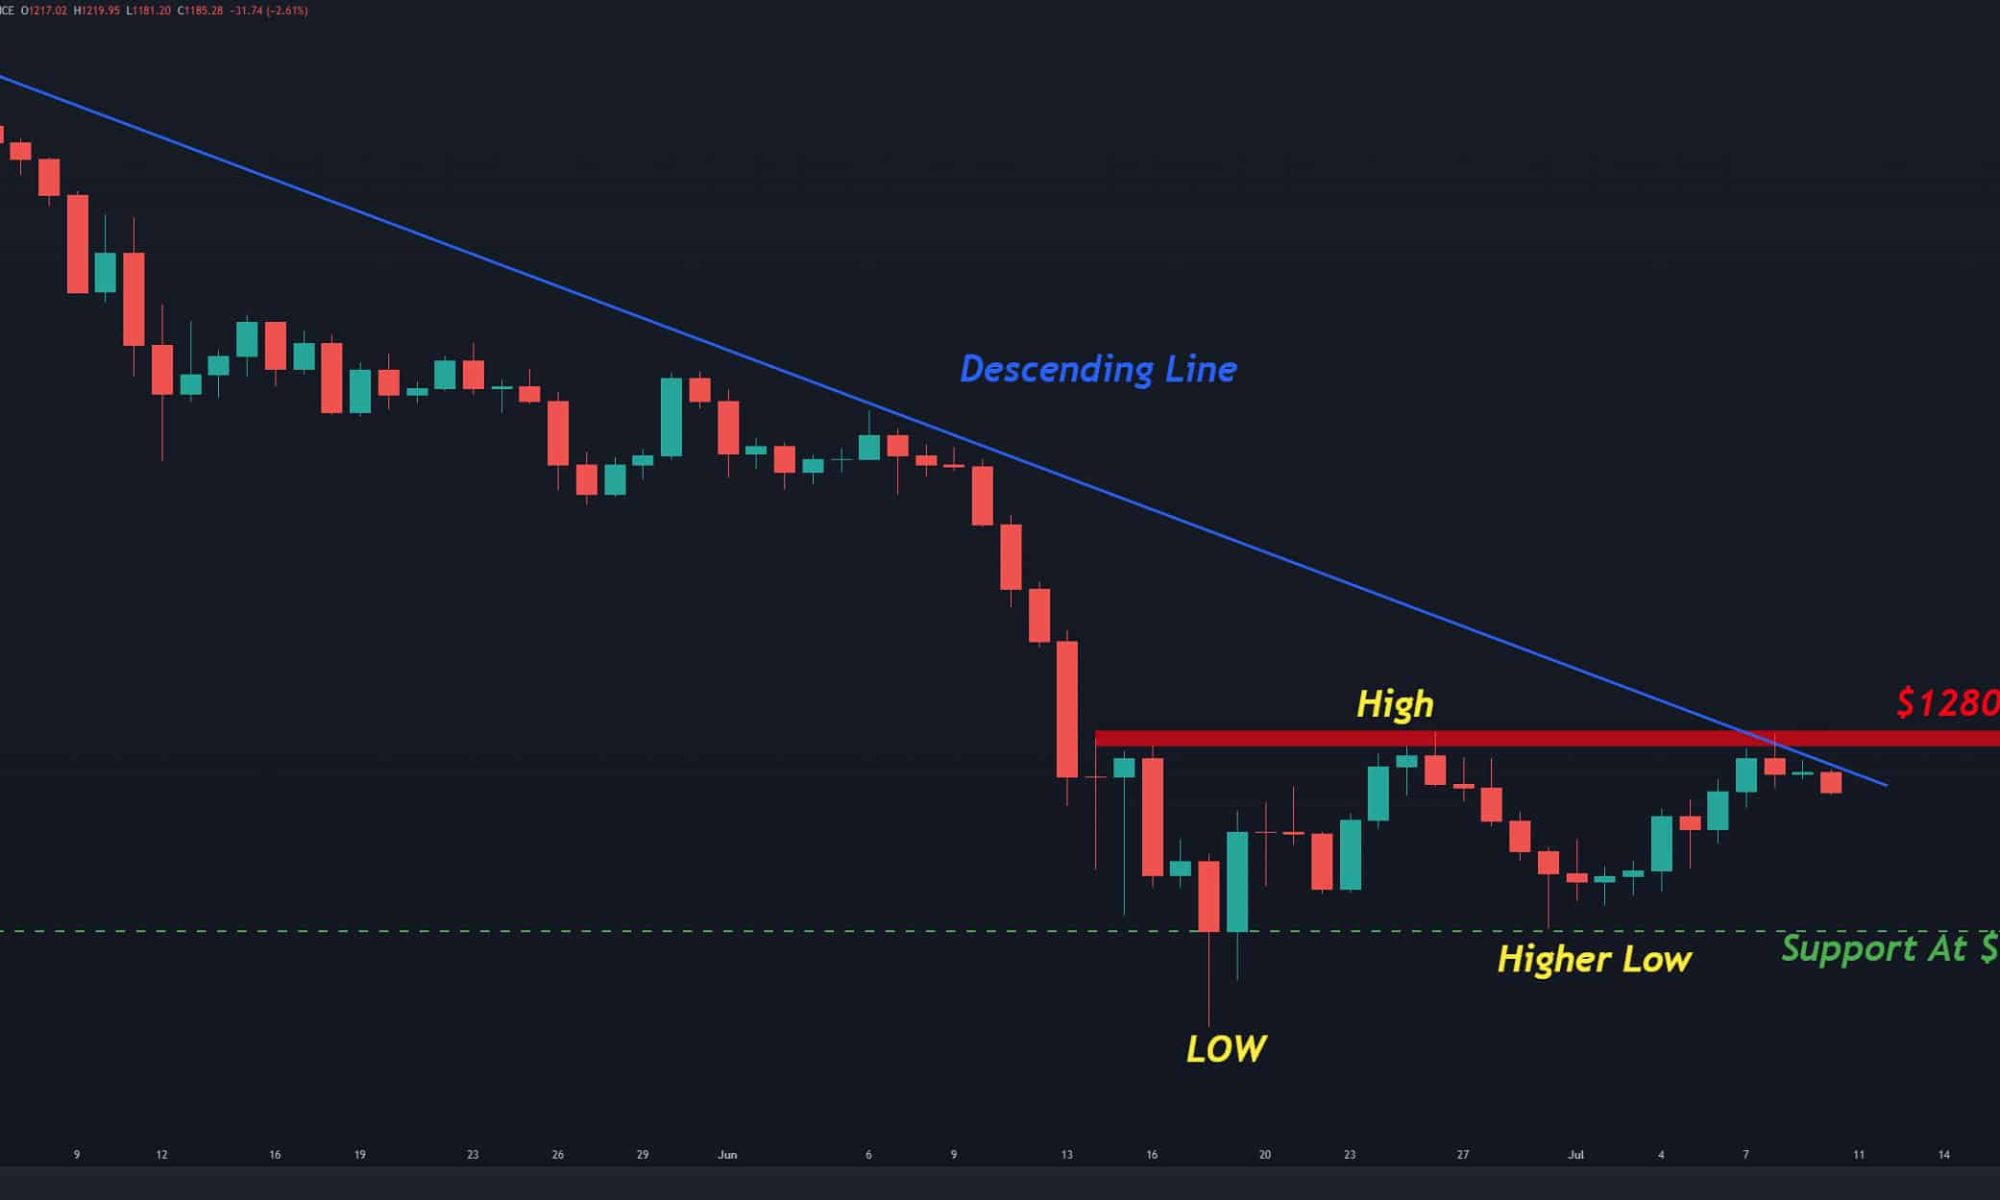
At the time of writing, STX bulls are trying to break out of the $1.1185 price ceiling which has been held by the bears since the start of the month. If the bulls manage to take this price level, STX will continue to reach higher highs. 

However, the current market conditions might prohibit such price movements. Even with a bullish case for the yearend, the token might stabilize between $0.9594 and $1.1185 in the coming days. 

Featured image from Pixabay

ETH Struggles To Break Past $1,300 Resistance – Back To $1K?

ETH, post-merge, has taken traders and investors on a thrilling adventure. The value of Ethereum has decreased by a stunning 26.36 percent since the much-hyped Merge.

The token’s recovery from June to August was fully erased by this decrease and the market catastrophe on September 13.

Fears of a further decline for the token are palpable as the price struggles to break through the 61.80 Fib level, currently at $1,329, following the U.S. Federal Reserve’s interest rate hike announcement. This might indicate that prices will continue to fall.

ETH On A Downward Trajectory

There was a precipitous drop in ETH’s price from September 13-19, fairly dissimilar to the drop in May and June but far lower in magnitude.

The result is the same, though; a dramatic drop in investor trust in both the token and the ecosystem as a whole.

The ETH TVL hasn’t improved much after the switch to proof-of-stake. It fell from $34.63 billion to $30.38 billion between September 13th and 19th, the same time period as last year, which is a massive decline of 12.27%.

As of this writing, the price of the coin oscillates above and below the $1,300 area. This can be understood as a continual conflict between bulls and bears.

Additionally, ETH encountered a rejection wick earlier today, September 26. However, this bearish trend could be short-lived.

Likelihood Of A Positive Price Momentum

ETH has shown indicators of possible positive momentum on the micro and macro levels as of today. This can serve as a glimmer of optimism for ETH traders and investors.

The Stoch relative strength index has been increasing from oversold area. This indicates that the bulls are gathering momentum, which could propel ETH past the $1,300 price resistance.

ETH has already accomplished this on both the micro and macro scales as of this writing.

On the 1-hour chart, Ethereum bulls are currently attempting to consolidate their position above the indicated resistance in order to convert it into a support. he momentum indicator is trending upwards.

However, this is likely merely a tiny pump-in cost. As the price fell 4.04% between the end of September 25 and the beginning of September 26, traders may be buying the dip.

This price decline may give day traders with an investment opportunity.

ETH total market cap at $162 billion on the daily chart | Source: TradingView.com

Featured image from CryptoMode, Chart: TradingView.com

Algorand: ALGO Price All Go With Nearly 30% Rally In Last 7 Days

In only the past week, ALGO has grown by a whopping 30%. Some may not be surprised by this development, as Algorand collaborated with FIFA to create FIFA+ Collect, a platform where fans can buy digital collectibles in the form of NFTs. There has been a dramatic impact on the environment as a result of this alliance.

A tweet from @intotheblack shows that the number of unique addresses that have completed their first transaction for ALGO has increased from 5,000 to 20,000.

There has been an increase in the cost of ALGO because to the increased number of transactions using unique addresses. As of this writing, the price of one coin is somewhere between the 23.60 and 38.20 Fibonacci retracement levels, or about $0.3949 and $0.3724.

There is no denying the ripple impact that this collaboration has on all of Algorand. But will the agreement lead to additional price increases, or is this simply a temporary boost?

Image: NFTgators
ALGO Gets Boost From FIFA+ Collect

The price of ALGO increased by 31.18% in a matter of hours on the press day of the FIFA+ Collect release. To sum up, the coin is up 27.54% from September 22nd when trading began till today, September 26th.

As of this writing, ALGO is trading at $0.3662, down 5.8 percent in the last 24 hours, data from Coingecko show, Monday

Information provided by Santiment suggests that the cooperation has an impact beyond only the pricing.

Algorand’s NFT sector has witnessed a dramatic increase in activity. From September 21 to September 22, the total volume of NFT trades surged from $186,000 to a staggering $606,000.

This is not the only positive development for the ALGO token and the Algorand ecosystem in general.

The TVL of ALGO observed an increase in staked tokens. From September 22-24, the TVL increased from $234 million to $263.69 million. The Algorand ecosystem also had a significant overhaul.

Additionally, the ecosystem implemented the State Proof procedure. This version provides an additional layer of protection against quantum threats and enables the development of “decentralized bridges” to connect Algorand to other blockchains.

ALGO Bullish Momentum Subsiding?

At the time of writing, the coin’s price has already reached above the double-bottom support level at $0.3687.

This may indicate that the bullish momentum has waned and the bears are currently taking the driver’s seat.

Considering this, ALGO can fall to a relatively secure position near the 50 Fib level. This level will serve as the token’s support. However, it cannot fall below the indicated Fibonacci level, as this would indicate a bottom on September 22.

ALGO total market cap at $2.25 billion on the daily chart | Source: TradingView.com

Featured image from Forkast, Chart: TradingView.com

Why Cardano (ADA) Could Be Registering Another Decline, Analyst Explains

Cardano faces a new obstacle with the impending Vasil update. Analyst and futures trader Peter Brandt predicts poor performance for the coin based on current trends and projections.

He recently tweeted on the present state of affairs for Cardano.

“This is a fractal chart pattern called a descending triangle. If the construction continues in the fractal, $ADA should have one more significant retreat.” 

The keywords are “should,” and not “must,” Brandt tweeted.

The analyst pointed out the coin’s current trend. Although Cardano has been doing poorly as of late, the market still seems to be anticipating the worse for the currency based on the current downward angle.

Expectations and conjecture are not a guarantee, but they do help to outline the paths the asset could take in the future.

A Crash In The Offing For Cardano?

And as a result of the crypto market’s recent performance, this research may cause investors to worry about a possible impending crash.

The coin’s value has fallen from its recent high of $0.5043 at the market’s closing to its current level of $0.4574. This is a 90% discount, which is huge.

In spite of this, the value of the coin has remained relatively unchanged.

Cardano’s current price has been attempting to extricate from the 78.60 Fib level, which is now located at $0.5025. However, the bulls have not gained sufficient aggressiveness for this, making the price extremely volatile.

This inability to barrel upwards, together with the analysis, may indicate that the larger decline has already begun.

This decline may also be associated with the underperformance of other crypto assets. According to Coingecko, the 10 leading cryptocurrencies have been on a downward trend, with Ethereum losing 10% of its value in just a week.

Broader Market Seen To Experience More Pain

This linkage with leading cryptocurrencies can further push Cardano’s price towards the bottom. As a result of Bitcoin’s decline following the release of the latest CPI report and expectations of a 1% increase in interest rates, the broader market will continue to suffer greatly.

Latest headlines of the Vasil upgrade may not be sufficient to prevent a broad market decline. If Cardano’s future is to be bright, the crypto market as a whole must perform better.

This is extremely unlikely, though, considering Bitcoin closely follows the S&P 500 Index. In light of this, Cardano investors should prepare for another crypto market crash. If investor sentiment is resilient, a catastrophic scenario such as the one we just outlined can still be reversed.

As Cardano’s upgrade nears, additional information should become available over the next few days.

ADA total market cap at $15.5 billion on the daily chart | Source: TradingView.com

Featured image from Cryptocurrency News, chart from TradingView.com

Bitcoin Price Has Strong Potential To Hit $25,000, Weekly Analysis Suggests

Recently, the market has seen a strong correction due to the Bitcoin price bull run of the past several days. On December 7, 2020, the price hit a low of $19,030.09, which is considered to be a new all-time low.

However, the appearance of a double bottom pattern has led to an optimistic outlook on this correction.

Bitcoin can rebound, as is now more evident. Obviously, there will be some challenges along the way. The Bitcoin price present momentum is one of the cryptocurrency’s major challenges.

The current momentum is merely reversing the past downward trends, thus it may not be enough to break through the $25,000 price level, according to latest analyses.

Bitcoin Price: The Familiar Resistance Level

Bitcoin’s price actually did reach $25,000 in late August, which is a significant milestone. Such a pattern indicates that the current market has the potential to and likely will attempt to break through resistance.

Chart: TradingView.com

Looking at the range during the past four hours, it appears that BTC will be trading between $19,226 and $24,286 for the time being.

This challenge is attributable to the traders’ pessimism in response to the most recent CPI report. The survey revealed an annual inflation rate of more than 8 percent.

This bleak assessment could be followed by a 1% increase in interest rates. Therefore, the bulls must maintain their position inside the range of $19,226 to create momentum.

The prominent oscillator indicator has shown a bullish advance. In contrast, the moving averages exhibited bearish indicators.

Sustainable Momentum A Must For Bitcoin

To continue driving the price higher, the bulls must generate persistent momentum. Once more, sustainability will reduce the probability of a dramatic correction.

The price of Bitcoin should not drop below the 71.60 Fibonacci level. If bears break through to the downside, Bitcoin’s price might fall to $18,000.

This occurrence will further bring the price down. A sustainable momentum for a rally should be one of the bulls’ top aims in order to surpass the $25,000 threshold.

However, given the present pessimism and panic on the market, it may be some time before BTC reaches the $25,000 barrier.

BTC total market cap at $384 billion on the 4-hour daily chart | Source: TradingView.com

Featured image from Business World IT, Chart: TradingView.com

Crypto Market Hasn’t Bottomed Yet, Analyst Says – More Pain Ahead?

Notable crypto market analyst Willy Woo has just issued an appraisal on Bitcoin’s performance in the coming months or maybe year.

His analysis shows that the coin has not bottomed out yet.

On Twitter, he said:

“In terms of max pain, the market has not felt the same pain as prior bottoms. We can see this in the blue line (supply in profit by @glassnode). We have only reached 52% of coins being underwater so far. Prior bottoms were 61%, 64%, 57%,” Woo said on his recent tweet detailing his analysis.”

Crypto Market And Its Correlation With Stocks

Bitcoin is highly associated with the S&P 500 Index which fell after the US Federal Reserve’s CPI announcement earlier this week. The announcement highlighted the highest annual inflation rate, which was 8.3 percent.

This is greater than the anticipated rate of 8% for the crypto market. This tragedy has instilled the market with fear and despair. However, the market turmoil that traders and investors are experiencing is not the end of it.

The central bank enacted policies that boosted the economy with fresh cash early on in the global health crisis. This is referred to as quantitative easing. With inflation soaring, the Fed is reportedly mulling a 1 percent interest rate increase.

As was the case in June, this price increase will have a negative impact on the entire crypto market. Following the Fed’s decision to raise interest rates, both the stock and cryptocurrency markets experienced a string of liquidations.

Chart: Glassnode

This sell-off was precipitated by fears of an impending recession and the increase indicated. And this may occur again as the Federal Reserve pursues quantitative tightening strategies to further tackle the persistent inflation problem.

The Small Percentage Matters In Crypto

Another 1% rise might send the larger financial market crashing. As Woo stated, history does not have to repeat itself. However, it is possible that it has already begun in one way or another.

The analyst previously stated that the current low is only at 52 percent, compared to 60+ percent in recent history. If this is the current bottom, then investor and trader mood is likely to be strong.

As of this writing, the S&P 500 was trading at $3,946. If the correlation between Bitcoin and the S&P 500 Index remains, any price movement, favorable or negative, will have an impact on both the broader stock and crypto markets.

Would you say that 52% is the absolute minimum? Time will tell whether or not the Feds raise interest rates. If the Federal Reserve decides to hike interest rates, that will be the absolute low point for the currency.

BTC total market cap at $385 billion on the daily chart | Source: TradingView.com

Featured image from Medium, Chart: TradingView.com

Cardano On White House Crosshair Can Push ADA Up This Route

The recent White House announcement has placed the spotlight on Cardano as the leading Proof-of-Stake blockchain that’s currently on the market. This recent news follows the announcement of the Vasil upgrade which aims to improve usability and scalability. 

A simple Twitter search of ADA will result with tweets of happy and confident traders and investors. 

“Here is the White House energy report showcasing #Cardano as the largest proof of stake blockchain in the world. Probably something,” said Dan Gombardello in a recent tweet. 

Chart: TradingView.com

At the day of the announcement, ADA’s price went up 7.43 percent with a high of $0.5243 before stabilizing at the range $0.5215 to $0.4992. 

Using the regression trend tool, we can clearly see an uptrend forming even several days before the White House announcement. This uptrend formed clearly after the recent crash in the early half of August.

Chart: TradingView.com
Cardano Gets Some Lift From White House Announcement

During this crash, the coin experienced a 25.18 percent drop in price. It continued stabilizing at the $0.4354 support line. Trade volumes have also risen since the announcement at 3.63 million. 

This solid but slow uptrend coupled by the announcement further solidified confidence in the coin.

Trade indicators also point to buy signals as the price further stabilizes at the 50% percent Fib level which sits at the $0.4992 range. The bulls have also tested the 38.20 Fib level which sat at $0.5219 range. 

If the uptrend continues, investing in ADA will be very beneficial to traders and investors. As of this writing, the CCI 80.20 level says a lot about the investors and traders. This means that confidence in the coin might not be very high, but it is stable.

Stoch RSI also points to a rising buy signal. Just like the CCI indicator, it means investor sentiment is slowly rising. 

ADA Poised For A Bullish Run

With the Vasil upgrade around the corner and the White House placing Cardano as the top PoS blockchain, it might place ADA on a slow, bullish run. 

But if the price falls because of a variety of reasons, the crucial support at the 78.60 Fib level should not be broken.

This line has been the support range that backed the slow uptrend in the past few weeks. If this is broken, this can reverse ADA’s upward price movement. 

The next few days will determine if the gathering storm of the bulls will further push the price up. 

ADA total market cap at $17.3 billion on the daily chart | Source: TradingView.com

Featured image from E&E News, Chart from TradingView.com