In their latest analysis, Ark Invest’s crypto specialists Julian Falcioni, David Puell, and Dan White, are presenting a review of the Bitcoin market behavior and prospects, delineating the interplay of various economic, technical, and policy-driven factors that could shape the future of this pioneering digital currency.
Bitcoin Validates The Bullish Scenario
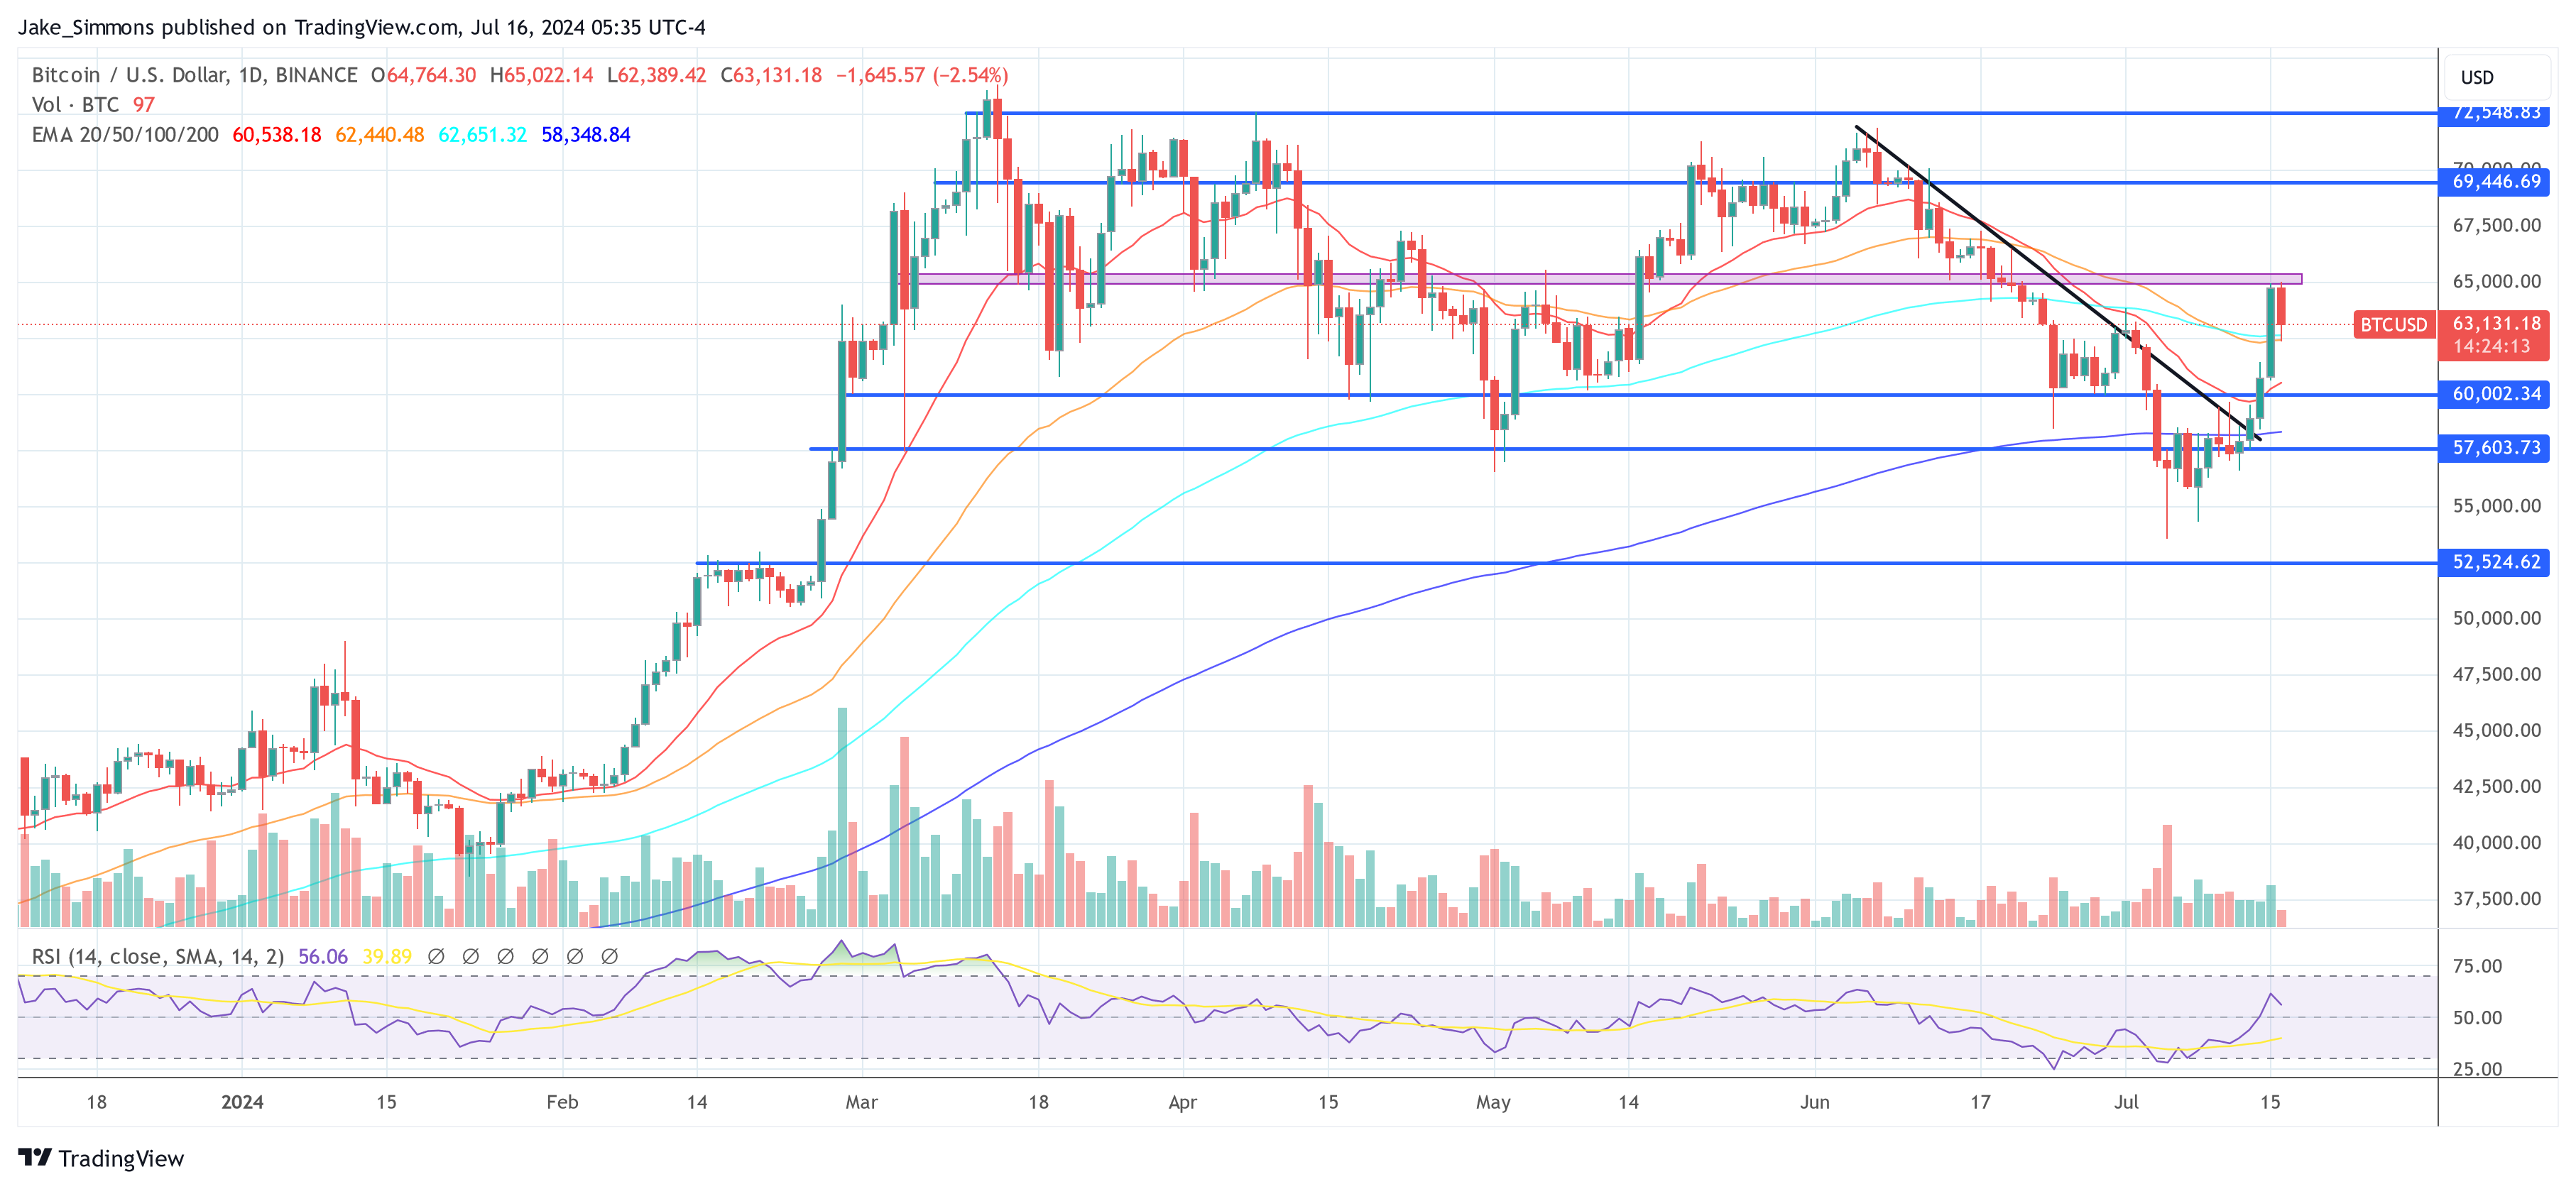
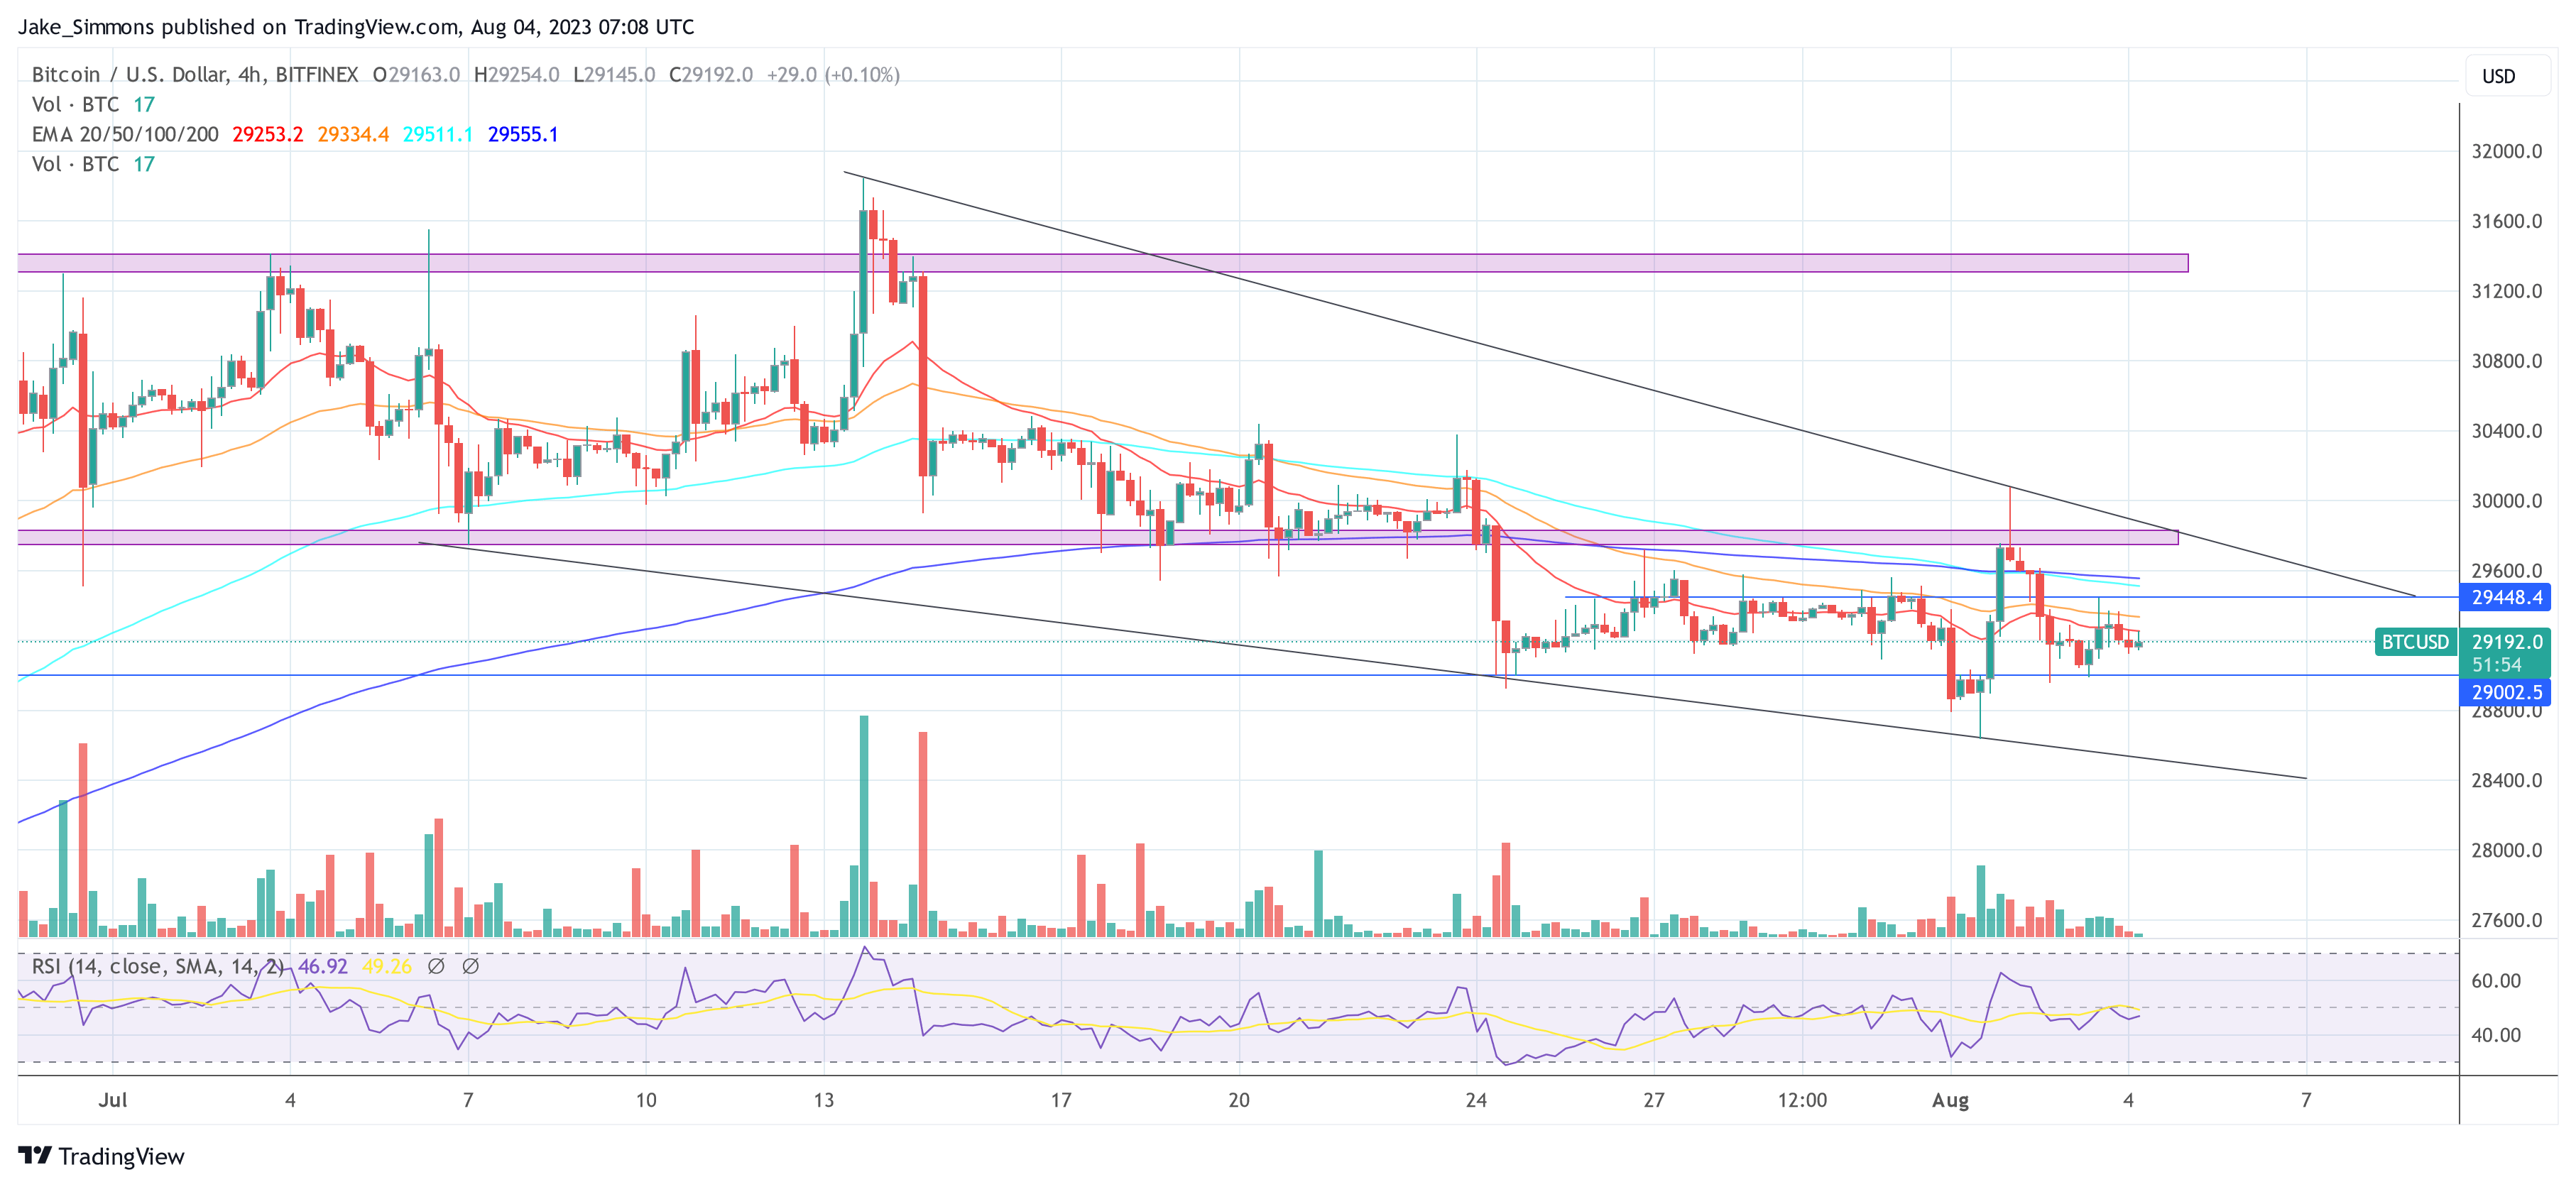
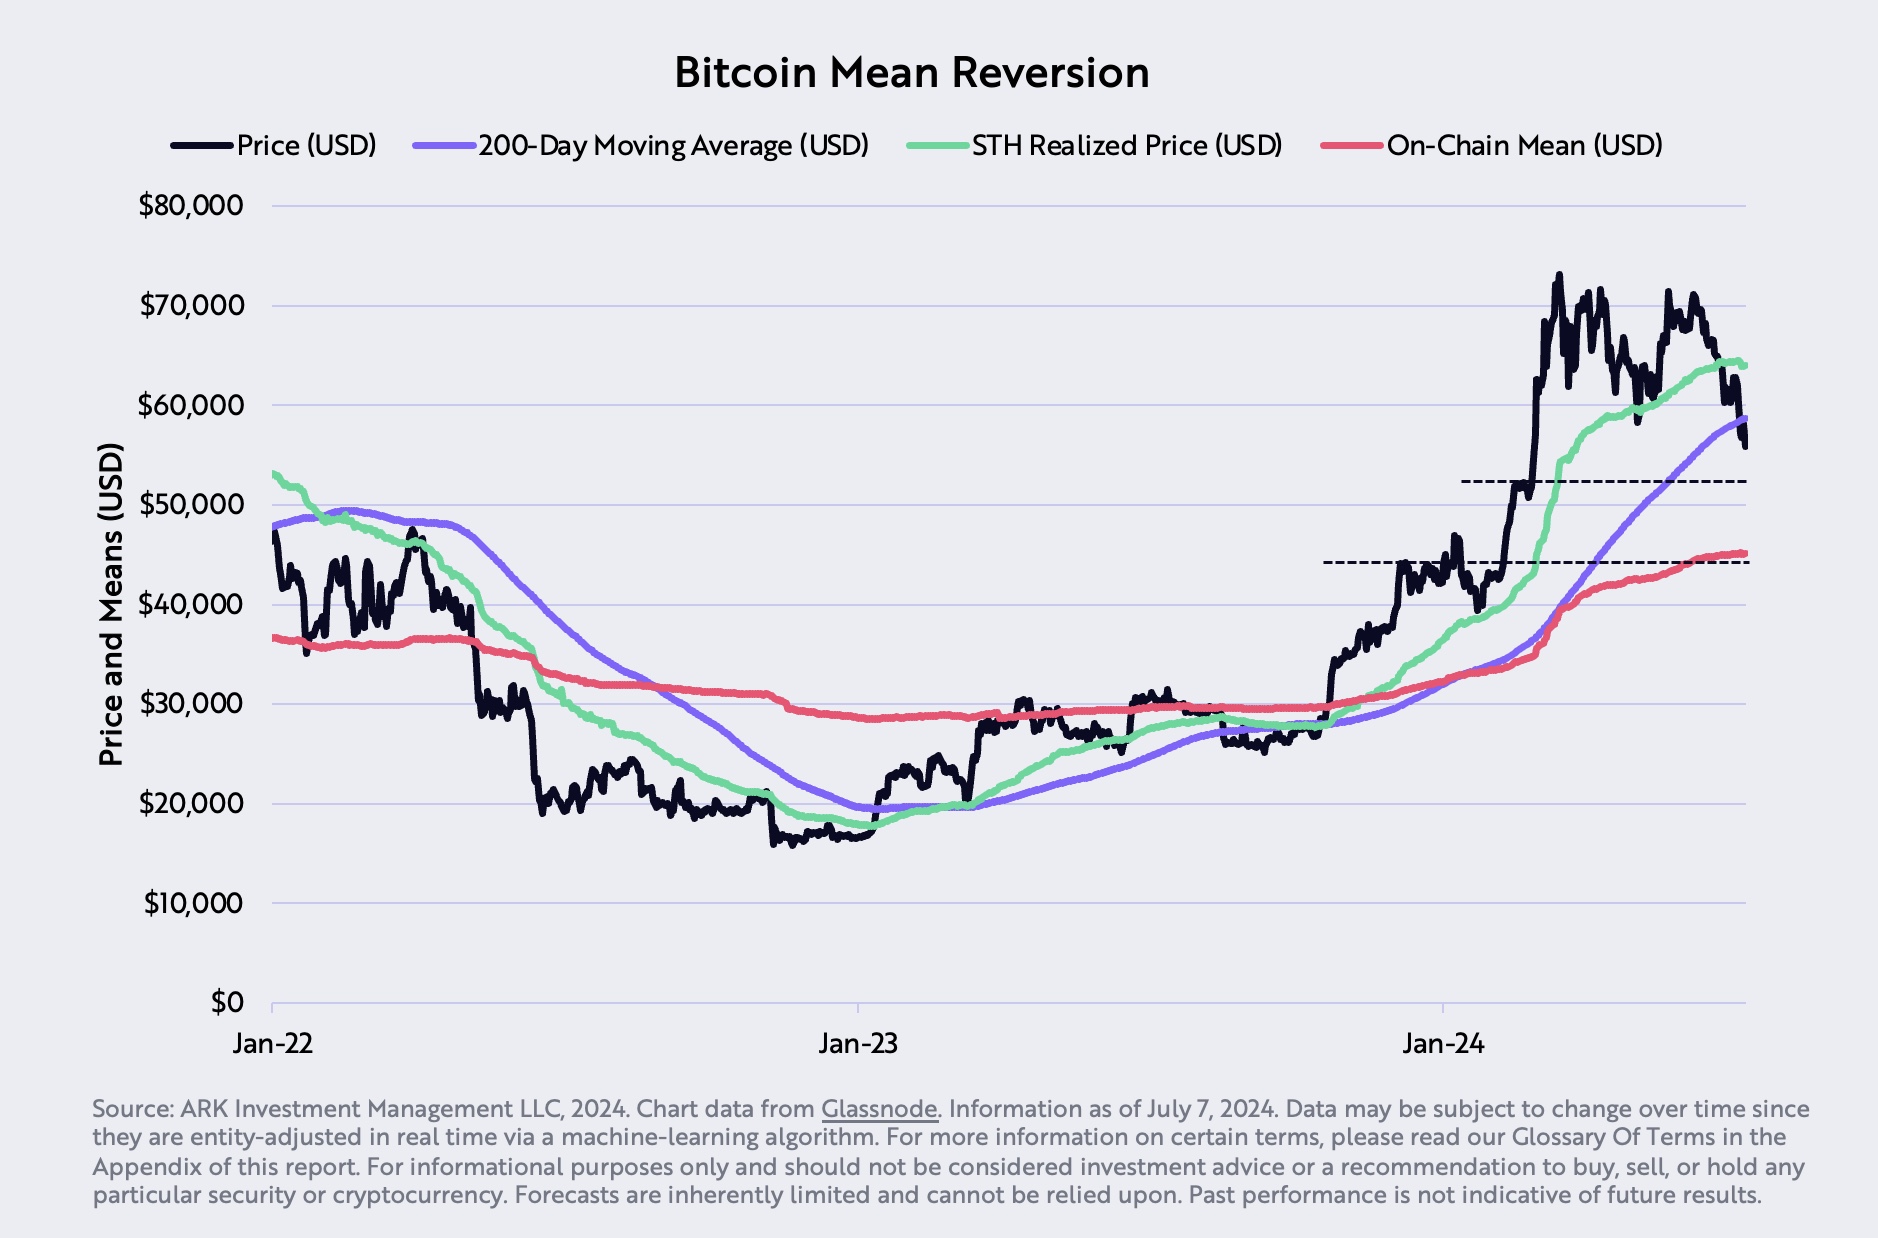
Since early June, Bitcoin witnessed a significant decline, dropping more than -25%. More critically, on July 7, BTC fell beneath its 200-day moving average—a key technical threshold. According to Ark, the dip below the 200-day moving average was “a crucial bearish signal that often precedes further declines unless a strong recovery ensues.” Ultimately, Bitcoin displayed significant strength in the last few days and Ark was right in that BTC staged a quick recovery above the 200-day EMA, invalidating the bearish prospects.
A surprising element in June’s Bitcoin volatility was the aggressive sale of approximately 50,000 Bitcoins by the German government. These assets were seized from the illegal streaming site Movie2K and gradually transferred to various exchanges for sale, starting June 19. “The influx of a large volume of bitcoins during a traditionally low liquidity period, around the July 4th holiday, significantly pressured the price downward,” the report notes. Notably, this selling pressure is now gone.
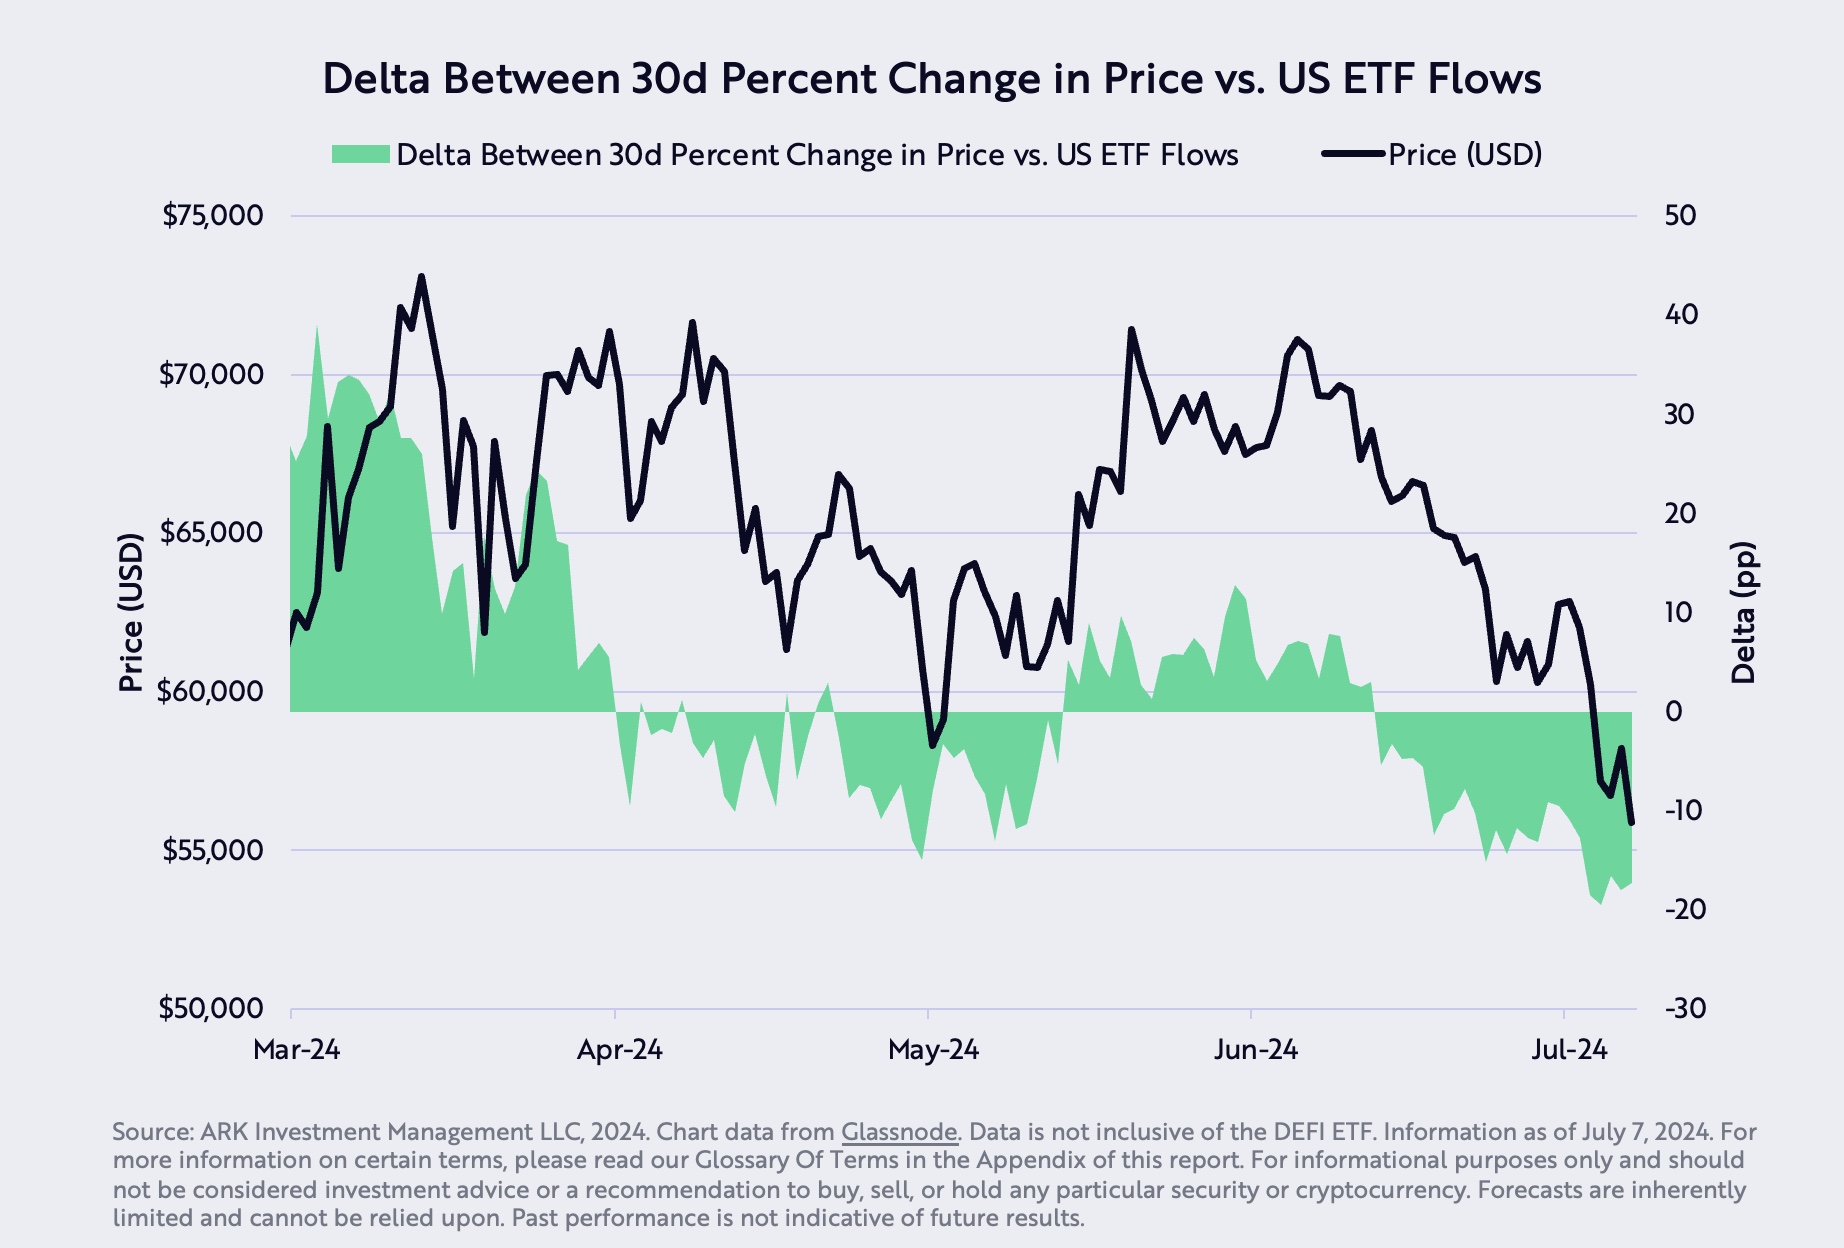
Despite these challenges, Bitcoin managed an impressive rally of more than 17% in the last few days. Several indicators supported this reversal, according to Ark. The discrepancy between the decline in Bitcoin’s price and the lesser drop in US ETF balances—17.3 %—suggested that Bitcoin was oversold. “This overselling is likely driven by external shocks rather than intrinsic market movements, pointing towards a mispricing that could correct in the medium term,” the experts explain.
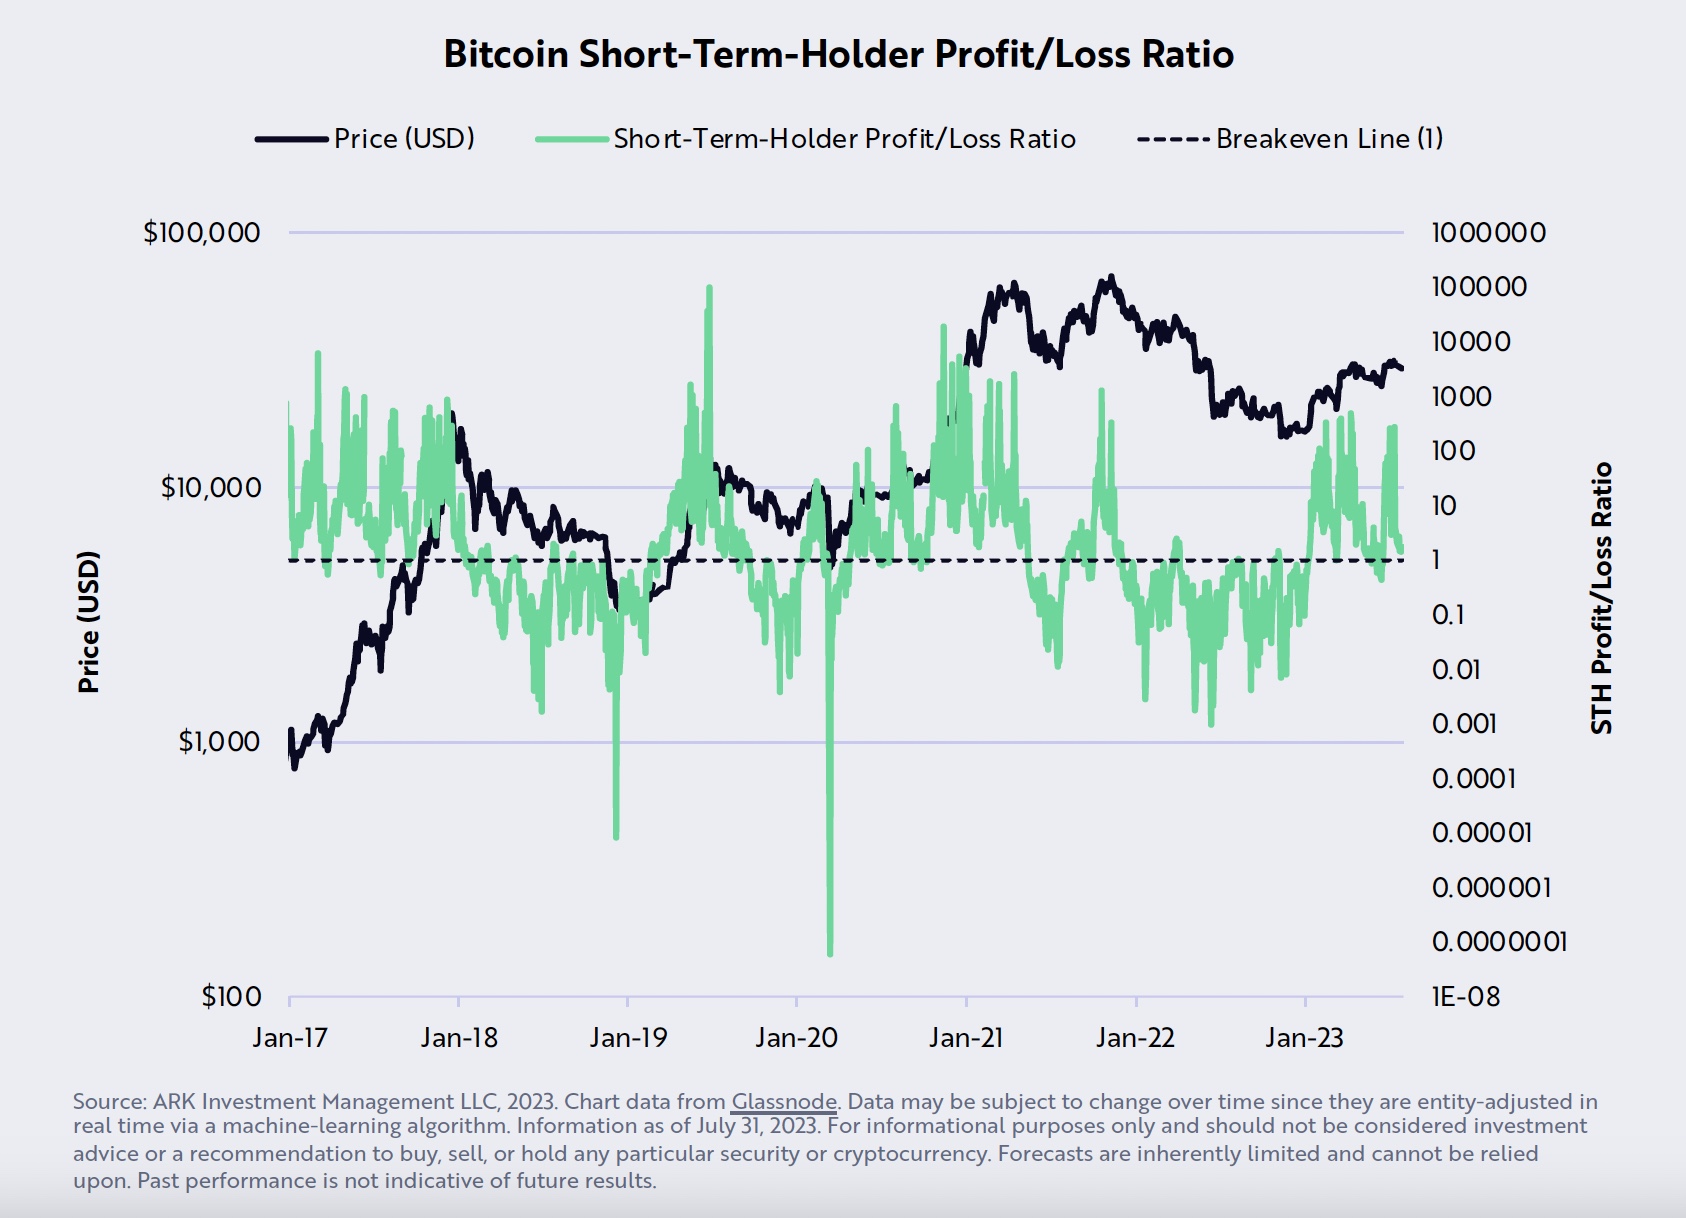
Short-term holders, typically a more speculative segment, have been realizing losses as indicated by the sell-side risk ratio. This ratio, calculated by dividing the sum of short-term holder profits and losses realized on-chain by their cost bases, showed more losses than profits, which typically precedes a short-term market correction.
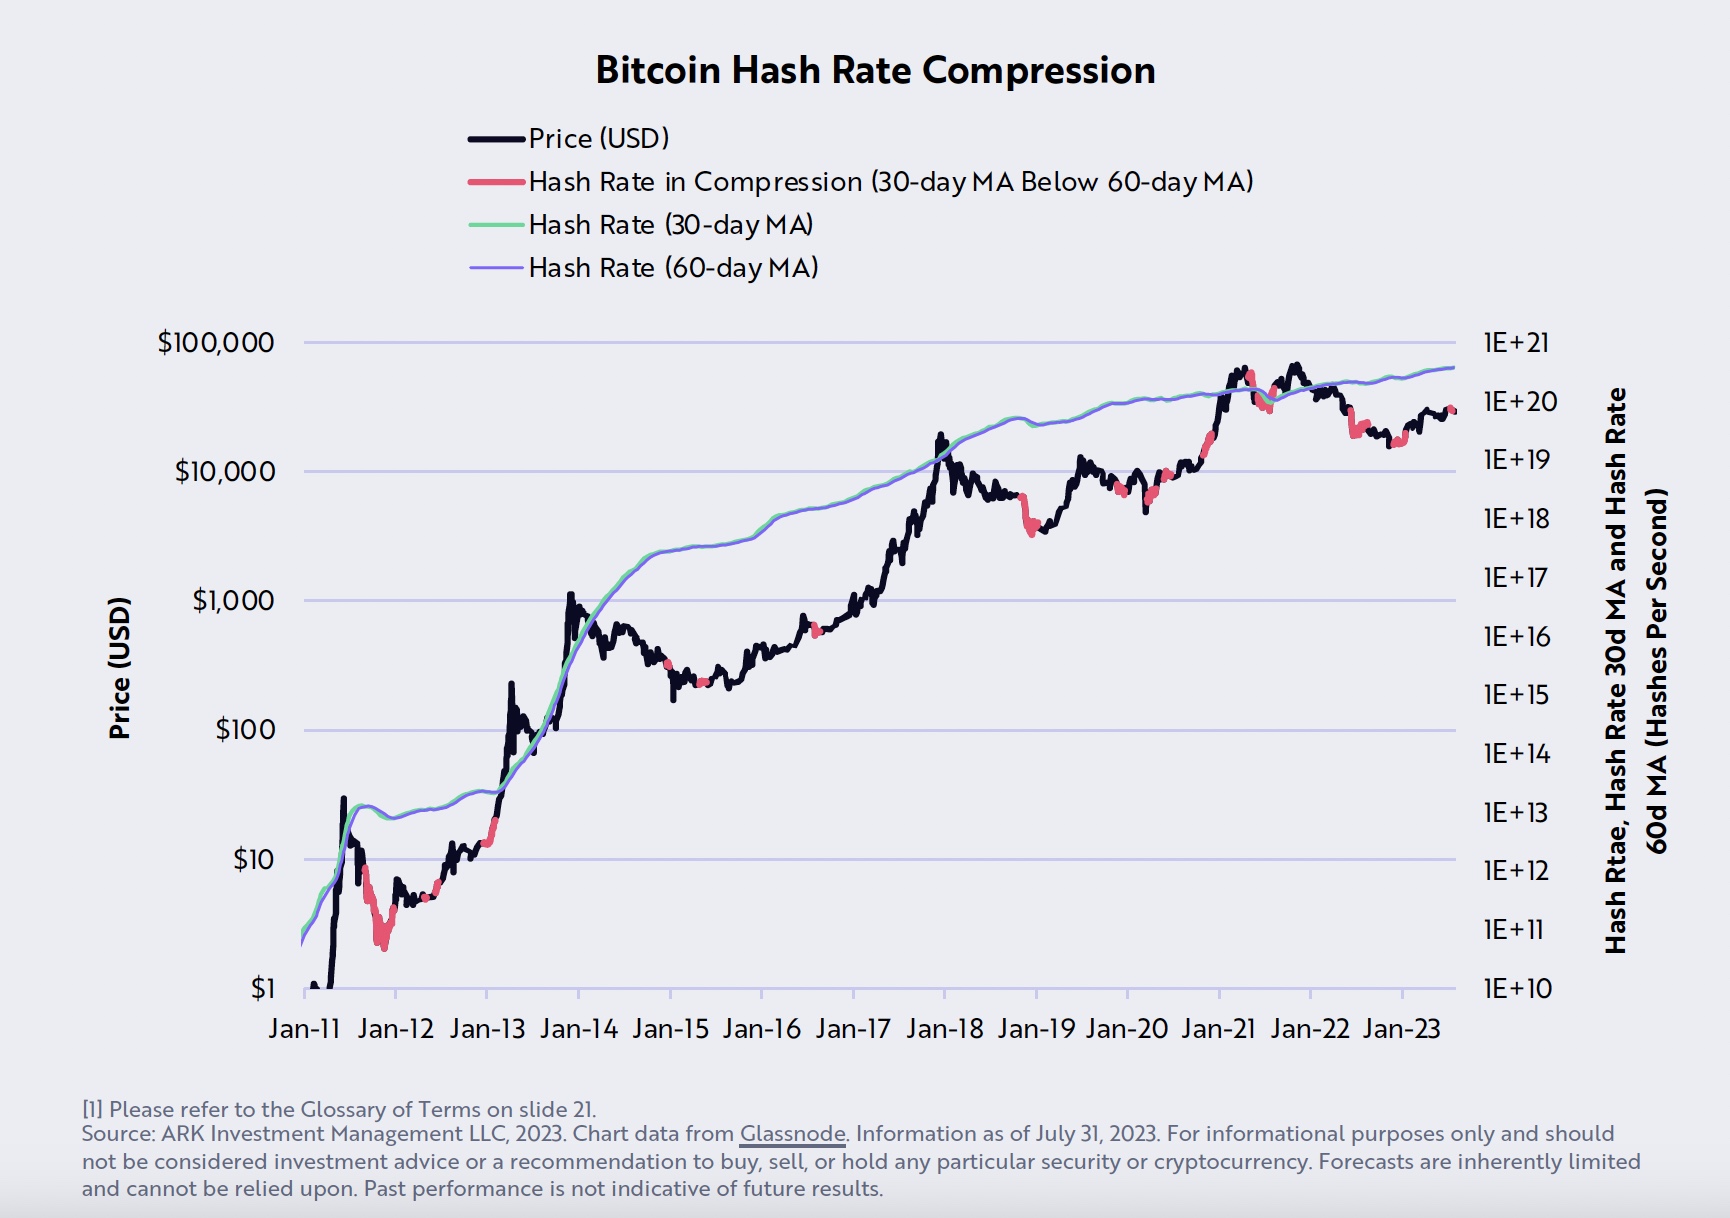
June also saw significant activity from Bitcoin miners. “Miner outflows, which often prelude market adjustments, mirrored patterns observed around previous Bitcoin halving events, when the reward for mining a block is halved,” says Ark. Such events historically lead to a decreased supply and potential price increases as market dynamics adjust to the new supply level.
On the macroeconomic front, the report notes that the US economic data have been consistently underperforming against expectations, with the Bloomberg US Economic Surprise Index registering the most significant negative deviations in a decade. Yet, the Federal Reserve has maintained a surprisingly hawkish tone, which could influence investor sentiment and financial market stability.
Corporate America is not insulated from these challenges. Profit margins, which peaked in 2021, are on a downward trajectory as companies lose pricing power as Ark notes. This squeeze on profits is prompting price cuts across various sectors, further dampening economic outlooks.
Regarding equity markets, there has been a notable increase in market capitalization concentration, reaching levels unseen since the Great Depression. “This concentration in larger entities with significant cash reserves could be an early indicator of a shifting economic landscape, which historically sees a breakout in favor of smaller cap stocks,” the report says.
At press time, BTC traded at $63,131.