Bitcoin Slips Under 200-Day Moving Average – Will The Downtrend Continue?

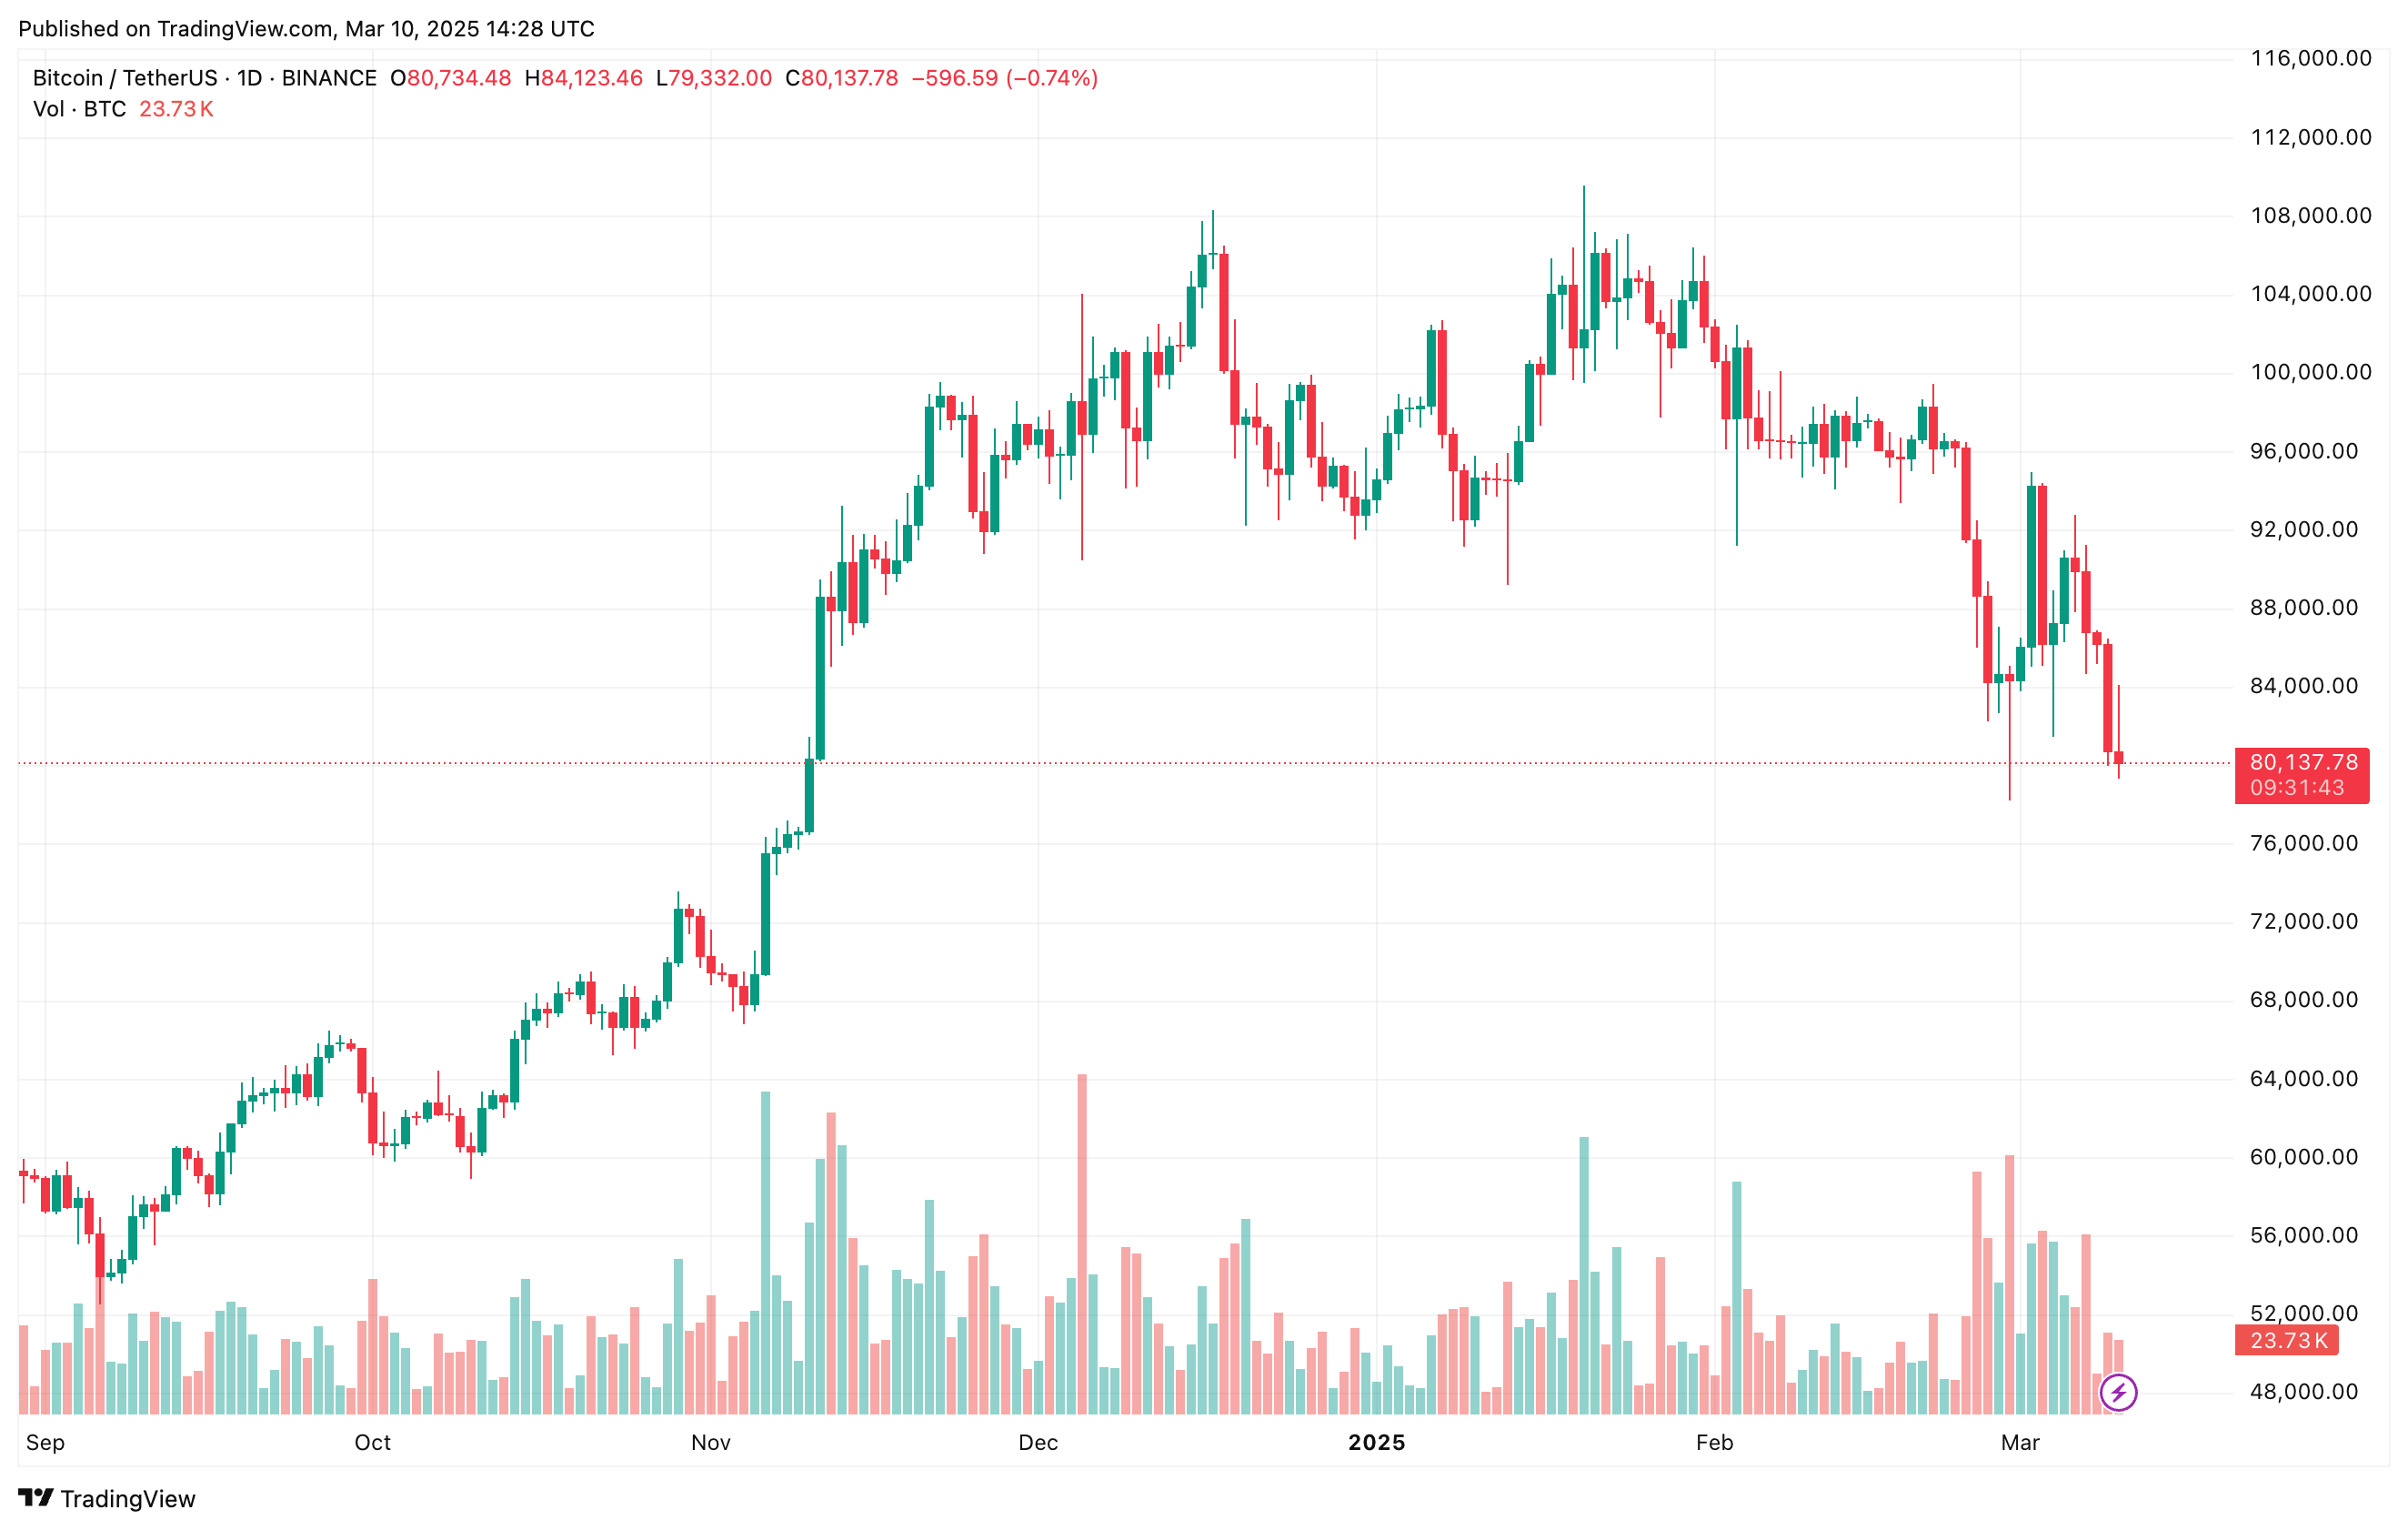
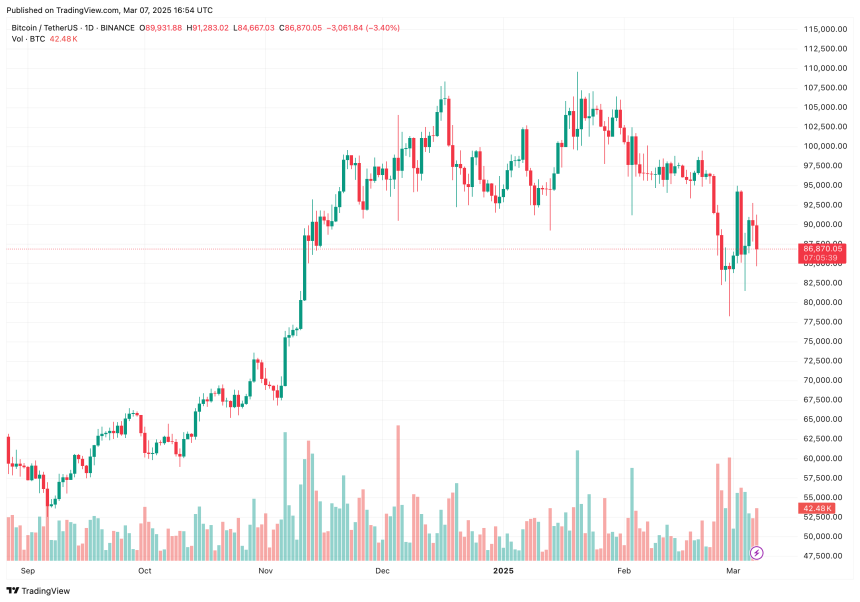
Bitcoin (BTC) has dropped 11.3% over the past week, currently trading in the low $80,000 range at the time of writing. The recent decline has pushed the leading cryptocurrency below the 200-day moving average (MA), raising concerns about a potential deeper pullback.

Bitcoin Must Defend This Key Price Level

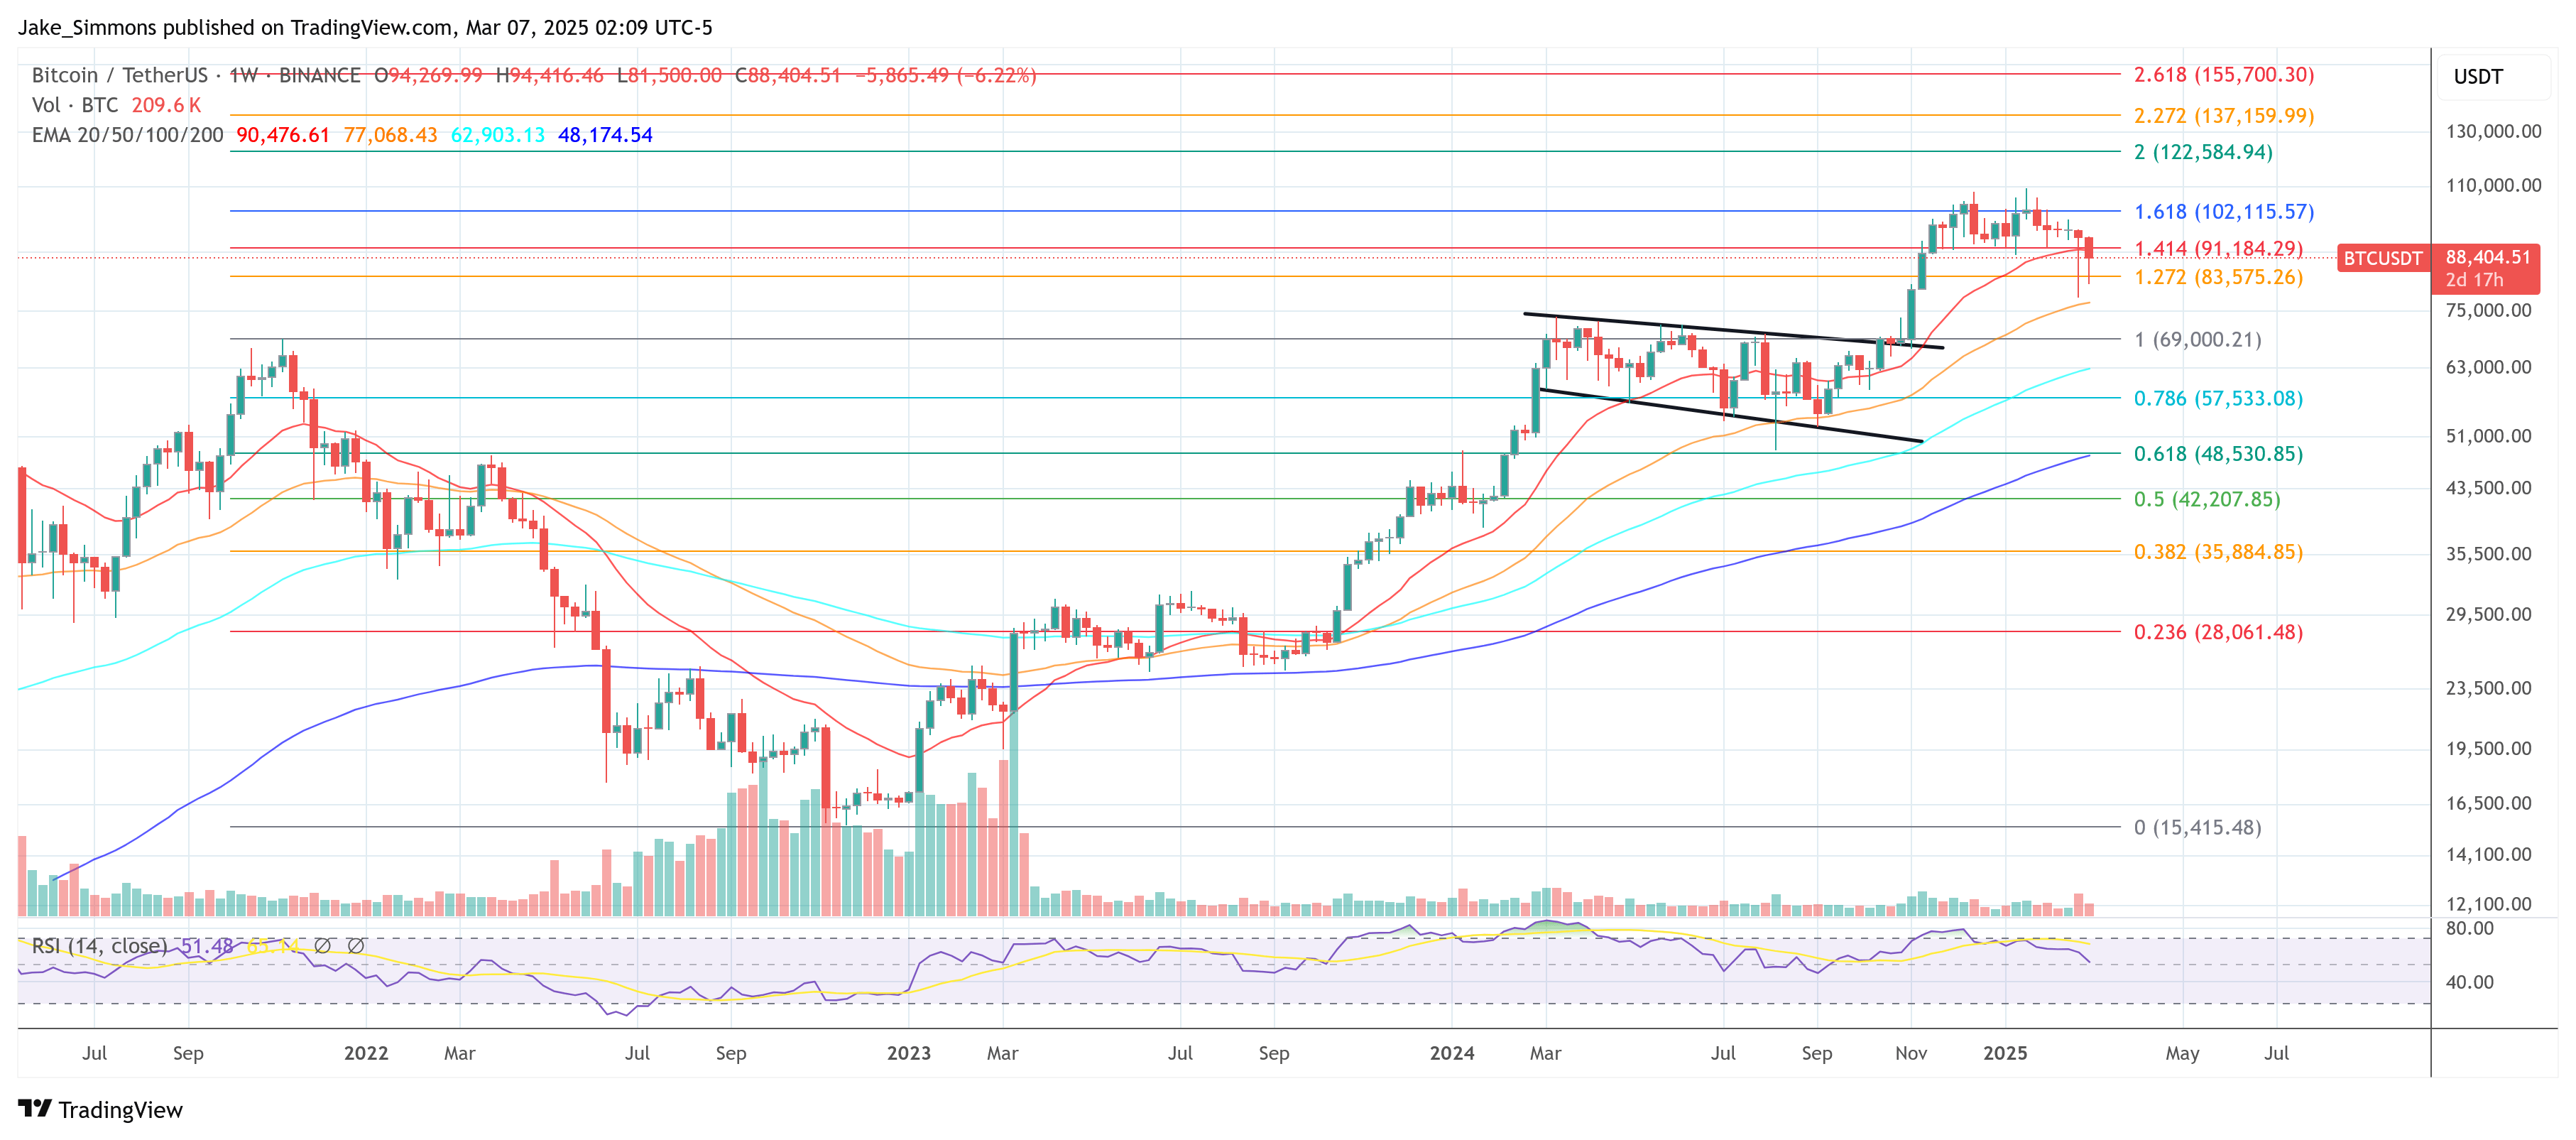
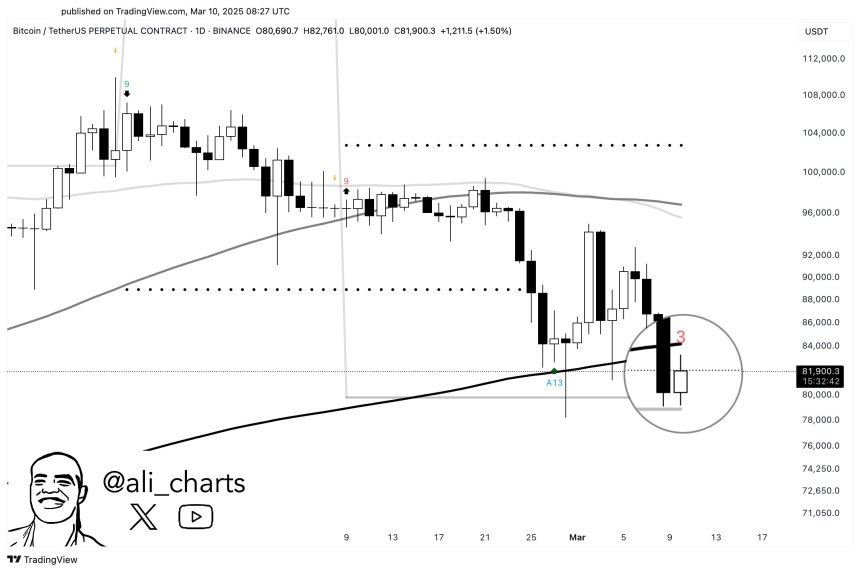
According to an X post by seasoned crypto analyst Ali Martinez, BTC is now trading below the 200-day MA, a key price level that has historically functioned as a strong support for the top digital asset. 

For the uninitiated, the 200-day MA is a famous technical indicator that essentially represents the average closing price of BTC over the last 200 days to identify the long-term price trend. Historically, a sustained movement above the 200-day MA has led to long-term uptrends while a prolonged price movement below the level has often preceded further declines.

Martinez stressed that BTC must remain above the TD Sequential indicator’s risk line at $79,280. He added that a sustained move above this level could set the stage for a strong rebound to the upside.

ali

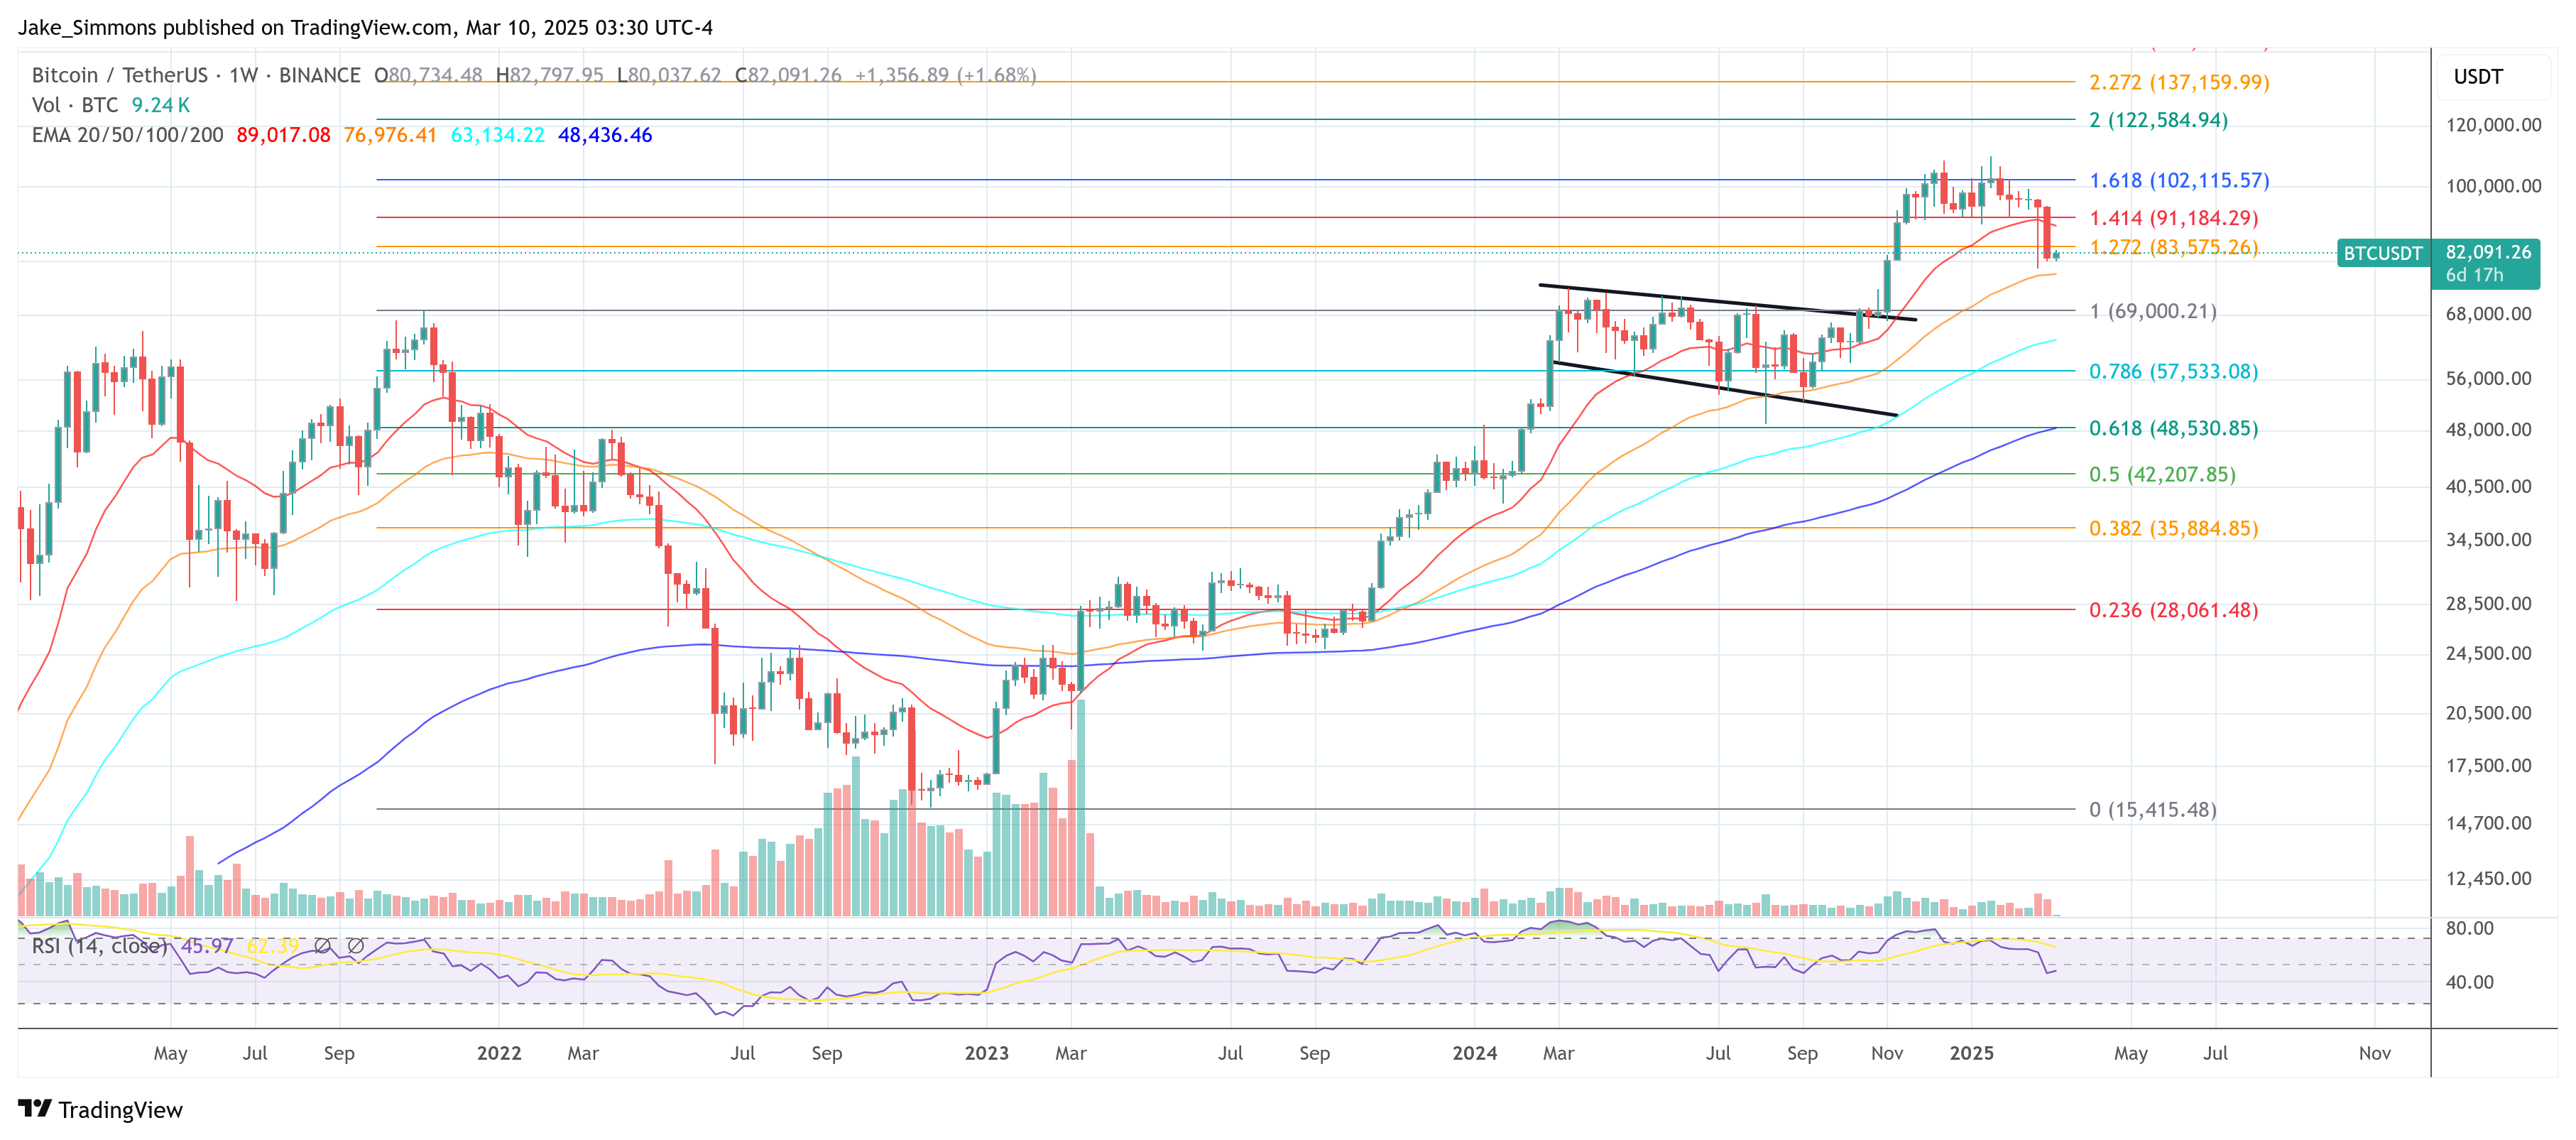
The potential for a BTC recovery was echoed by fellow crypto analyst Ted. In a post on X, he pointed out that over the past two years, BTC has frequently undergone 25% to 30% corrections before rebounding to new all-time highs (ATHs). Ted noted:

In 2023, BTC went from $30K to $22K. In 2024, BTC went from $74K to $50K. This year, BTC has dumped from $109K to $79K. We all know what happened after the last 2 major corrections.

ted

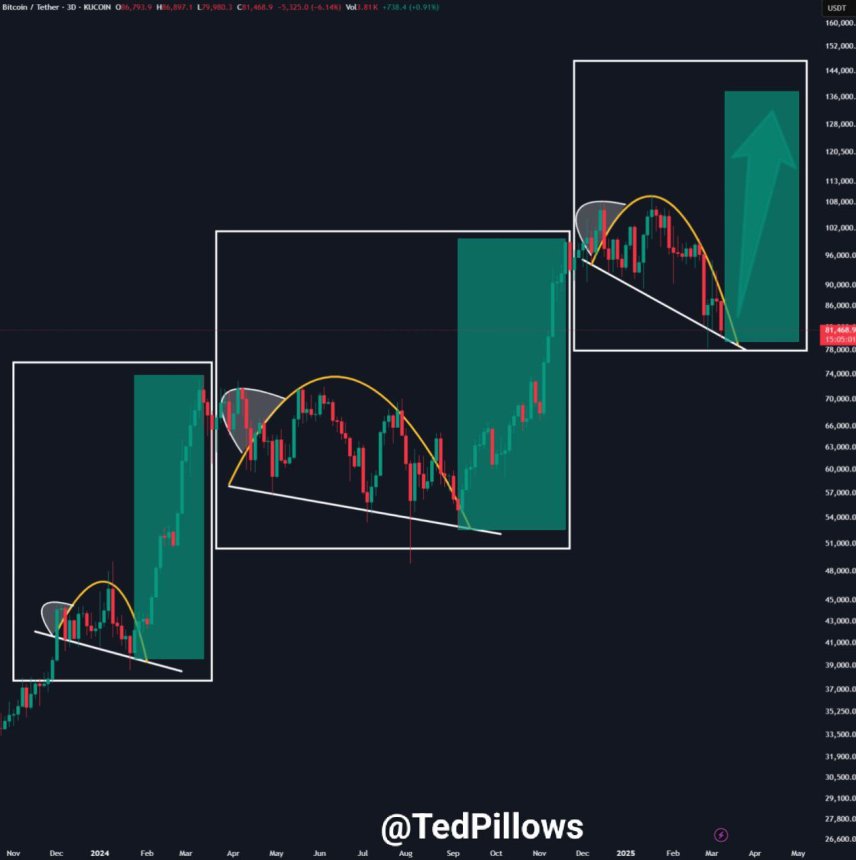
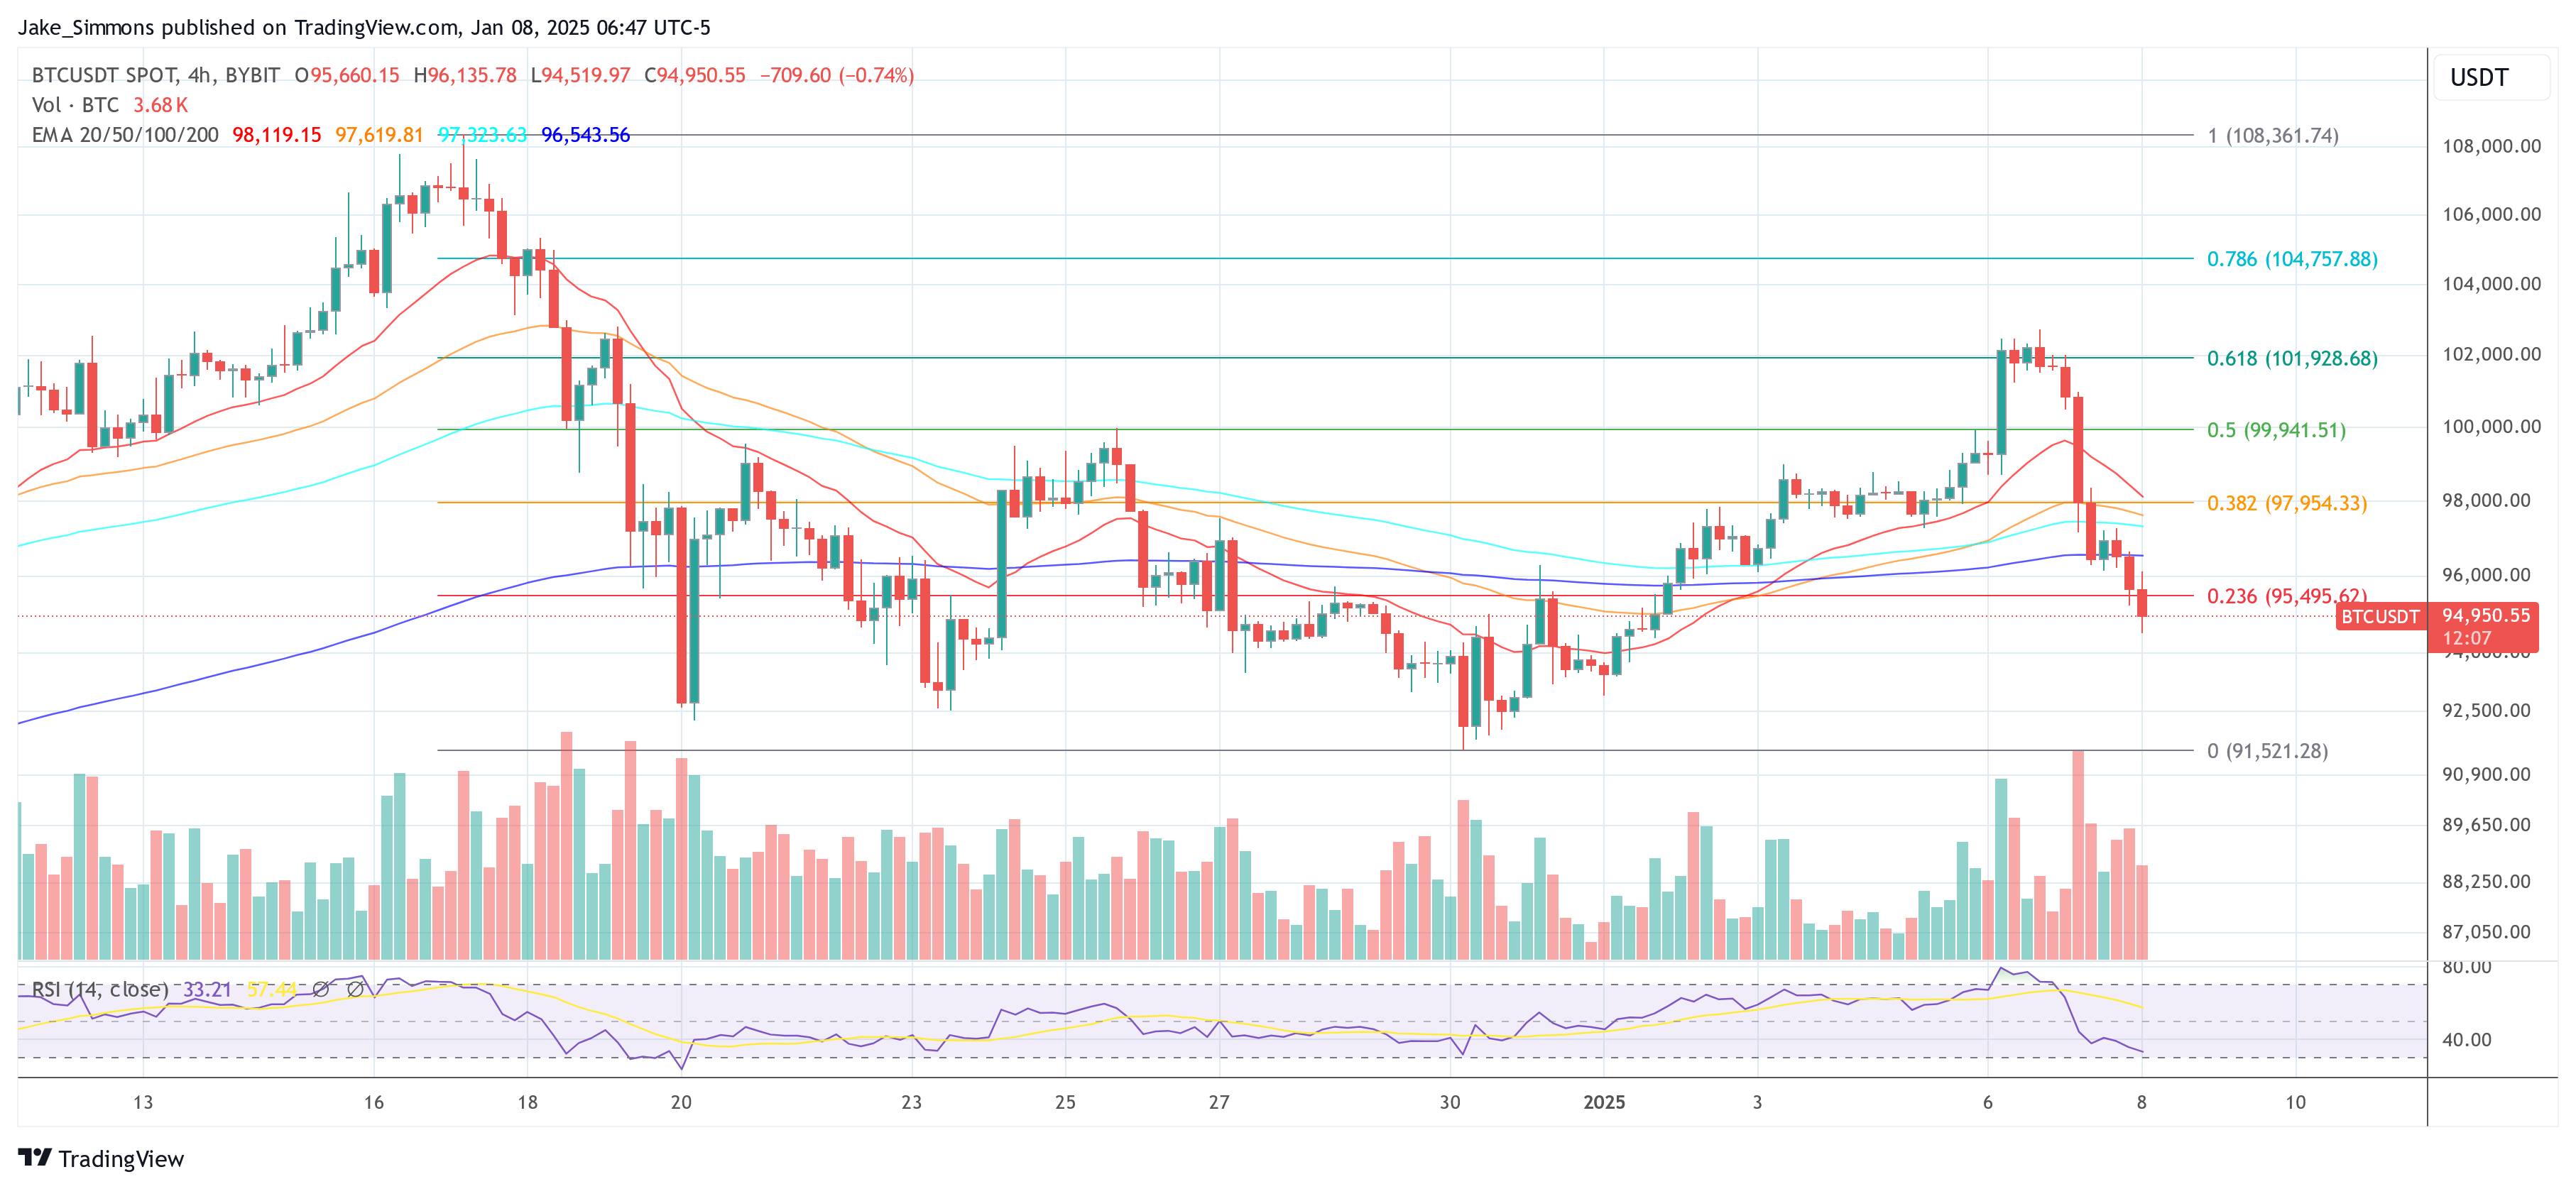
If BTC follows a similar pattern and climbs 30% from its current price, it could reach approximately $104,000 in a short period. However, broader macroeconomic factors – such as US President Donald Trump’s trade tariffs and the Federal Reserve’s (Fed) monetary policy – could significantly impact BTC’s trajectory.

BTC Needs To Reclaim $84,000 First

In another post on X, Martinez outlined BTC’s potential path to a new ATH, emphasizing that BTC must first reclaim $84,000 as a support level before any major upside movement. Once this milestone is secured, the digital asset could rally toward $128,000.

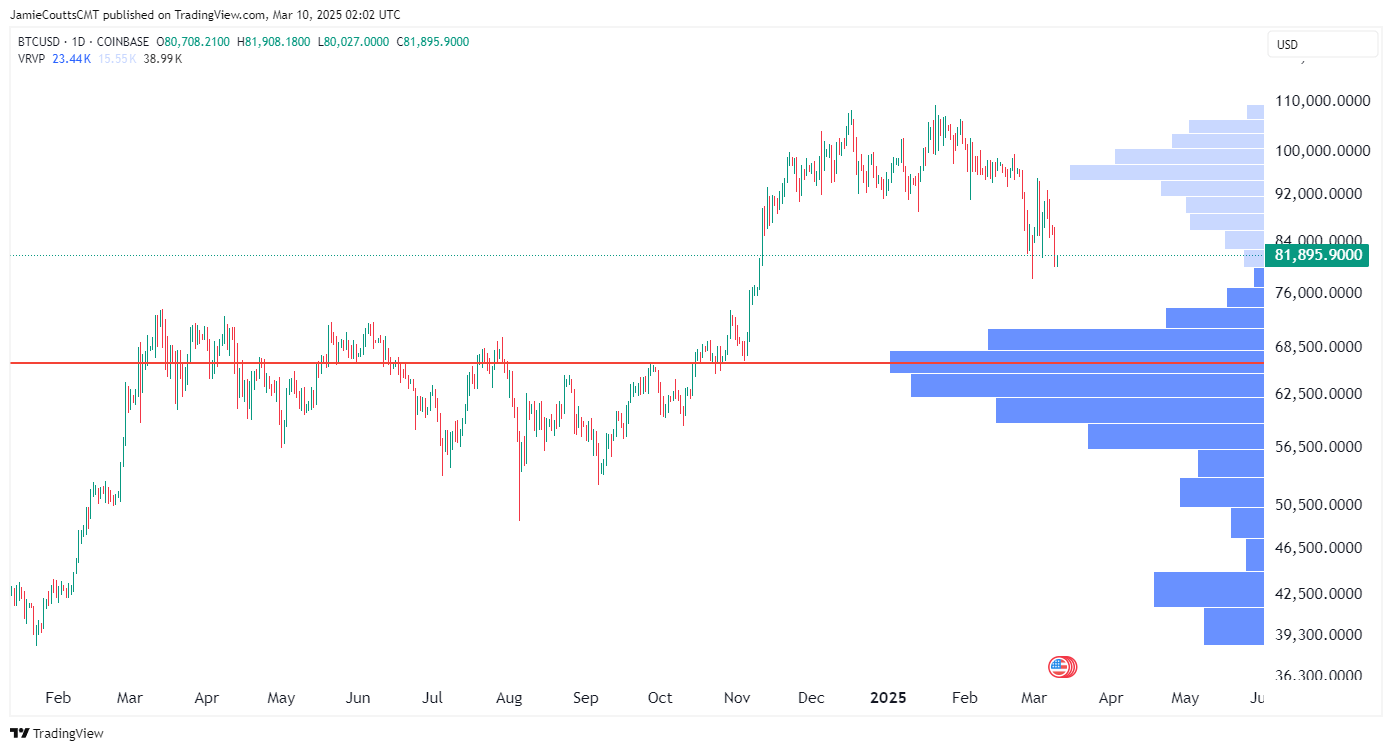
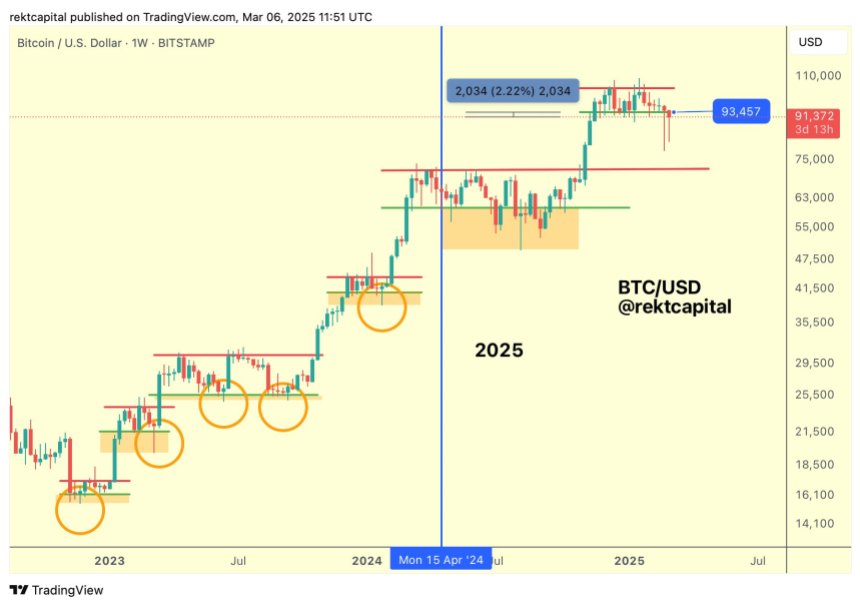
Several indicators suggest that BTC may have already found a local bottom, increasing the chances of a trend reversal. Crypto analyst Rekt Capital recently noted that BTC’s plunge to $78,258 could mark the cycle low.

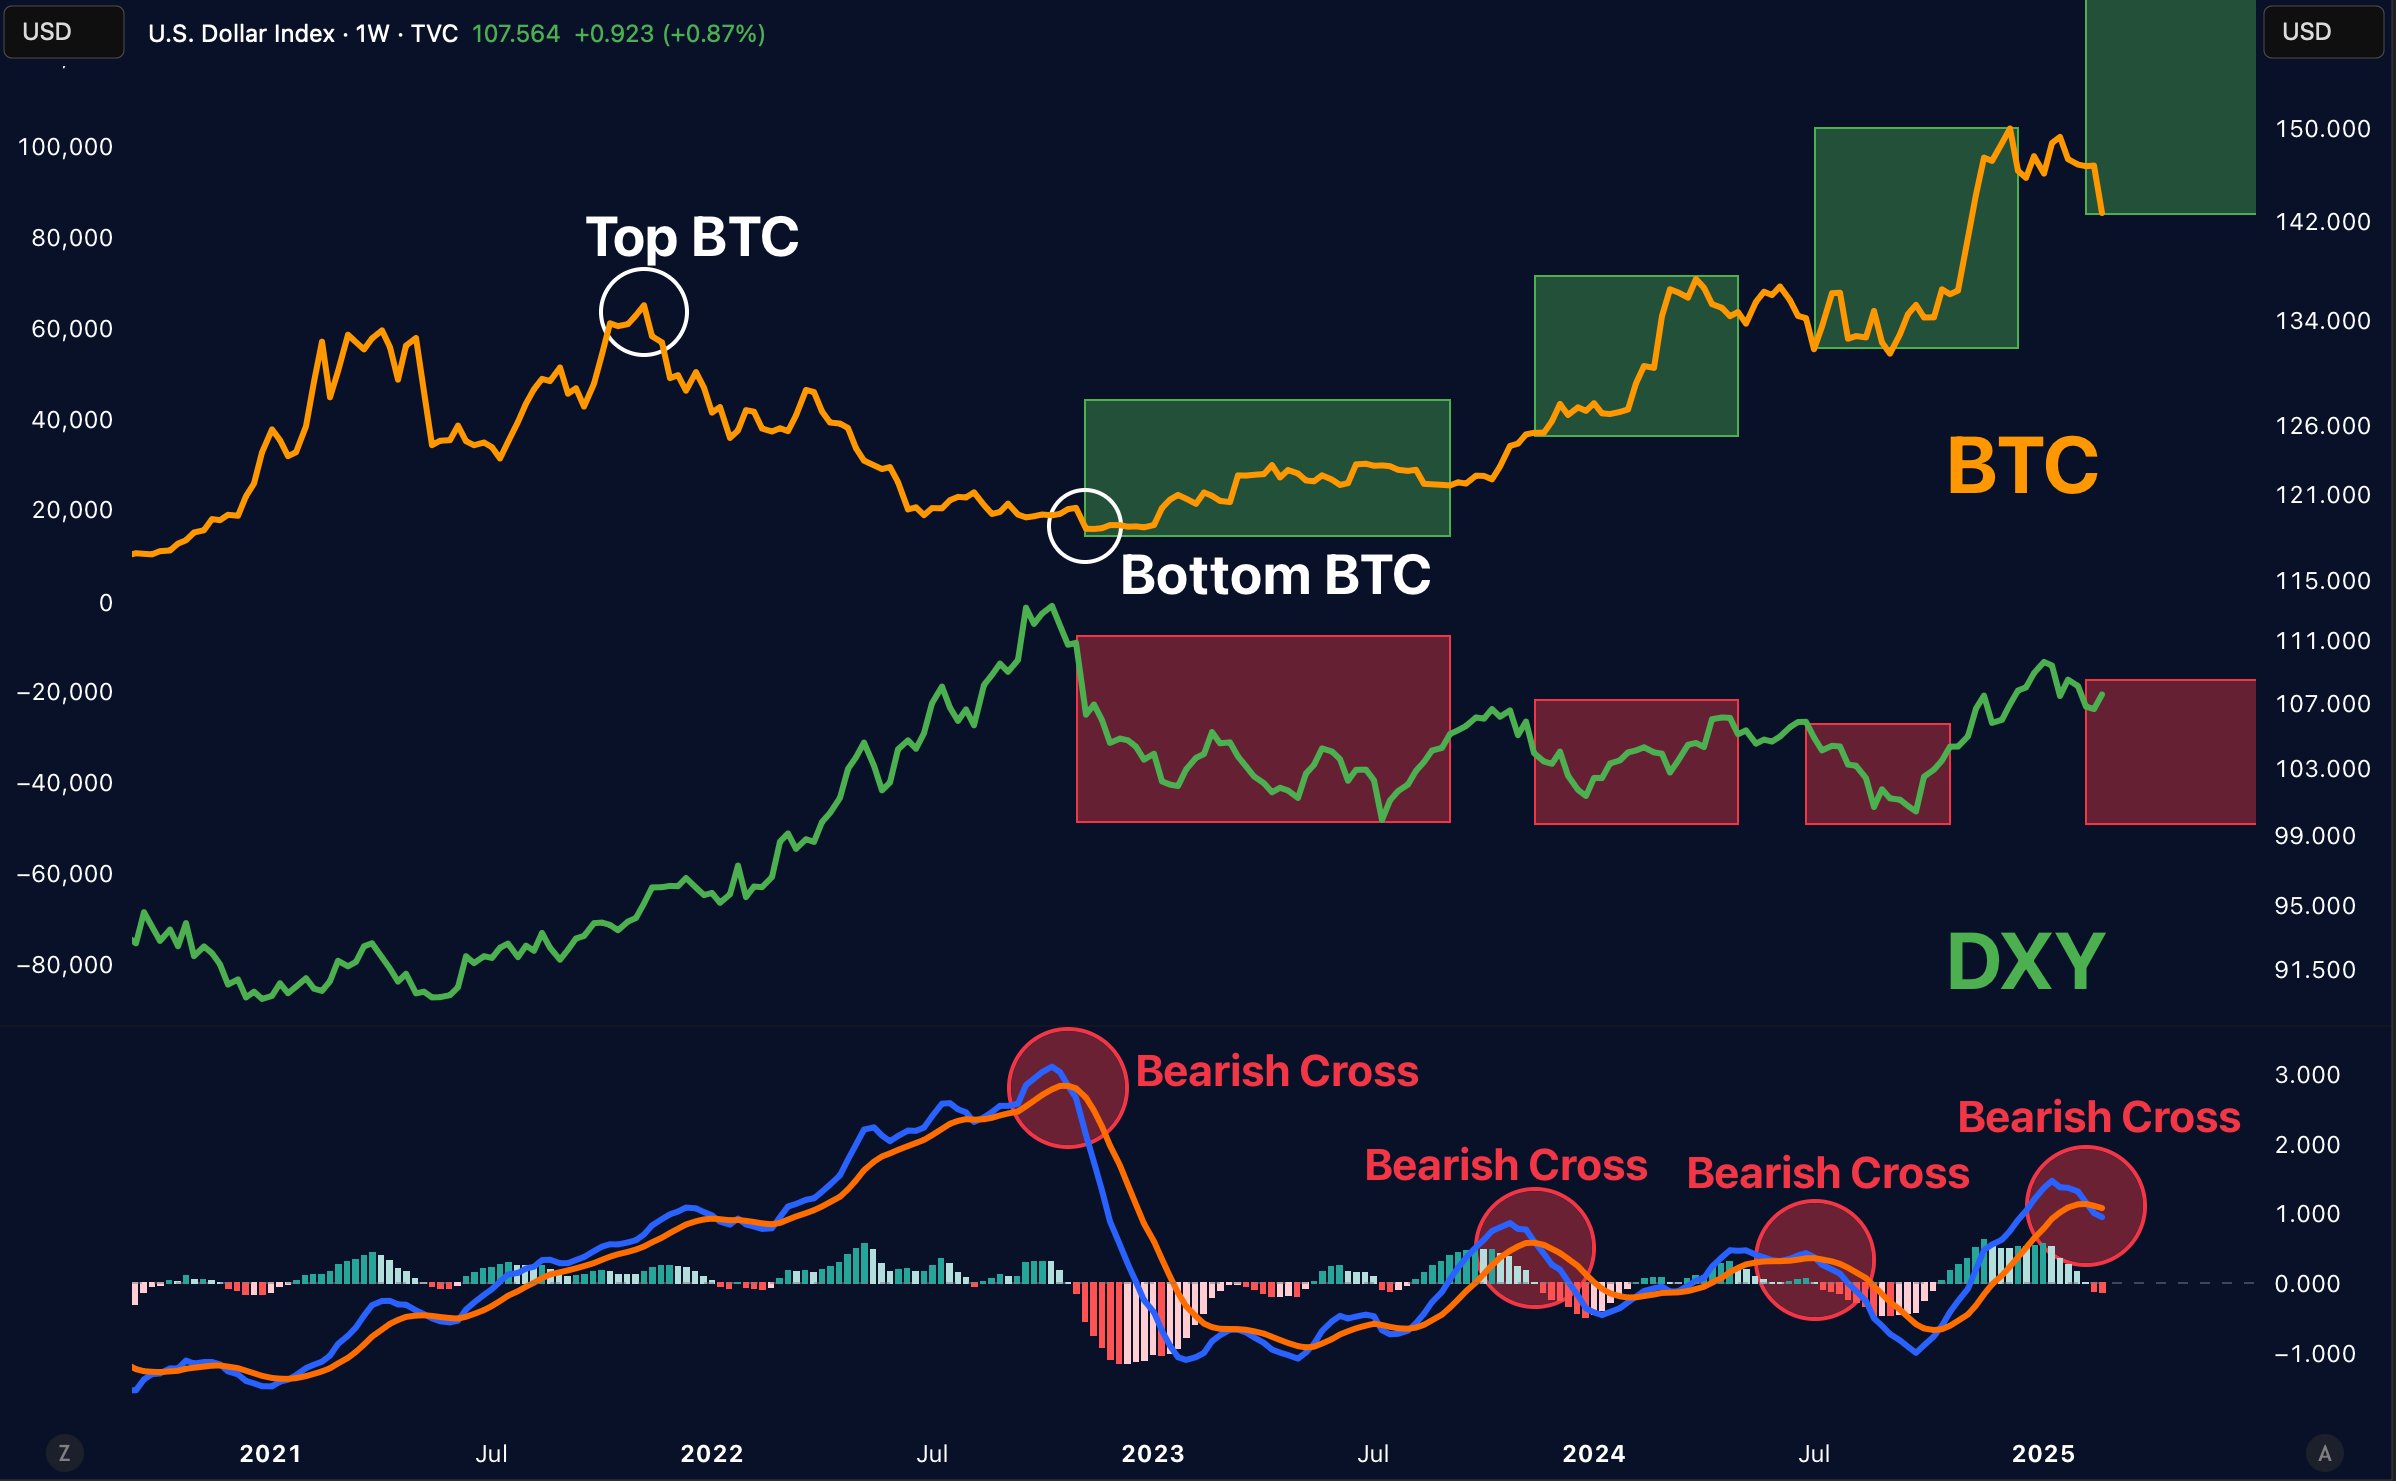
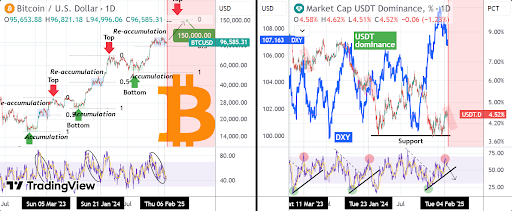
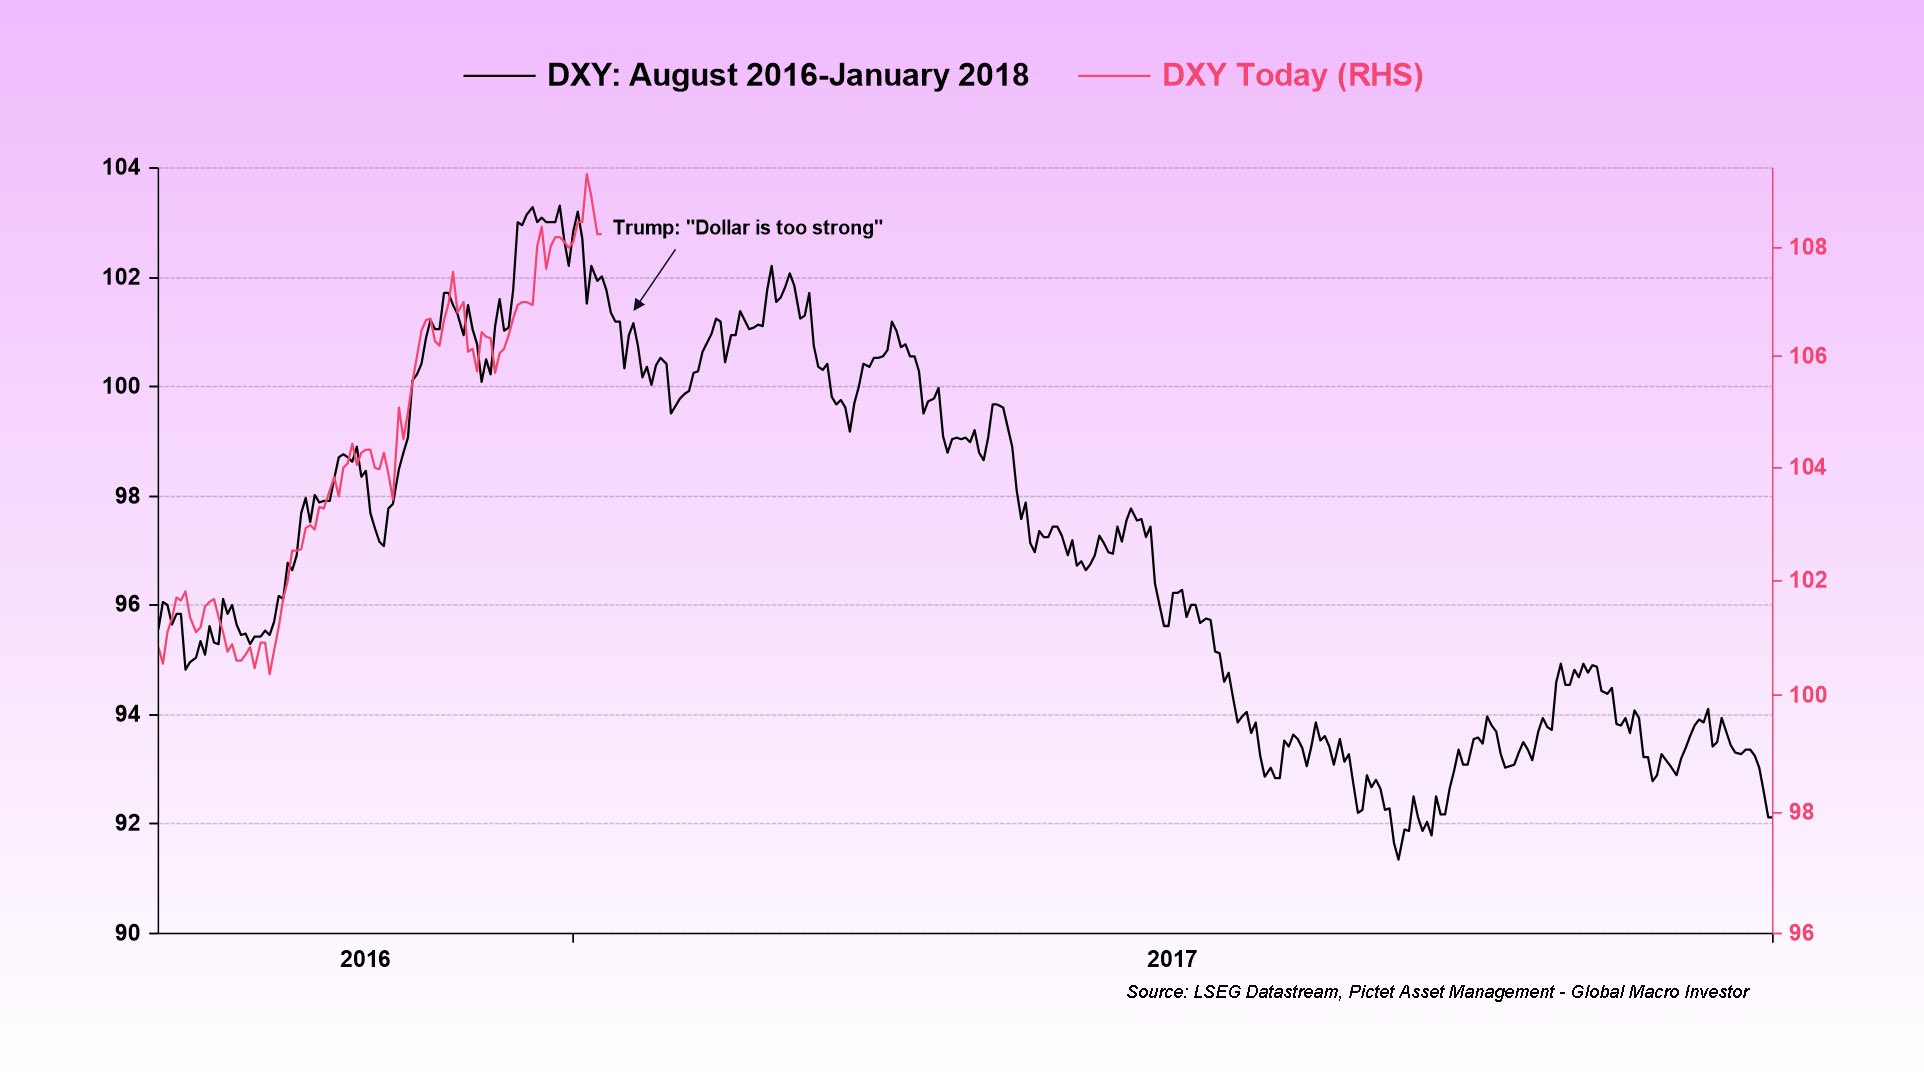
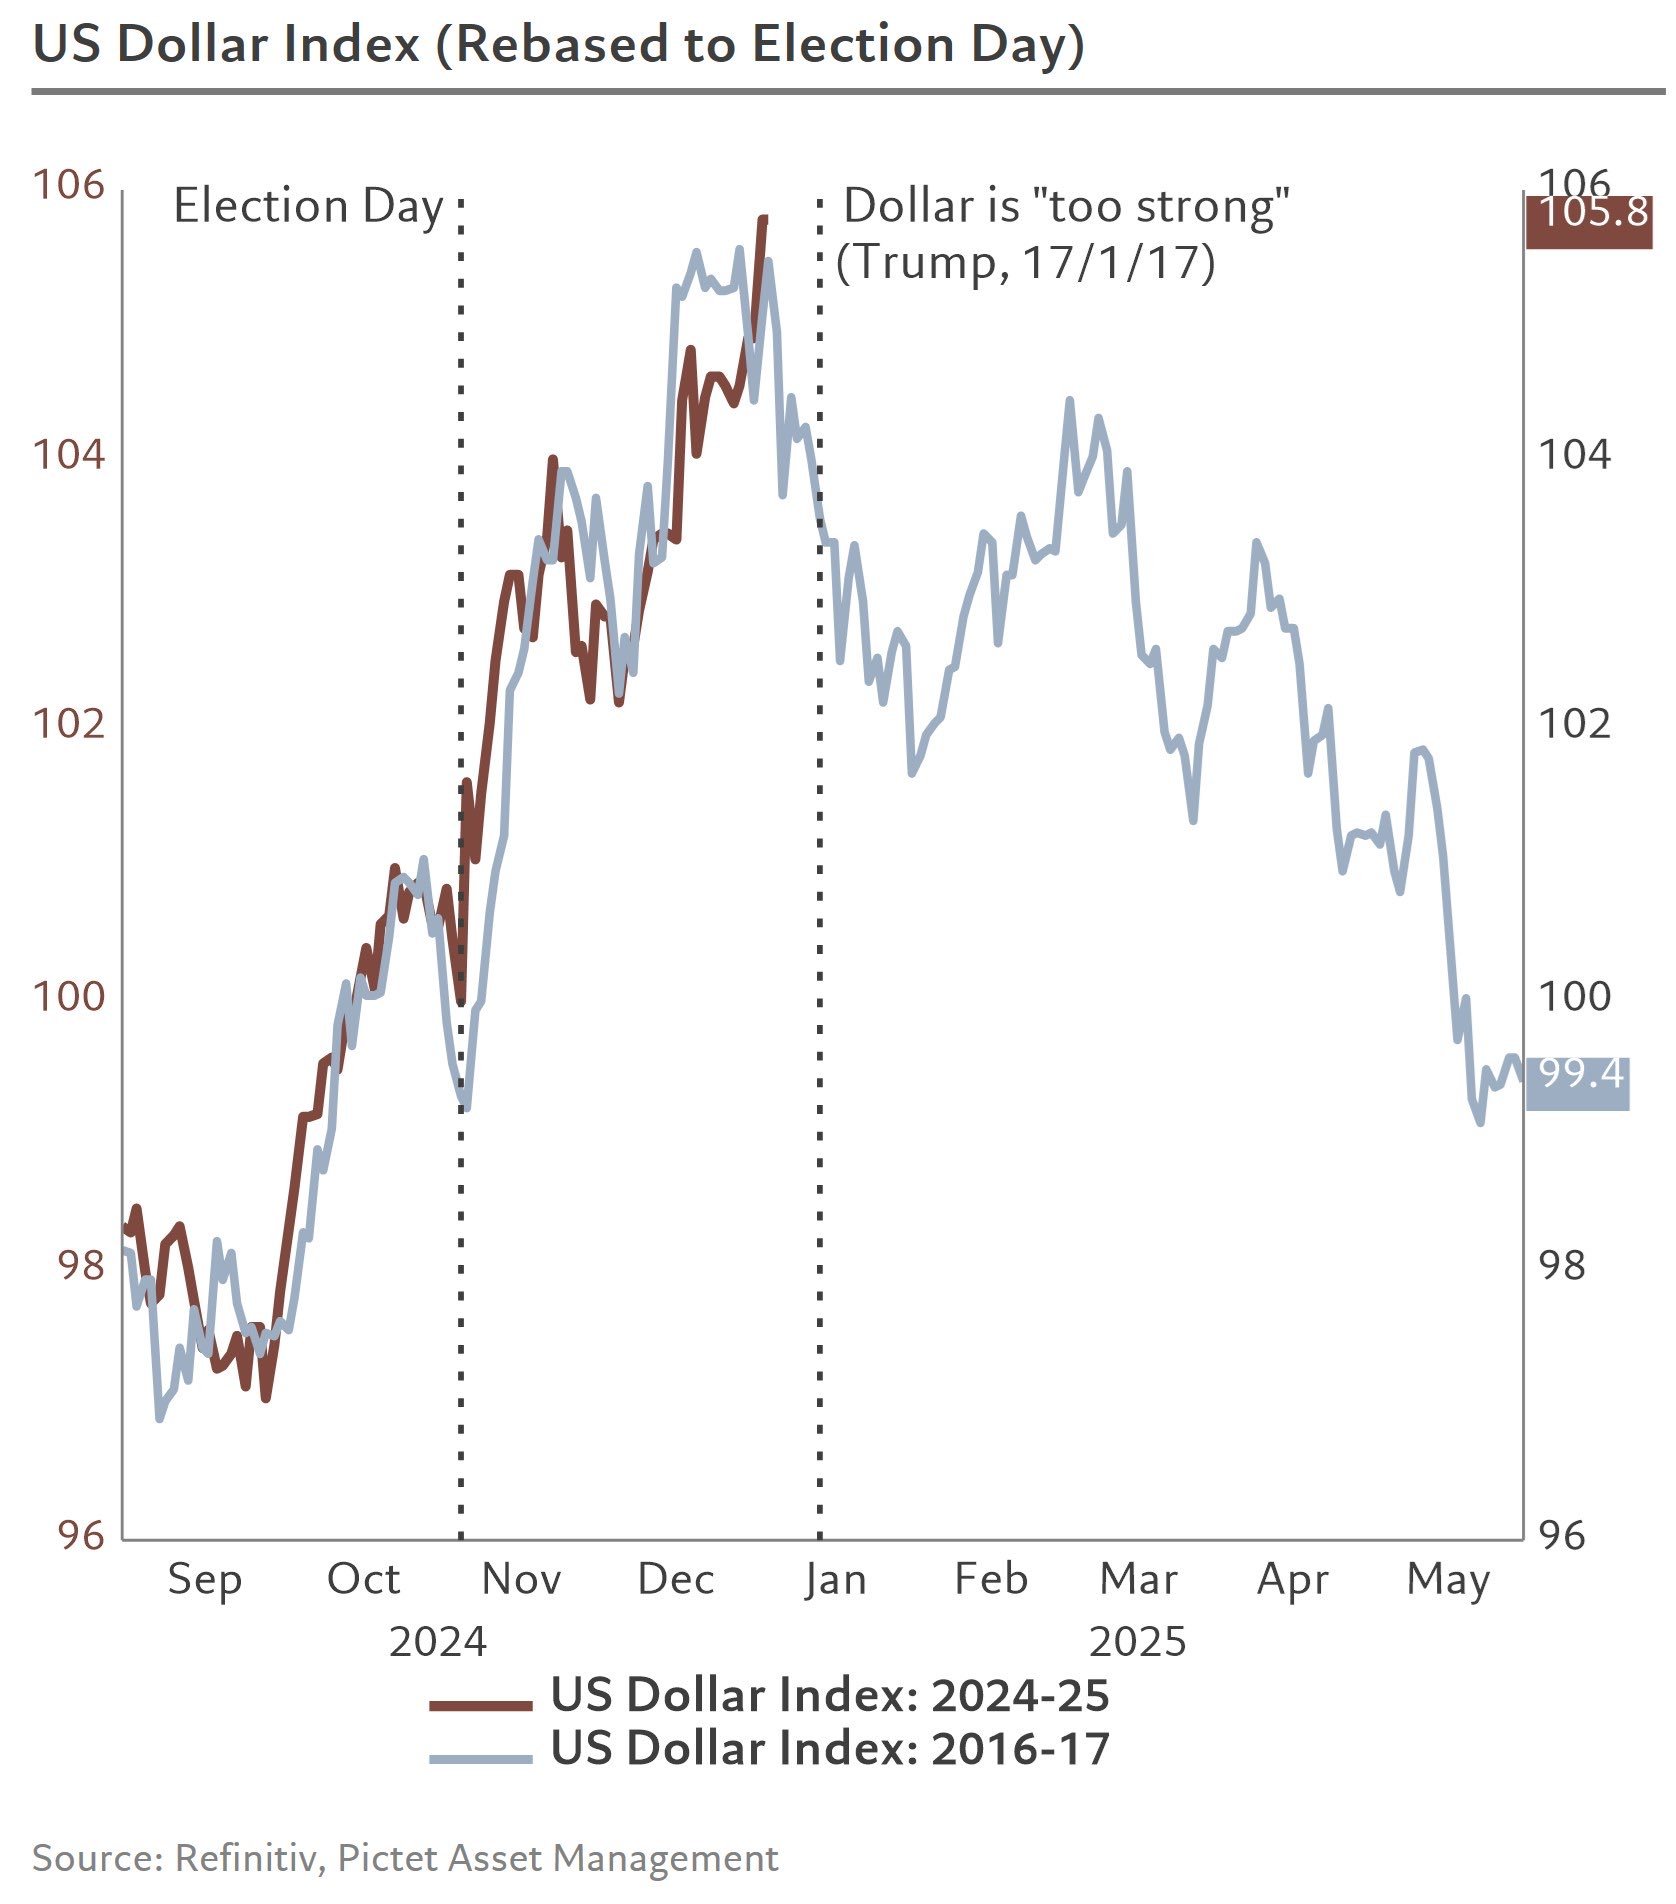
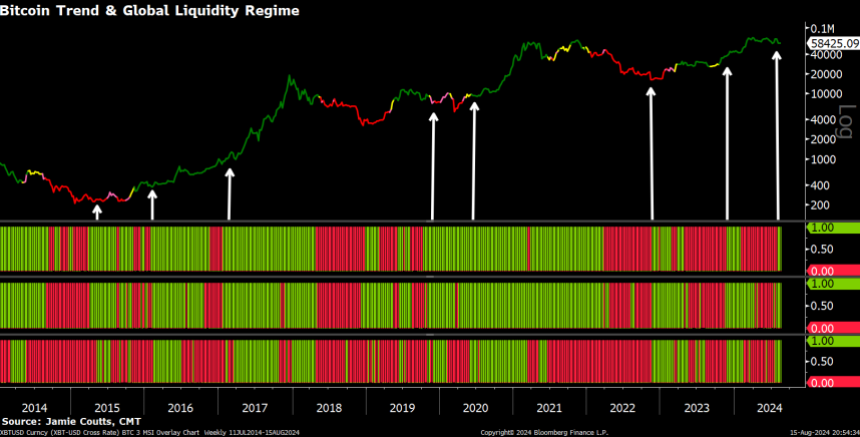
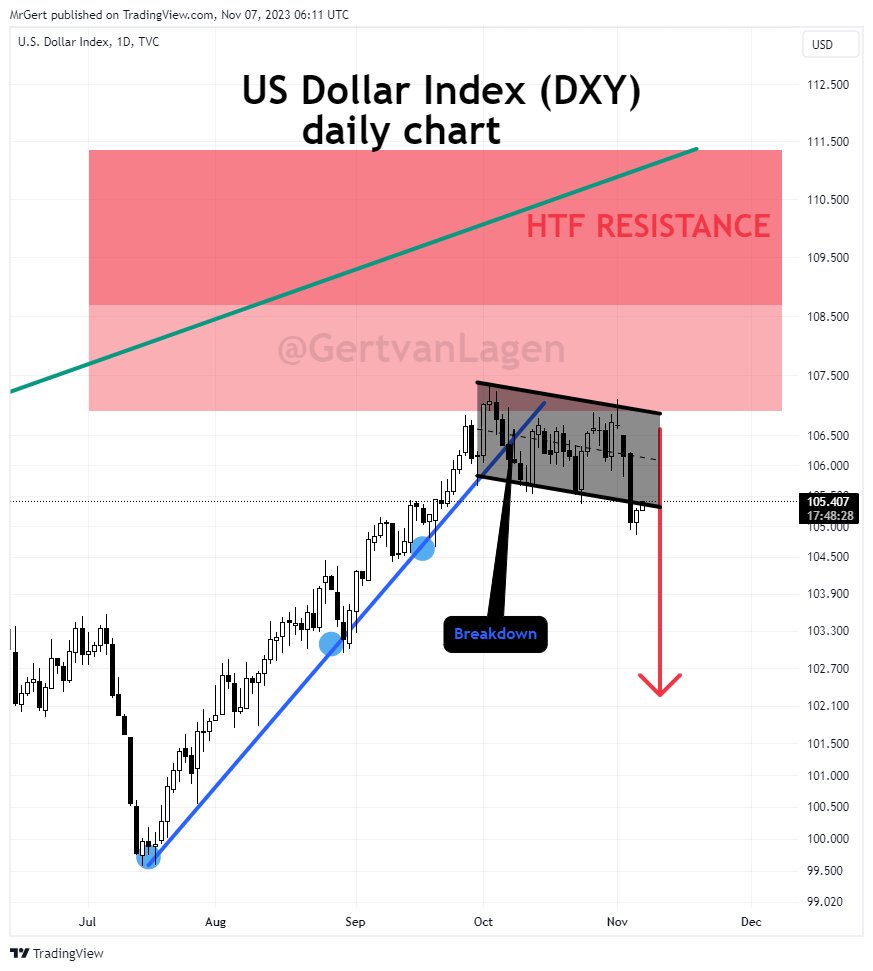
Additionally, the US Dollar Index (DXY) has just recorded one of its largest weekly breakdowns since 2013, a move that historically signals bullish momentum for risk-on assets like BTC. At press time, BTC trades at $80,137, down 3.5% in the past 24 hours.

bitcoin

Bitcoin Plays Chicken With Central Banks As Dollar Falls, Says Expert

Bitcoin’s price endured another bout of volatility over the weekend, shedding 5% on Sunday to dip below the $80,000 mark, before settling near $82,000. This latest decline places the cryptocurrency roughly 25% below its all-time high of $109,900. Analysts attribute the downturn to ongoing trade tensions—linked to President Donald Trump’s latest tariff measures—and the fears of a looming recession.

Meanwhile, a weakening US Dollar Index (DXY), which has fallen from 110 to 103 since mid-January, coinciding with Trump’s second term in office and could be a potential bullish catalyst for the Bitcoin price. In a series of posts on X, Jamie Coutts, Chief Crypto Analyst at Realvision, offers a look at the current market environment, highlighting two key metrics that could shape central bank policy—and, by extension, Bitcoin’s trajectory. “Bitcoin is like playing a game of Chicken with central banks,” Coutts writes.

He explained that while the dollar’s recent decline supports a bullish framework for Bitcoin, rising Treasury bond volatility (tracked by the MOVE Index) and widening corporate bond spreads are causing concern: Coutts emphasized the role of US Treasuries as the global collateral asset. Any spike in their volatility, he argued, forces lenders to impose larger haircuts on collateral, tightening liquidity. “Rising volatility forces lenders to apply haircuts on collateral, thereby tightening liquidity. […] Above 110 [on the MOVE Index] and I suspect there will be a few concerns at the central planner levels.”

Bitcoin vs. macro and liquidity

Over the past three weeks, US investment-grade corporate bond spreads have been widening, a shift Coutts views as a signal that risk assets—including Bitcoin—could face pressure: “This suggests that the demand keeping yields compressed relative to Treasuries is fading—and further widening could be negative for risk assets.”

Despite these cautionary flags, Coutts remains optimistic about Bitcoin’s medium-term prospects, primarily due to the dollar’s “rapid decline.” He noted that the dollar’s drop in March—one of the most significant monthly dips in 12 years—historically has coincided with bullish inflection points in Bitcoin’s price. According to his research, “They have all occurred at Bitcoin bear market troughs (inflection points) or mid-cycle bull markets (trend continuations).”

While acknowledging the limited historical dataset for Bitcoin, Coutts also cited key catalysts he believes could propel the digital asset higher:

  • Nation-State Adoption: “A global nation-state race is underway,” Coutts wrote, describing a scenario in which countries either include Bitcoin in their strategic reserves or ramp up mining efforts.
  • Corporate Accumulation: He points to the possibility of companies—particularly Strategy (MSTR)—adding 100,000 to 200,000 BTC this year.
  • ETF Positions: Exchange-traded funds may “double their positions,” further driving institutional inflows.
  • Liquidity Dynamics: In Coutts’s words, “The Spice Must Flow.”

Coutts also mentioned that Bitcoin appears to be “filling a big gap” and reiterated his view that a slide below the high-$70,000 range would signal a fundamental market shift. Meanwhile, he sees central bankers edging closer to possible intervention as Treasury volatility and credit spreads climb: “If Treasury volatility and bond spreads keep rising, asset prices will continue their decline. Meanwhile, this will likely push the central planners to act.”

Bitcoin's liquidity gap

In closing, Coutts offered a concise summary of why he believes Bitcoin is effectively locked in a showdown with central banks: “Think of Bitcoin as a high-stakes game of chicken with the central planners. With their options dwindling—and assuming HODLers remain unleveraged—the odds are increasingly in the Bitcoin owner’s favor.”

For now, the world’s largest cryptocurrency appears to be treading a line between macroeconomic headwinds—highlighted by a volatile bond market—and the tailwinds of a weakening dollar. Whether Bitcoin continues to retreat or resumes its long-term ascent will likely depend on how global policymakers respond to mounting bond market pressures—and whether holders are prepared to keep playing “chicken” with the central planners.

At press time, BTC traded at $82,091.

Bitcoin price

Bitcoin Uptrend Soon? Dollar Index Breakdown Sparks Optimism Among BTC Bulls

The US dollar index (DXY) is experiencing one of its largest weekly declines since 2013, fuelling optimism for a potential rally among risk-on assets, including Bitcoin (BTC). The last time the DXY saw such a sharp pullback was during the height of the FTX fiasco in November 2022, which coincided with a Bitcoin bottom.

Will Bitcoin See An Uptrend?

BTC is down nearly 10% over the past two weeks, largely due to the hawkish stance of the US Federal Reserve (Fed) and concerns over trade tariffs from the US against Canada, Mexico, and China.

Since March 3, the DXY has slid more than 3%, tumbling from 107 to 103 at the time of writing. This decline has sparked hope among cryptocurrency investors for a potential rally. Historical data supports this outlook.

In addition to the $15,000 BTC bottom formed in November 2022, the DXY has experienced similar sharp declines on two other occasions – during the COVID crash in March 2020 and back in the 2015 bear market when the premier cryptocurrency traded at $250.

On all three occasions when the DXY dropped more than -4 standard deviations, BTC formed a bottom followed by a trend reversal that saw the digital asset resume its bullish momentum. Crypto analyst Merlijn The Trader shared their thoughts on the DXY-BTC relationship.

In an X post, the analyst noted that whenever the DXY Moving Average Convergence Divergence (MACD) has turned bearish, BTC has rallied. The analyst illustrated this with the following chart.

merlijn

Fellow crypto analyst Rekt Capital had a similar perspective. The analyst emphasized that BTC has likely formed a higher low after another downside deviation, which saw the cryptocurrency hit a low of $78,258 on February 28.

rekt

Important To Clear The $90,000 Resistance

Another crypto trader, Daan Crypto Trader, hinted that BTC may target new all-time highs (ATH) around $120,000 if it continues to consolidate near range lows. The trader explained:

We’ve seen this during every consolidation this cycle where it breaks lower, fails to see continuation, retakes the range and moves higher from there. Let’s see how this one turns out. That ~$90K level remains key.

Recent analysis from CryptoQuant supports the view that BTC may have already formed a bottom. Additionally, seasoned crypto analyst Ali Martinez recently highlighted that BTC has hit oversold levels not seen since August 2024, likely signalling a trend reversal in the short-term.

That said, BTC is also facing a bearish deviation as it fills a new Chicago Mercantile Exchange (CME) gap, which may dampen hopes for a swift price recovery. At press time, BTC is trading at $86,870, down 3.3% in the past 24 hours.

bitcoin

Historic Bitcoin Buy Signal: DXY’s Collapse Signals A Bigger Bull Run

This week, the US Dollar Index (DXY) has recorded one of its largest three-day negative performances in recent history. Since Monday, the DXY is down -5.4%, falling from 109.881 to 103.967—an event some market observers interpret as a bullish inflection point for Bitcoin. Jamie Coutts, Chief Crypto Analyst at Real Vision, has drawn on historical comparisons to argue that the steep DXY decline could portend a significant upswing in the world’s largest cryptocurrency by market capitalization.

DXY’s Historic Drop Signals A Major Bitcoin Rally

Coutts presented the findings of two historical backtests on X, detailing how similar DXY drops have coincided with pivotal moments in Bitcoin’s price cycles. He wrote: “When looking at this recent move in the DXY through a historical lens, it’s challenging to be anything but bullish. I ran a signal screen for 3-day negative moves of more than -2% & -2.5% and found they have all occurred at Bitcoin bear market troughs (inflection points) or mid-cycle bull markets (trend continuations).” Although the statistical significance is limited by Bitcoin’s relatively short trading history, Coutts underscored that these data points are nonetheless worth considering.

In his first backtest covering DXY declines of more than -2.5%, Coutts found such a scenario on eight occasions since 2013. Over a 90-day period following those declines, Bitcoin rose every single time, giving it a perfect 100% win rate. The average return was +37%, which would translate to an estimated BTC price of around $123,000, while a move of one standard deviation above that average reached +63% (approximately $146,000 BTC). Even in the worst instance, Bitcoin still managed to gain 14%, putting it around $102,000 BTC.

In his second backtest focusing on DXY declines of more than -2.0%, there were 18 such occurrences since 2013, and Bitcoin was up 17 out of those 18 times for a 94% win rate. The average 90-day return stood at +31.6%, close to $118,000 BTC, while a one standard deviation move was +57.8% (around $141,000 BTC). The worst 90-day return after such a DXY drop was -14.6% (approximately $76,500 BTC).

Acknowledging that these backtests cannot offer guarantees, Coutts stated, “I made a bold call yesterday about new highs by May. I try to base projections on robust data points. Ofc this time might be different. Let’s see.”

Analysts often view a declining DXY as a sign of improving risk appetite in global markets, which can favor alternative stores of value and risk assets, including Bitcoin and other cryptocurrencies. The US Dollar Index’s abrupt retreat comes on the heels of regulatory concerns and a challenging February for Bitcoin, yet Coutts maintains that the larger trend looks remarkably similar to historical points of resurgence.

He also noted in a post from the previous day: “Don’t think people understand the significance of the DXY move in the past 3 days and what it means for Bitcoin. […] The DXY saw its 4th largest negative 3-day move—massively liquidity-positive. Just as Bitcoin nuked and had its worst Feb in a decade. Meanwhile, in altcoin land, the Top 200 crypto index puked one more time. The chart shows that 365 days of New Lows hit 47%, a hallmark of capitulation in a bull cycle. The stage is set for a new all-time high in Bitcoin and Top 200 aggregate market cap by May.”

At press time, BTC traded at $88,404.

Bitcoin price

Bitcoin Price To $150,000: Why The USDT Dominance Plays An Important Role

Bitcoin has extended its consolidation below $100,000 since the beginning of February. This price lag has been compounded by a slowdown in bullish sentiment among investors and a slowing euphoria regarding the crypto-positive influences of Trump’s new administration in the US. 

Despite this rally slowdown, technical analysis continues to support a bullish long-term outlook for Bitcoin. The current stagnation appears to be a re-accumulation phase for bullish investors; a pattern observed multiple times before major upward moves this cycle. Furthermore, analysis shows that the USDT dominance is going to play a crucial role in triggering the next Bitcoin rally toward $150,000.

Bitcoin’s Re-Accumulation Phase And The Role Of USDT Dominance

According to a technical analyst (TradingShot) on the TradingView platform, Bitcoin is currently exhibiting an interesting accumulation trend alongside the USDT dominance. The USDT dominance reflects the percentage of the total crypto market capitalization in USDT, indicating whether traders favor stablecoins over riskier crypto assets. A high USDT dominance typically signals low buying pressure in cryptocurrencies. Conversely, a declining USDT dominance often suggests that traders are rotating funds back into Bitcoin and other cryptocurrencies.

Interestingly, the USDT dominance has had a crucial simultaneous occurrence with Bitcoin’s preparations for rallies this cycle. Two notable re-accumulation periods have occurred after Bitcoin bottomed in November 2022, with each leading to significant price rallies. The first accumulation period spanned from January 2023 to March 2023, while the second occurred between November 2023 and February 2024. Both of these re-accumulation phases took place at the 0.5 Fibonacci extension level from an earlier accumulation phase. Additionally, these phases shared common characteristics, including a peaking 1-day RSI structure in the USDT dominance chart and a pullback in the Dollar Index (DXY).

Bitcoin

Now, Bitcoin appears to be mirroring the same conditions again, with USDT dominance and the DXY pulling back with the current re-accumulation phase, which has been playing out since December 2024. If the pattern continues to unfold as expected, this could indicate that Bitcoin is on the verge of its next major rally.

USDT To Send BTC To $150,000

If Bitcoin follows the pattern observed in previous rallies this cycle with the USDT dominance to the core, the re-accumulation phase could end within the next one or two weeks and eventually cause another rally to new all-time highs.

In terms of a target, the analyst noted a potential $150,000 target for the Bitcoin price, at least before another major correction and a subsequent accumulation phase. However, Bitcoin must overcome key resistance levels, particularly the psychological $100,000 mark, which has served as a major hurdle in recent weeks. 

At the time of writing, Bitcoin is trading at $97,175, up by 1.6% in the past 24 hours. A move to $150,000 will represent a 54% increase from the current price.

Bitcoin

Bitcoin To Blast Off? Trump’s Fury Over Interest Rates Signals Big Move

Bitcoin experts are buzzing as President-elect Donald Trump lashed out against current Federal Reserve policy, calling interest rates “far too high” despite persistent inflationary pressures. “We are inheriting a difficult situation from the outgoing administration,” Trump said at his Mar-a-Lago club, adding that officials seem to be “trying everything they can to make it more difficult” for his incoming team.

The blunt remarks, coming fewer than two weeks before Trump’s inauguration, have stoked anticipation of a possible shift in US monetary policy—and raised speculation about a boost for Bitcoin and other risk assets in the new year.

The 2017 Trump Playbook: Dollar “Too Strong”, Bitcoin Up?

Although the economic and geopolitical landscape has changed since Trump’s first term, some market watchers see parallels to his 2017 rhetoric. Back then, he lambasted a US dollar that he deemed “too strong,” a stance that preceded a notable decline in the currency. The US Dollar Index (DXY) peaked near 104 in early January 2017 but began a downward trend that extended into early 2018, bottoming out around 98.

This sharp move in the dollar coincided with a broader risk-on environment, fueling rallies in equities as well as the Bitcoin and crypto markets. Julien Bittel, Head of Macro Research at Global Macro Investor (GMI), drew a direct comparison on X.

“The last time Trump said something was ‘too high,’ it was the dollar – back in January 2017, just days before his inauguration,” Bittel stated and recounted: “Here’s what he said: ‘Our companies can’t compete with them now because our currency is too strong. And it’s killing us.”

Notably, last year, Trump also called recent strength a “tremendous burden on US businesses.” Bittel further argued: “Trump understands the impact of a strong dollar – and the same logic applies to high interest rates. They suppress exports, hurt corporate earnings, and slow economic growth.”

Speaking on the impact on Bitcoin and the broader crypto market, Bittel concluded: “What happened next? Well, the dollar began a significant decline, setting the stage for one of the most pivotal macro moves we’ve seen in years – triggering a melt-up in risk assets. Déjà vu? I think so. Let’s see how it plays out.”

DXY Déjà vu?

Bittel is not the only expert speculating that the DXY may already have peaked, mirroring its 2017 topping pattern. Steve Donzé, Deputy CIO for Multi Asset at Pictet Asset Management Japan, shared a widely discussed chart on X, remarking “On time. Ready for pushback,” while overlaying recent DXY movements with the currency’s trajectory in early 2017. The chart suggests a similar pattern that could foreshadow renewed dollar weakness in the coming weeks.

DXY 2017 vs today

In a separate post, financial analyst Silver Surfer (@SilverSurfer_23) pointed to an uncanny timing overlap: “DXY topped on January 3rd, 2017—18 days before Trump’s Inauguration. DXY looks to have topped on January 2nd, 2025—19 days before Trump’s Inauguration.” He characterized the parallel as “crazy history repeating,” explaining that he sees a correlation between the path of the DXY before both inaugurations.

Such analogies are fueling speculation that a repeat dollar slump could usher in an environment favoring risk assets. Should the dollar indeed enter a new downtrend—much like in 2017–2018—Bitcoin could ride a wave of renewed liquidity and speculative appetite.

At press time, BTC traded at $94,950.

Bitcoin price

Bitcoin Price Could Surge 200% To Cross $100,000 If This Happens

A crypto analyst has predicted that Bitcoin (BTC), the world’s largest cryptocurrency could see its price surging as high as $100,000, representing a 200% increase from its current value. However, the analyst noted that this bullish projection would occur only when certain conditions are met. 

Bitcoin Could Rise To $100,000

In an X (formerly Twitter) post on August 15, Jamie Coutts, the Chief crypto analyst at Real Vision shared his bullish expectations for Bitcoin in 2024. The analyst predicts that Bitcoin could experience a 200% surge, potentially reaching $100,000 before the end of the year.

Coutts argues that Bitcoin could see significant gains in the near future based on global financial conditions, specifically the actions of Central Banks. The crypto analyst noted that central banks are “capitulating,” and the “liquidity spigots are opening,” signaling that Bitcoin’s price is about to go much higher. 

Capitulating here means that Central Banks are easing monetary policies, most likely due to economic pressures. Additionally, opening the liquidity spigots suggests that Central Banks are increasing the money supply through various measures.

Coutts revealed in his post that the Global Liquidity Momentum Model (MSI) has provided a bullish regime signal for the first time since November 2023. He recalled that after witnessing this signal in 2023, Bitcoin rallied as high as 75% from November 2023 to April 2024, before the regime flipped bearish.

Bitcoin

The analyst also revealed that over the past month, The Bank of Japan (BoJ) and the People’s Bank of China (PBoC) have injected substantial capital into the system, amounting to $400 billion and $97 billion, respectively. Globally, the money base (credit) has also expanded by $1.2 trillion, facilitated by the weakening United States Dollar (USD). This decrease also indicates a possible coordination with the US Federal Reserve (FED).

Drawing comparisons from previous cycles where Bitcoin rose 19X in 2017 and 6X in 2024, Coutts projects that Bitcoin could witness a 2X to 3X surge in 2024 if the US Dollar Index (DXY) drops below 101. According to TradingView, the US Dollar Index is currently 102.175. A decrease below 101 would likely be a result of continued Central Bank injections that could potentially increase the global money supply (M2) above $120 trillion this cycle. 

Coutts concluded his Bitcoin bull forecast by noting that in a credit-based fractional reserve banking system, the money supply must continually flow and expand to support the outstanding debt. If it does not, the entire financial system could collapse. 

Massive BTC Rally Incoming

In a more recent X post, a crypto analyst identified as ‘Milkybull Crypto,” shared his highly optimistic projections for Bitcoin. Sharing a price chart depicting Bitcoin’s movement from 2016 to 2025, the analyst forecasted that Bitcoin is preparing for a “face-melting parabolic that could potentially see its price surging as high as $190,000.

The analyst predicts that this massive surge could occur in the fourth quarter (Q4) of 2024. He suggests that this potential rally is consistent with historical market patterns, highlighting that “history has indeed prevailed. 

At the time of writing, the price of Bitcoin is trading at $58,548, marking a slight decrease of 1.71% in the last 24 hours, according to CoinMarketCap.

Bitcoin

Altcoin Season Incoming: Analyst Forecasts Further Bitcoin Correction, Signals Alts Market Upswing

Jason Pizzino, a seasoned macro investor and swing trader, has recently put forward his analysis indicating a potential pullback for Bitcoin.

His observations, informed by a deep understanding of market dynamics, suggest that Bitcoin’s prolonged rally could soon give way to further correction.

Altcoins Set To Shine As Bitcoin Undergoes Correction

Pizzino’s analysis is grounded in a comprehensive review of various market indicators. The analyst has been closely monitoring the altcoin sector, noting an accumulation of upside potential which could lead to impactful market movements, especially with the upcoming Bitcoin halving in view.

This anticipation of a shift in market sentiment is further supported by his examination of the US Dollar Index Futures chart, which shows a downward trend and recent significant drops in a single trading day.

US dollar Index (DXY) price chart on TradingView

Pizzino interprets these movements as indicators of further downside, influenced by the general macroeconomic conditions.

While Bitcoin braces for potential setbacks, Pizzino’s analysis reveals a silver lining for the broader cryptocurrency market, particularly altcoins. His study of the Total3 chart, excluding Bitcoin and Ethereum, shows a latent potential for growth in the altcoin sector.

This observation aligns with the cyclic nature of the crypto market, characterized by alternating periods of fear and greed. According to Pizzino, the market is currently experiencing one of its lengthiest stretch of positive sentiment, a trend he expects to shift in alignment with historical market behaviors.

Bitcoin’s Strong Support Zone And Emerging Altcoin Focus

In parallel, another prominent crypto analyst, Ali Charts, has identified a critical support zone for Bitcoin. Between $37,150 and $38,360, a substantial number of Bitcoin transactions have occurred, with roughly 1.52 million addresses purchasing around 534,000 BTC.

This significant level of accumulation has established a strong foundation, potentially curtailing any further decline in Bitcoin’s value below that level.

Despite the correction, Bitcoin has shown resilience in its recovery from recent dips. Although the asset is still down by 2.7% over the past week and nearly 1% in the past 24 hours, it has managed to surpass the $42,000 mark after previously falling below $41,000 on Tuesday.

Bitcoin (BTC) price chart on TradingView

However, a noticeable decline in Bitcoin’s daily trading volume, from $30 billion earlier this week to $13.6 billion, hints at a shift in investor focus towards the altcoin market. This aligns with Pizzino’s prediction and could be the harbinger of a new phase in the crypto market, where altcoins demonstrate significant rally alongside Bitcoin.

Featured image from Unsplash, Chart from TradingView

Bitcoin Price Targets $46,000 As DXY Receives Kiss Of Death

In a striking dual analysis, the financial charts paint contrasting futures for the US Dollar Index (DXY) and Bitcoin (BTC). Gert van Lagen, a technical analyst, has provided a bearish prognosis for the DXY, while simultaneously highlighting a bullish setup for Bitcoin that could see it aiming for a $46,000 target.

DXY Receives Kiss Of Death

The DXY has been in an upward trend since July, as shown by the blue ascending trend line on the daily chart. However, this line was broken to the downside on October 9, indicating a change in market sentiment. Van Lagen explains, “Blue uptrend since July has been broken too. Time to continue down.”

DXY 1-day chart

This sentiment is reinforced by the price action within the black channel from the beginning of October till recently, where a period of consolidation is visible, succeeded by a strong downward move. The DXY dropped by 1.2% last Friday, November 3, to 104.92 and is currently undergoing a retest of the channel, a common technical pattern where the price moves back to the breakdown point before continuing in the direction of the initial direction.

A third bearish argument for the DXY is the rejection at the highlighted red zone on the chart which signifies a high timeframe Fibonacci resistance area. The Fibonacci retracement is a popular tool among traders to identify potential reversal levels. The DXY’s price action shows a “clear rejection” at this level, where the index attempted to rise but was pushed back down, reinforcing the bearish stance.

Bitcoin Price Targets $46,000

Amidst the weakness of the DXY, the inverse correlation with Bitcoin becomes a focal point for crypto investors. Gert van Lagen provides insight into Bitcoin’s potential trajectory, observing a bullish pattern emerging on its 6-hour chart.

Bitcoin bullish pennant

“BTC [6h] – Bullish pennant in play targeting $46k. The pennant is part of the shown ascending channel,” remarked van Lagen. The chart displays Bitcoin’s price consolidating in a pennant structure, a continuation pattern that signals a pause in a strong upward or downward trend before the next move.

The pennant is delineated by converging trend lines which have been formed by connecting the sequential highs and lows of price action, converging to a point indicative of an imminent breakout.

In this case, the pennant follows a significant upward trend, suggesting that the breakout is likely to continue in the bullish direction. The ascending channel, highlighted by two parallel upward-sloping lines, encompasses the entire bullish movement of Bitcoin on the chart, including the pennant formation. This channel serves as a guide for the price trend, indicating where support and resistance levels are anticipated at the moment.

Van Lagen’s analysis posits a targeted price of $46,000 upon the resolution of the pennant, a level that is determined by the height of the prior move that preceded the pennant, projected upward from the point of breakout. The dashed lines on the chart illustrate the potential path Bitcoin’s price could take following the breakout.

An important detail in van Lagen’s chart is the ‘Invalidation’ level marked below the pennant. This level at $34,103 is critical as it signifies where the bullish hypothesis would be considered incorrect, serving as a stop-loss point for traders acting on this pattern.

At press time, BTC traded at $34,625.

Bitcoin price

Crypto Is On The Brink Of Explosion As 9-Year DXY Formation Returns

An inverse correlation between the crypto market and the DXY has often helped to signal when a bull rally is on the horizon. One of the most notable instances of this happened 9 years ago, and since then, the formation has not returned, until now, signaling a massive price surge in October.

DXY Readies To Clock 12th Consecutive Candles

In an X (formerly Twitter) post, crypto analyst TheCryptoMann has revealed an important formation in the DXY. The DXY is the United States Dollar Index which measures the value of the dollar to other major (6) currencies around the world.

Now, since Bitcoin is often touted as an alternate and better currency to the likes of the US dollar, there is often some competition between them leading to an inverse correlation over the years. This is why this DXY formation is important.

As TheCryptoMann points out, the DXY is headed toward a 12th consecutive green candle which is bullish for the crypto market. This is because the last time that this happened was in 2014, and the results were very bullish for crypto.

The analyst explains that when this happened in 2014, the DXY had fallen 8%. Crypto had then gone in the opposite direction, mounting a rather impressive rally. A look at the chart shows that in the year 2014, the crypto market went from $5.4 billion to over $8.2 billion, an over 50% surge in price.

Crypto total market cap chart from Tradingview.com (DXY)

A Bullish Time For Crypto

TheCryptoMann likens the current movement to what took place in 2014 and actually expects this movement to repeat once more. As he explains, the incoming correction in the DXY will see the crypto market explode as it did 9 years ago.

He also points out that “the DXY is also being rejected from the 0.5 FIB Retracement level from its most recent local highs and lows!”

He further added:

There is a clear inverse correlation between the DXY and the cryptocurrency market. So over the next month, we’re about to see some major price movements, so eyes on the market.

Another analyst Cryptoinsighuk also seems to share the views of TheCryptoMann as he also believes there is correction coming for the DXY. “Also, whilst sentiment is this bad we are having the SBF trial. This is negative towards Crypto, tells me the bottom could be very close in this move,” the analyst added.

If TheCryptoMann’s forecast is correct, then the crypto market could be getting ready for a massive move to the upside. A similar rally would see the total market cap go from $1.065 trillion currently to over $1.5 trillion, signaling a bullish end to the year 2023.