Ethereum is trading at critical levels after enduring weeks of aggressive selling pressure. Since retracing below the key $2,000 mark, the second-largest cryptocurrency has struggled to regain bullish momentum. Currently down 21% from that level, ETH continues to hover near $1,580, reflecting a clear lack of conviction from both buyers and sellers.
The market has entered a period of extreme indecision. According to top analyst Daan, Ethereum’s price has remained notably compressed, barely moving over the past two days. This type of consolidation often precedes sharp price action in either direction, and traders are watching closely for signs of a breakout or breakdown.
Macroeconomic uncertainty continues to influence investor sentiment, with global trade tensions and monetary policy concerns keeping pressure on risk assets like Ethereum. For now, bulls must reclaim the $1,850 resistance zone to confirm a trend reversal, while a drop below $1,500 could open the door to deeper losses.
As volatility builds in the background, the current compression could be the calm before a storm—setting the stage for Ethereum’s next decisive move. Will it break out to the upside, or is more downside in store?
Ethereum Compression Signals Breakout As Macro Pressure Builds
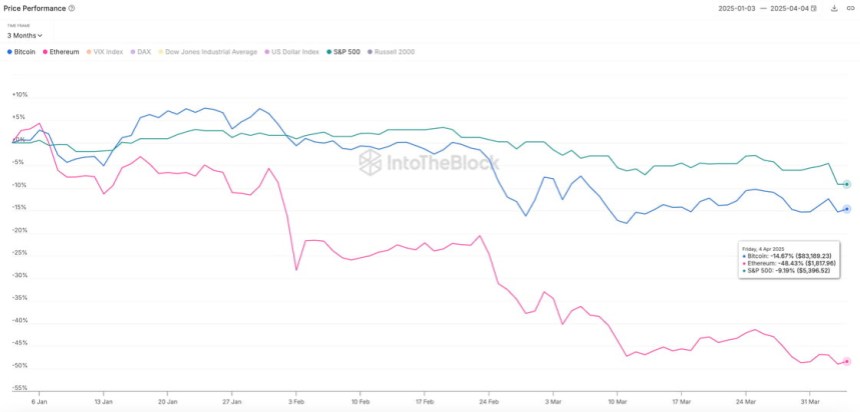
Ethereum is facing a critical test as it trades at compressed levels following weeks of sustained selling pressure. The broader crypto market remains under pressure as global tensions escalate. US President Donald Trump’s trade war with China continues to shape macroeconomic sentiment, leaving investors cautious across all high-risk asset classes.
Despite last week’s announcement of a 90-day tariff pause for all countries except China, uncertainty remains. The unresolved status of US-China trade relations continues to weigh on markets and is one of the primary factors driving hesitation in price movement. For Ethereum, this has translated into extremely low volatility and a stalled price structure.
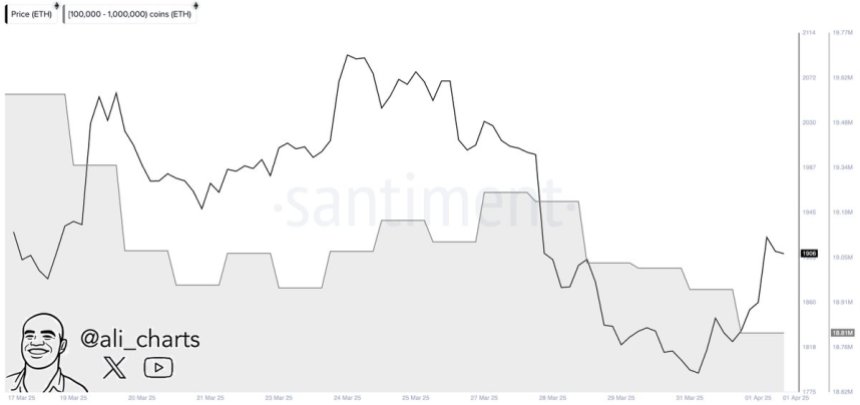
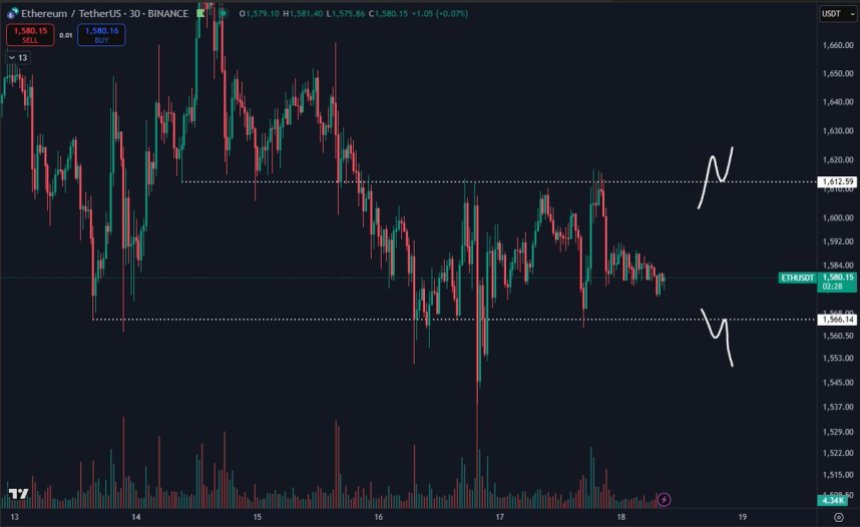
Daan shared insights suggesting that Ethereum’s price has been “extremely compressed” and has not shown meaningful movement for the better part of two days. According to Daan, this type of compression usually precedes a significant breakout—though the direction of that move remains unknown.
Investors and traders alike are closely monitoring this setup, as compressed price action typically leads to large, momentum-driven shifts. With broader macro risks still in play, Ethereum’s next move could define the short-term trend and set the tone for the market in the weeks ahead.
ETH Bulls Aim To Regain Control
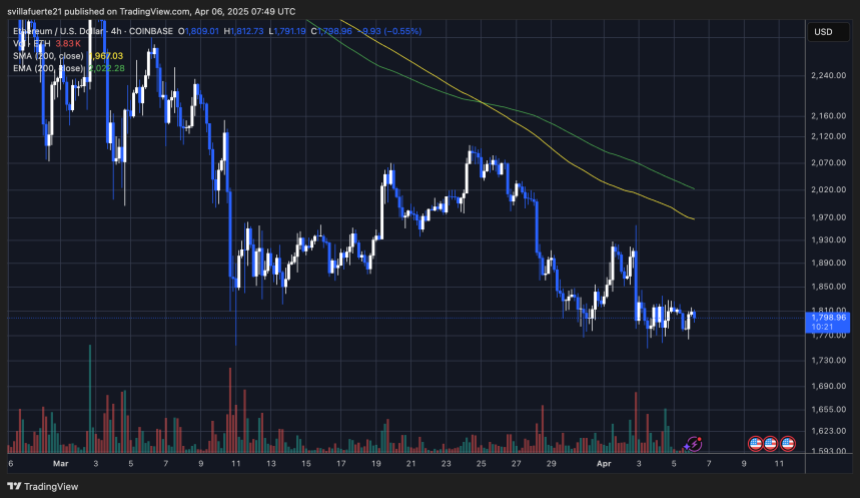
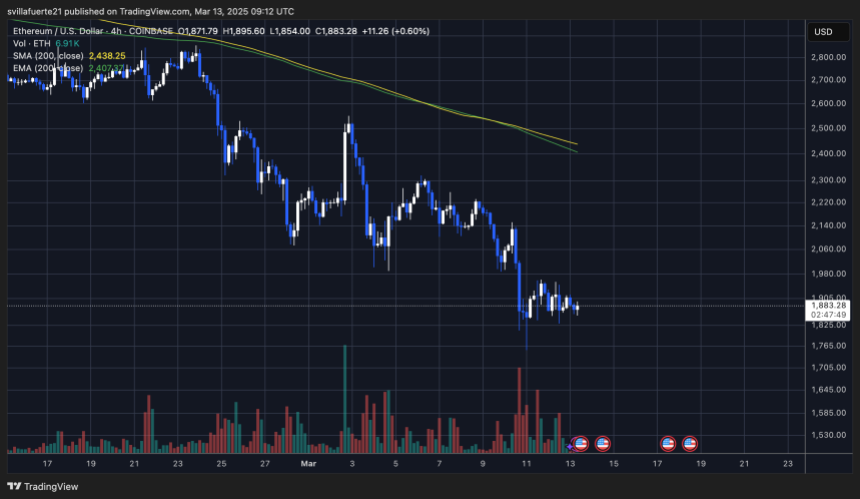
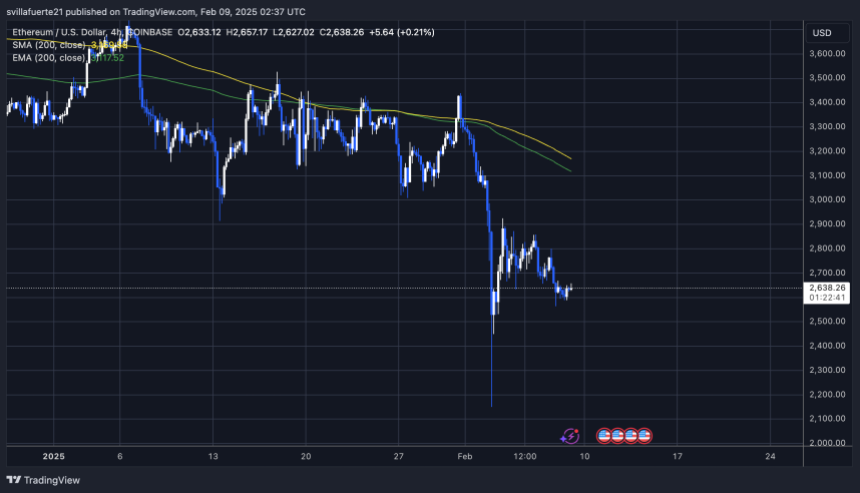
Ethereum is trading at $1,590 after several days of sideways price action, hovering between support at $1,550 and resistance near $1,700. Despite holding above the lower end of this range, ETH has struggled to generate the momentum needed to break out and confirm a short-term recovery.
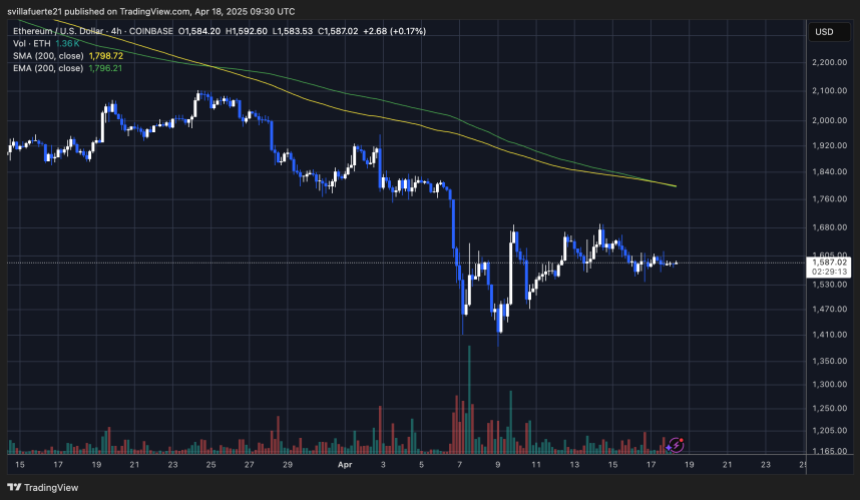
For bulls to establish a stronger position, ETH must push above the 4-hour 200-day moving average (MA) and exponential moving average (EMA), both of which continue to act as dynamic resistance. A breakout above these indicators could trigger renewed interest from traders and signal the beginning of a recovery phase.
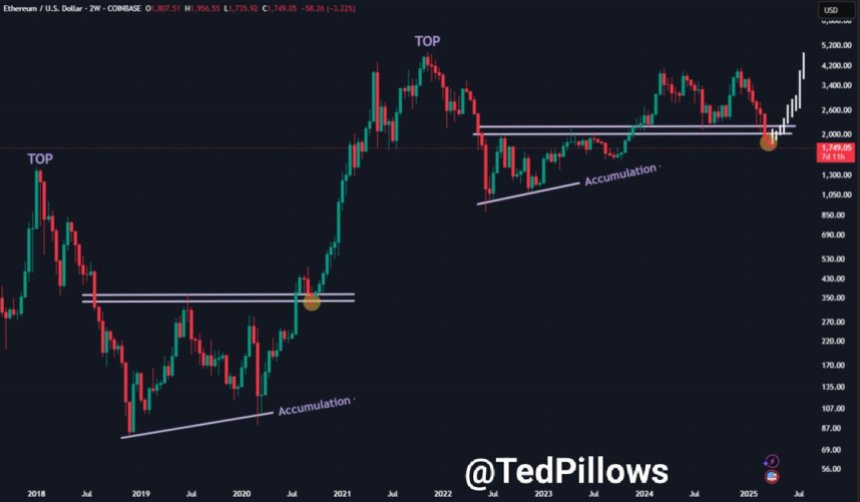
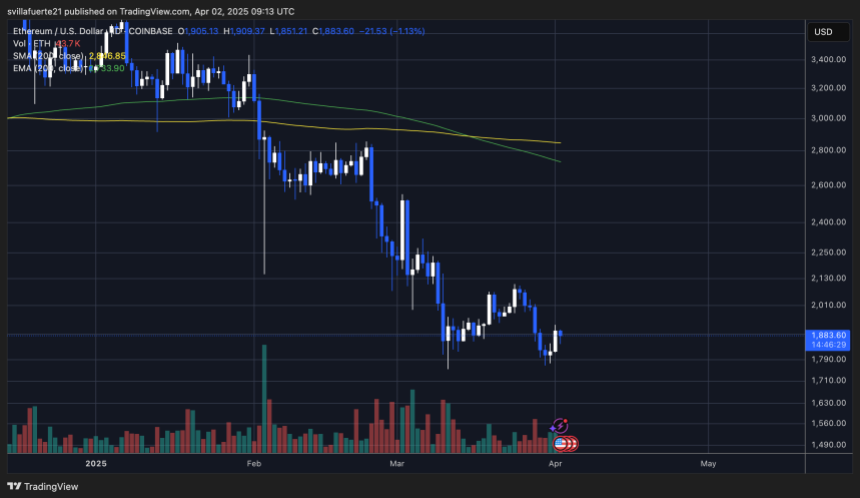
However, the true test lies at the $2,000 level—a major psychological and technical resistance zone. Reclaiming this level would mark a shift in market sentiment and open the door to higher targets.
On the downside, failure to gain ground above the current range and a drop below $1,550 could quickly drag ETH below $1,500, increasing the risk of a deeper correction. For now, Ethereum remains in a consolidation phase, and the next decisive move will likely dictate whether bulls regain control or if sellers push prices into lower demand zones.
Featured image from Dall-E, chart from TradingView