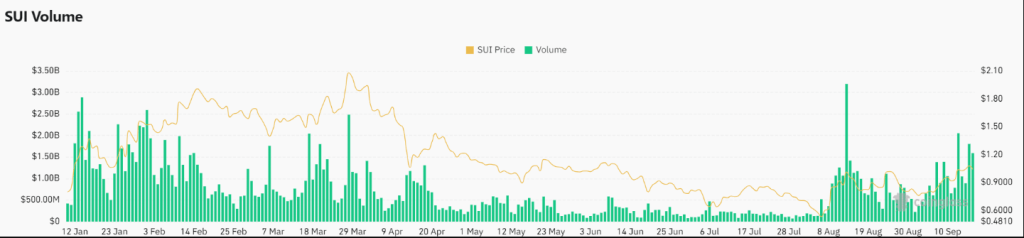
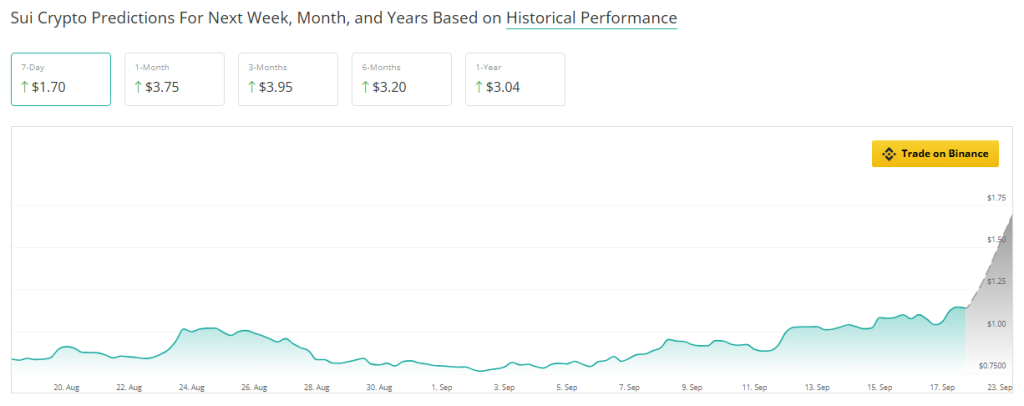
SUI has made some gigantic moves recently, posting strong bullish signals. In the last week, SUI registered an impressive 33% rally, pushing the price up to $1.18 at press time. This is getting people wondering whether the token is preparing for a longer ascent, as many are waiting for key levels that might influence the situation.
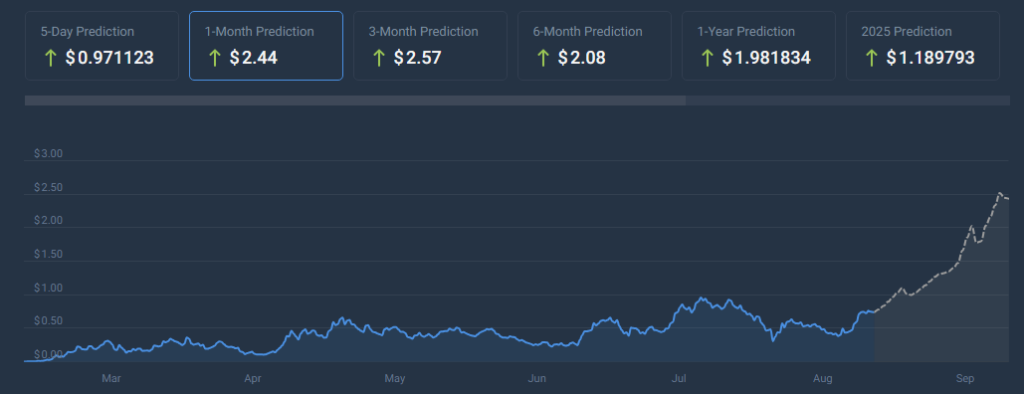
Price forecast for the altcoin predicts significant increase in the next few months. A strong upswing could propel the SUI to soar by 245% in the following three months.
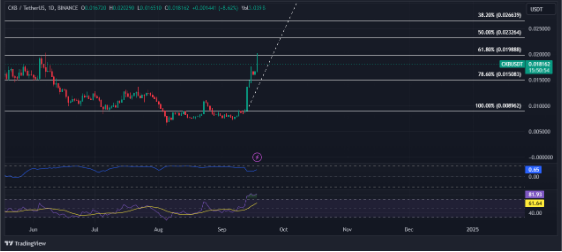
The price chart of SUI shows a sequence of higher highs and lower lows, which confirms this view—textbook evidence of optimistic momentum. SUI has gradually climbed from a low of $0.60 early this year, passing through several resistance zones along the way.
Bullish Trend Signals Strength
SUI’s price movement indicates that bullish sentiment is gathering steam. The token’s capacity to breach resistance zones points to perhaps more fuel left for the rally. Market observers are closely monitoring the next significant resistance level at $1.2047. Should SUI exceed this barrier, the following targets should lie between $1.50 and $1.80.
While the support held high at $1.125, a firmer layer of support is observed at $1.045. The battle is on between the bulls and the bears, but the momentum seems to be on the side of the bulls. What would be the final test is whether they can push SUI past these resistance levels to trigger another round of buying.
Volume And Open Interest On The Rise
Supporting the bullish outlook is the increase in volume and open interest. Data from Coinglass shows the trading volume of SUI has risen 3.25% to $1.83 billion while open interest is up 11.85% at $331 million. This rising trade volume indicates growing interest in this token,.
With the increasing engagement, people seem to have big confidence in the short-term prospects of SUI. With these uptrends, the market sentiment is going strongly on a roll to sustain this rally. Technical signals and trading activities are showing good numbers for SUI bulls.
Price Predictions Show Optimism
The three-month prediction on price for SUI is quite optimistic. Analysts predict the coin rising 245.86% over the next three months. This would signify a massive rise from its present levels, indicating important momentum to be seen within the market and investors. Further ahead, the six-month projection is estimated to increase by 180.47% while the one-year outlook will hike by 166.62%.
These numbers suggest that SUI might continue posting steady gains in the medium and long run, despite being traded at 228% below estimates in the next month, suggesting optimism is still around it. Investors are waiting and on the lookout for when SUI will cross past these key levels, which may unlock and open up better prospects for the future.
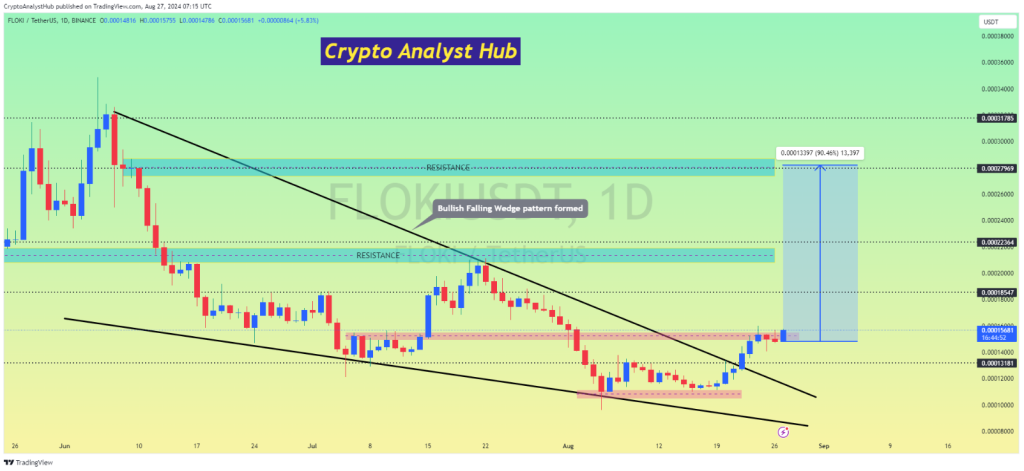
The coin is drawing further attention as it moves with bullish technical signals coupled with increasing volume and positive price forecasts. It may be about to embark on a protracted rally considering the current position of the token, where it has managed to breach the strong resistance levels of around $0.016.
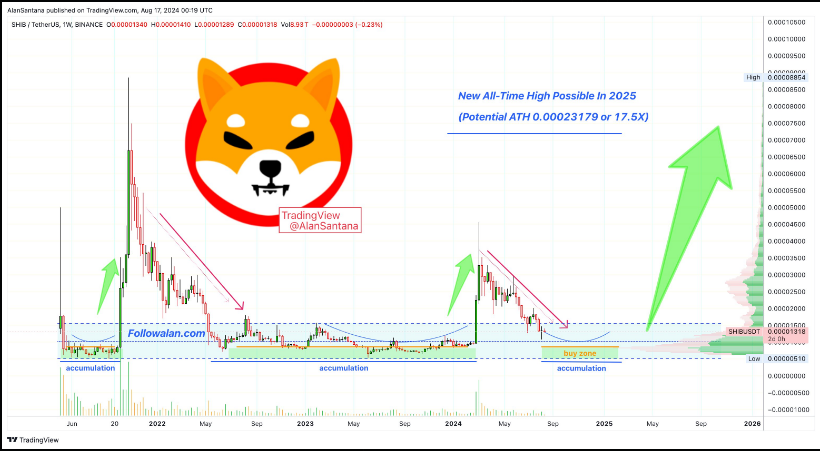
Featured image from Chainwire, chart from TradingView
 Supported Market: KRW, BTC, USDT Market
 Trading opens at: 2024-09-13 17:00 KST (estimated time)
 Discover more:
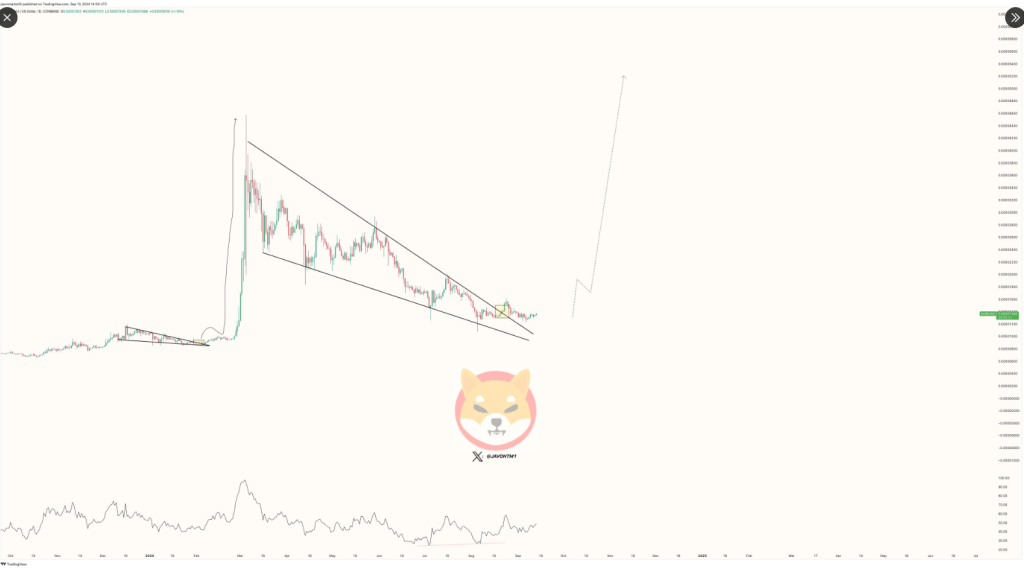

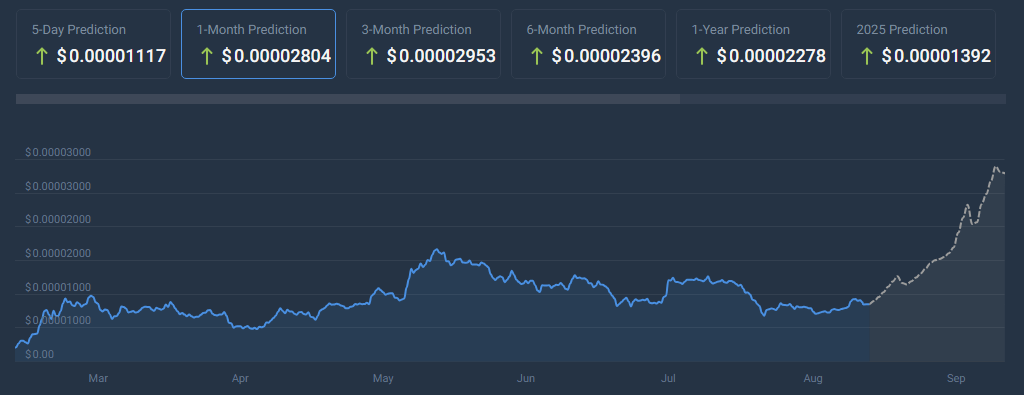
 The Sandbox 1,111% Growth Potential (Accumulation Strategy)


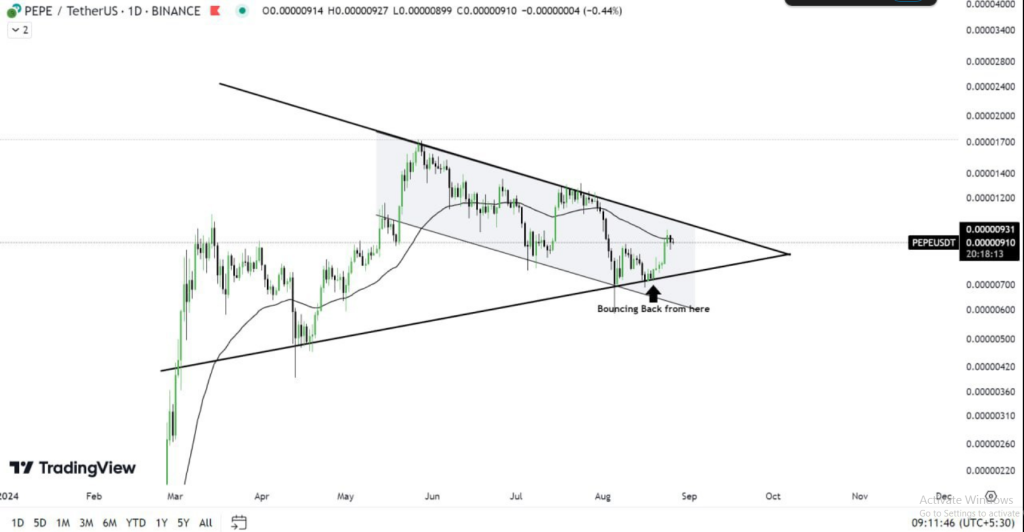
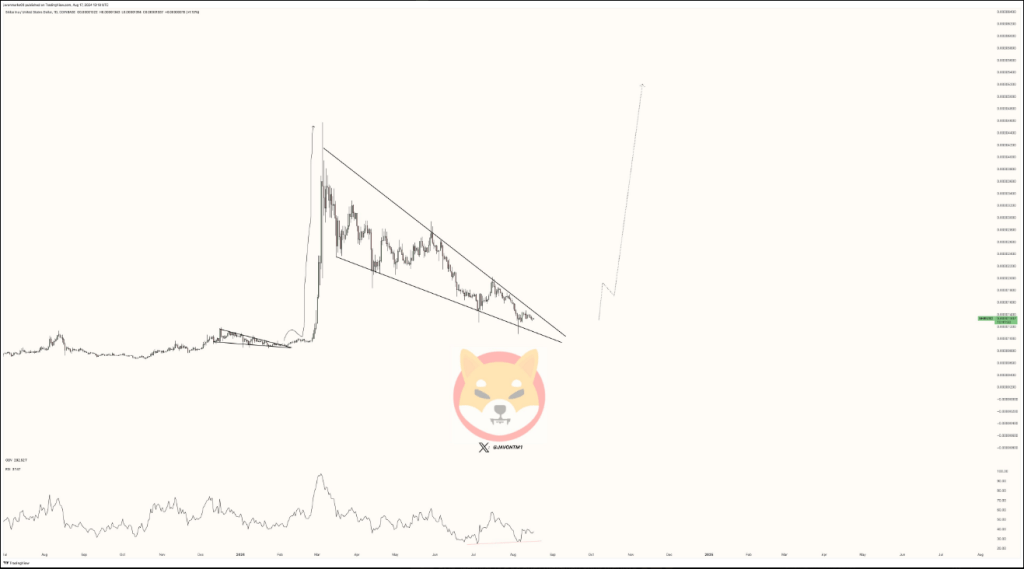
 MARKS (@JavonTM1)
  (daily)
  after getting bottomed out from the Symmetrical triangle in the daily timeframe
 .
. .
. ,…
,…