Market Downturn? Not For Optimism: A16z’s Major OP Purchase Sends Price Skyrocketing By 9%

In a month marked by a challenging correction in the crypto market, Layer 2 (L2) blockchain protocol Optimism has emerged as a standout performer. Within the past 24 hours, Optimism’s native OP token skyrocketed by 9%, positioning it as the best-performing token among the top 100 cryptocurrencies. 

Behind this surge lies venture capital firm a16z, which has reportedly invested around $90 million in Optimism’s OP token, signaling further institutional support for the layer 2 protocol. 

OP Receives Major Investment

Sources familiar with the matter have revealed to Unchained that a16z has acquired a significant stake in Optimism’s OP token. 

The investment, which comes with a two-year vesting period, underscores a16z’s interest in the Layer 2 protocol and aligns with its growing involvement in crypto. Notably, a16z’s portfolio already includes crypto exchange Coinbase. 

The investment by a16z comes amidst notable activity and growth within the Optimism ecosystem. Optimism’s OP Stack has experienced increased usage, further validating its value proposition. The protocol’s ability to increase scalability and reduce fees on the Ethereum blockchain has also garnered significant attention. 

Optimism’s spokesperson expressed enthusiasm for the investment, acknowledging the energy and momentum surrounding the protocol. The partnership with a venture capital firm like a16z is expected to fuel further development and innovation within the Optimism ecosystem.

On March 7, the Optimism Foundation disclosed the sale of approximately 19.5 million OP tokens, valued at nearly $90 million, to an undisclosed buyer. 

These tokens were reportedly sourced from a 30% pool of OP’s original treasury, dedicated to the foundation’s working budget. Reports indicated that the buyer could delegate their tokens to third parties, enabling them to participate in Optimism’s governance.

The foundation clarified that, due to the private nature of the sale, specific details regarding the terms and purchaser were not disclosed. 

Key Levels To Watch For Optimism

Despite the recent surge in the Optimism ecosystem and its native token OP, the token still trades well below its all-time high (ATH) reached on March 6, 2024, currently down over 47% from that level.

However, OP’s trading volume has experienced a notable surge, indicating continued interest in the token. According to CoinGecko data, the OP trading volume has increased by over 113% compared to the previous trading day on April 30, amounting to nearly $600 billion in 24 hours.

Optimism

Key levels to monitor for the token soon include OP’s significant resistance at the $2.62 price mark and a potential retest of the $3 zone. 

However, a clear indication of a positive trend for the Optimism token would require a successful consolidation above the $3.92 zone, marking the end of the month-and-a-half downtrend structure.

Conversely, the $2.37 zone has proven to be a crucial support level for OP, as it has held for the past five days and prevented further price decline for the token. 

Digging deeper, the $2.25 mark is also a key support, with the most critical support level at $2.11. This level holds the key to Optimism’s macro bullish structure, as it initiated the token’s current uptrend.

Featured image from Shutterstock, chart from TradingView.com 
FXS Price Poised For Uptrend As Frax Finance Unveils Roadmap To Reach $100B TVL

Frax Finance, a decentralized finance (DeFi) protocol, recently unveiled its Singularity Roadmap. It aims to propel the total value locked (TVL) of its layer 2 blockchain, Fraxtal, to $100 billion by the end of 2026. This notable surge would represent a 760,000% increase from the current TVL levels, which stand at $13 million. 

Frax Finance Singularity Roadmap

According to the protocol’s announcement, Fraxtal, the substrate that powers the Frax ecosystem, serves as Frax Finance’s operating system. With the launch of Fraxtal and achieving an effective 100% Collateralization Ratio (CR), Frax Finance claims to have consolidated its core product offerings. 

To reach the ambitious $100 billion TVL goal, the protocol has announced that it has already generated over $45 million, reaching the coveted 100% CR. 

As announced, with this milestone achieved, the FRAX stablecoin, which has remained relatively dormant during the process, and the FXS revenue share, which has been temporarily reduced by 90% to conserve assets, can now undergo a “transformative change.” 

In addition, the upcoming introduction of Layer 3s (L3s) on Fraxtal is expected to be a key factor in further contributing to the growth and adoption of the protocol.

Fraxtal, which is built on the Optimism (OP) network, stands out as one of the most widely used layer 2 solutions on top of Ethereum (ETH), according to the protocol. The Frax team says it has developed its underlying incentives to provide a seamless experience for developers and users, further encouraging adoption. 

In particular, by owning the entire stack, Frax can introduce advanced features such as account abstraction, new precompiles, privacy features, aggregated decentralized applications (dApps), and interoperability with Superchain. 

The protocol believes these features will enhance the on-chain experience, making Fraxtal the “preferred” platform for holding, staking, and transferring crypto assets.

Expansion Strategy

The proposal also unveils Frax Finance’s plan to establish 23 Layer 3s within 365 days, kicking off the “Fraxtal Nation” community. By supporting these 23 chains with developer access, incentives, and investment, Frax aims to foster a positive-sum approach and provide additional support to official partners. 

The protocol also suggests that these partners will receive “substantial allocations” of FXTL points, aiming to solidify the role of the FXS token as the ultimate beneficiary of the Frax ecosystem.

Moreover, Frax Finance founder Sam Kazemian intends to allocate 50% of the revenue from protocol fees to veFXS token holders. In comparison, the remaining 50% will be used to acquire FXS and other Frax assets for pairing in the FXS Liquidity Engine (FLE).

This initiative will increase liquidity, strengthen the Frax balance sheet, and provide additional incentives for the protocol’s stakeholders.

Frax Finance’s proposal also seeks to reactivate the protocol fee switch, which was temporarily turned off during the consolidation phase of the protocol. 

By reigniting this switch, a portion of the yield generated from protocol fees will be directed toward veFXS token holders. veFXS, or veiled FXS, represents a locked version of the native token, FXS, and offers enhanced voting power and participation in the Frax ecosystem.

Frax Finance

As of the time of writing, FXS has not responded favorably to the news. Its current trading price is $6.93, reflecting a 3.5% loss in the past 24 hours. It is important to note that the proposed protocol features are still in development, and the impact on the Frax Finance ecosystem and the token’s performance is yet to be determined.

Featured image from Shutterstock, chart from TradingView.com
Uniswap Expands Reach: Deploys v2 Protocol On Six New Chains Including Arbitrum And Polygon

Uniswap (UNI), one of the largest decentralized cryptocurrency exchanges (DEX) by trading volume, has made an important announcement regarding deploying its v2 protocol on six additional chains. 

The chains on which the v2 protocol has been deployed include Arbitrum (ARB), Polygon (MATIC), Optimism (OP), Base, Binance Smart Chain (BSC), and Avalanche (AVAX).

Uniswap Widens v2 Protocol Deployment

According to a recent post on X (formerly Twitter) by Uniswap Labs, the software product developer working on the protocol, the decision to deploy the v2 protocol on more chains is primarily driven by the desire to simplify the experience for Liquidity Providers (LPs).

While the protocol’s v3 offers advanced features tailored for active liquidity providers, the development team believes the v2 protocol offers a more “straightforward approach.” 

By default, v2 pools cover the entire price range, reducing the need for upfront decisions and minimizing the active involvement of liquidity providers. This simplification streamlines the process and makes it more accessible to a broader range of users, according to the announcement. 

Another benefit of using the v2 protocol on multiple chains, according to Uniswap Labs, is its cost efficiency. Creating pools on v2 is more gas efficient than other versions, resulting in lower gas costs to add liquidity. 

This cost reduction can be translated into savings for users, making swaps on the platform “incredibly affordable.” In addition, the use of v2 on Layer 2 scaling solutions significantly reduces the risk of frontrunning and manipulative practices known as Miner Extractable Value (MEV). 

Ultimately, by offering an official v2 deployment directly accessible through the Uniswap interface, the developers suggest that users can be assured of a safe and secure environment for their swaps.

UNI Price Dip, Platform Metrics Remain Solid

Despite the recent developments that could attract investors’ attention and drive broader adoption of the Uniswap protocol, the exchange’s native token, UNI, is currently undergoing a significant correction in line with the overall market trend.

Currently, UNI is trading at $7.22, representing a 4.4% price drop in the past 24 hours and a 1.1% decline in the last trading hour. However, it’s worth noting that UNI has been one of the better-performing tokens in the market, with price increases of 14.7% and 16.8% in the past fourteen and thirty days, respectively.

Uniswap

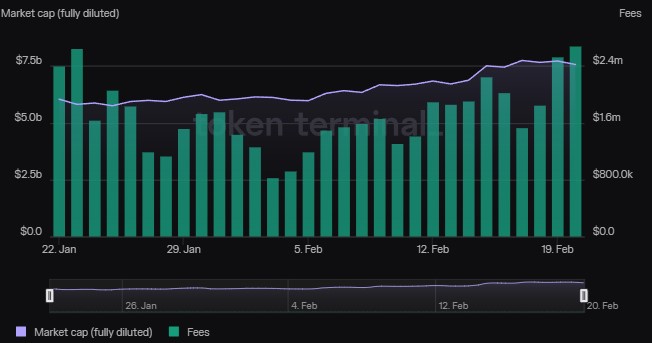
Furthermore, according to data from Token Terminal, the Uniswap ecosystem continues to exhibit substantial growth in key metrics. 

The fully diluted market capitalization of Uniswap stands at $7.56 billion, reflecting the total value of all tokens if they were fully in circulation. This figure has experienced a notable increase of 18.4% over the past month. 

In contrast, the circulating market capitalization, which considers the currently circulating tokens, is valued at $6.94 billion, indicating a 19.9% increase over the same period.

Uniswap

Despite the overall surge in market capitalization, the trading volume of the UNI token has experienced a significant decline of 69.3% over the past 30 days, amounting to $2.79 billion. 

The total value locked (TVL), a measure of the value of assets locked within Uniswap’s smart contracts, has also experienced a 14.4% increase, reaching $4.76 billion. 

Featured image from Shutterstock, chart from TradingView.com 

Optimism (OP) Climbs 6% A Day As Crypto Market Rebounds, What’s Next?

Optimism (OP) has posted notable gains today, October 2, trading at $1.45, with a 5% increase in the last 24 hours. Furthermore, its price has gained 15% in the last seven days. 

OP’s rise coincides with the improvement in the general crypto market, which showed a remarkable recovery. However, whether OP will sustain the ongoing rally remains to be seen. But a close look at a few technical indicators may provide vital insights into its next price moves. 

OP Approaches Overbought Zone As Buyers Sustain Rally

OP continues to show positive price momentum as buyers dominate the market. Also, it has formed a fifth consecutive candle on the daily chart, confirming active accumulation by traders. Its rally became prominent on September 29, when it broke above the Donchian Channel (DC) median band.

OP flipped the $1.41 resistance level to support today and edges closer to the upper band of the Donchian Channel towards the $2.50 resistance level. If the buyers sustain the rally above the $1.50 resistance, OP will likely move into the overbought zone. 

Additionally, the Moving Average Convergence/Divergence (MACD) has risen above its signal line, displaying a strong buy signal. Also, the Histogram bars are green, confirming that the buyers are still active. More so, the Relative Strength Index (RSI) indicator displays a value of 64.2 and is rising to the overbought region of 70. 

Based on these indicators, OP will likely enter the overbought zone in the coming days, implying that accumulation will continue. However, traders should look out for bearish resistance at the $1.50 level that could serve as a potential entry point for sellers. 

OPUSD price chart

What Could Be Behind OP’s Recent Gains?

Besides the general recovery in the crypto market, Optimism records exciting developments in its ecosystem. One notable change is a September 29, 2023, proposal to change Optimism’s security model. 

According to the proposal, the OP team aims to hand over the admin key for the OP Mainnet to public and decentralized participants. These participants will be the Security Council held accountable for Optimism’s Governance. 

Although this proposal awaits approval, it creates engagement in the OP ecosystem, thus increasing investor interest and activity. And this increased activity exerts higher buy pressure on the token. 

Furthermore, the Optimism Superchain is another innovation driving ecosystem growth. According to blockchain data provider Covalent, the Superchain is an interlinked blockchain network of individual chains tagged “OP chains.” 

Interestingly, builders can use the Superchain to engage in on-chain development. However, they must comply with the Law of Chains, a set of community rules on how teams support public goods and decentralization. 

The OP Mainnet is the first member of the Superchain. Again, it has recorded increased daily active addresses, higher than Arbitrum, which is declining in on-chain activity. 

BuildOnBase, created by Coinbase, is the second member of the Superchain, aiming to attract billions of users. BuildOnBase ranked as one of the best-performing chains in 2023 and the fastest L2 to reach 100,000 users in 56 days. 

These developments are likely driving the growth in the Optimism ecosystem, evident in its recent price surge. 

Optimism (OP) Tallies 13% In 7 Days Despite High Profile DeFi Hack

In the midst of the ever-changing cryptocurrency landscape, Optimism (OP) has shown remarkable resilience, posting a notable price increase of 13.53% in the past seven days. Despite facing a slight decline of 1.80% in the last 24 hours and a further 1.35% shrinkage within the hour, Optimism remains on an upward trajectory.

With the current price sitting at $1.68 per OP and still 48.38% below its all-time high of $3.26, traders and investors are eager to uncover the reasons behind its recent gains. This article explores the factors contributing to Optimism’s recent surge and analyzes its prospects.

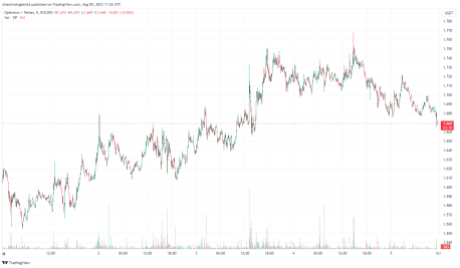
optimism (OP) price has enjoyed a steady spike in the past week: Source @Tradingview

High Profile Hack Could Stall Optimism (OP) Bullish Trajectory 

Optimism’s positive trajectory took an unexpected turn when Coinbase’s newly launched BASE network, built on the Optimism Stack, fell victim to a backdoor contract exploit. This unfortunate event resulted in the loss of 597 Ether, equivalent to approximately $1 million.

The exploit involved infiltrating a backdoor contract on the BASE Chain, which enabled the continuous minting of tokens that were subsequently sold for profit. The exploiters managed to mint 40 different tokens, generating significant profit, which was then moved out of the perpetrators’ address.

Related Reading: Curve Finance Exploiter Returns 61,000 ETH After Protocol’s Stern Warning

As BASE anchors the OP Stack, there are concerns that the recent exploit could have repercussions on all associated protocols, including the Optimism network. Furthermore, the hype surrounding BASE had attracted several new addresses to the Optimism network, potentially dampening investor sentiment and a subsequent impact on OP’s price.

The number of active addresses on the Optimism network increased following BASE’s launch in late February. However, the recent hack may stall this growth, as investors might exercise caution in the wake of the exploit.

Will The Bulls Sustain The Impressive Rally?

Despite the recent BASE exploit, Optimism (OP) has managed to maintain a sense of optimism in the market. The OP/USD daily chart displays promising signs of bullish momentum, with the bulls surpassing critical support levels. Short green candlesticks formed above the $1.631 support level indicate the market’s resilience and determination to keep the price afloat despite the challenges posed by the recent exploit.

The technical indicators further reinforce the bullish outlook for Optimism. The Moving Average Convergence/Divergence (MACD) remains above the signal line, characterized by green histogram bars that signify the asset’s bullish momentum. Additionally, the Relative Strength Index (RSI) has entered the overbought region, reaching a value of 75. This suggests a considerable increase in buying pressure on OP as investors show confidence in the token’s potential for future growth.

Related Reading: Coinbase Research Expert Decodes Latest Crypto And Finance Market Trends

However, while the market sentiment remains positive, traders and investors should exercise caution. The recent BASE exploit has raised concerns about the potential impact on Optimism’s network and the broader sentiment surrounding the token. 

The cryptocurrency market is known for its volatility, and external events can have significant implications for token prices. It is crucial for market participants to closely monitor developments related to the exploit and assess any potential consequences for Optimism’s price trajectory. Despite the positive indicators and bullish momentum, staying informed and vigilant in such a rapidly changing market is essential for making well-informed decisions.

(This site’s content should not be construed as investment advice. Investing involves risk. When you invest, your capital is subject to risk).

Featured image from iStock, chart from TradingView

Optimism (OP) Flashes Double-digit Gains, Can Bulls Push Price To $2?

The price of Optimism (OP) has struggled against tether (USDT) in recent weeks after seeing its price rejected from $2.5. Bitcoin’s (BTC) price showed some great strength bouncing off from a low of $18,500 to a high of $21,000. This movement has affected other altcoins as most cryptocurrencies produce double-digit gains, including Optimism (OP). (Data from Binance)

Optimism (OP) Price Analysis On The Weekly Chart 

The price of OP has had difficulty replicating its bullish move that saw the price rally to $2.5 in recent months as it rallied with a good bullish sentiment. 

After falling from an all-time high of $2.5, OP has struggled to stay afloat as the price fell to a low of $1. OP price has formed good support at $1 with what looks like an area of interest for buyers and investors.

The price of OP closed the week on a high with the new week looking more bullish; this shows strength to recover, and with this momentum from OP, we could see the price revisiting the $2 mark, where it will face resistance to trend higher.

The price of OP is faced with resistance at $2, and if the price of OP flips this region, we could see the price going to a region of $2.5 and even higher.

If the price of OP sustains this bullish bias, the price has a better chance of breaking past $2 and going higher with good buy volume.

Weekly resistance for the price of OP – $2.

Weekly support for the price of OP – $1.

Price Analysis Of OP On The Daily (1D) Chart
Daily OP Price Chart | Source: OPUSDT On Tradingview.com

OP saw its price rejected from $2.5 as the price fell to a low of $1; the price of OP bounced from this after form support to hold off sell orders.

The price of OP rallied from the low of $1 to $1.2, where it faced resistance as prices continued to range between $1 to $1.2. 

After forming a bullish symmetric triangle, the price of OP broke out with strong bias as the price could go from $1.5-$2. A close OP above $1.25 could see the price rally higher after showing bullish movements.

The price of OP trades at $1.28, trying to break and hold above the 50 Exponential Moving Averages (EMA) on the daily timeframe. The price at $01.2 corresponds to the 50 EMA acting as resistance to the price of OP.

OP needs to break above the 23.1% Fibonacci retracement value acting as resistance for the price of OP. If OP breaks and closes above this region, we could see the price going to $1,5.

Daily resistance for the OP price – $1.5-$2.

Daily support for the OP price – $1.2-$1.

OP Price Analysis On The Four-Hourly (4H) Chart
Four-Hourly OP Price Chart | Source: OPUSDT On Tradingview.com

The price of OP in the 4H timeframe continues to look bullish after breaking out of a symmetric triangle with bullish signs; the price retested above the 200 EMA bullish signs could be on the cards. 

OP price trades above the 50 EMA and 200 EMA, with the prices corresponding to $1.1 and $1.22 acting as support areas for the price of OP.

On the 4H chart, the Relative Strength Index (RSI) for OP is below 60, indicating high buy order volume for OP price.

Four-Hourly resistance for the OP price – $1.5.

Four-Hourly support for the OP price – $1.2.

Featured Image From Coinx3, Charts From