Crypto Analyst Reveals Trigger For 17% Polygon (MATIC) Rally

An analyst has explained how Polygon could see a rally of around 17% if the cryptocurrency’s price breaks above this level.

Parallel Channel May Reveal What Could Be Next For Polygon

In a post on X, analyst Ali has discussed about a parallel channel that Polygon has been consolidating inside during the last few weeks. The “parallel channel” here refers to a technical analysis (TA) pattern that’s drawn using two parallel trendlines.

This pattern’s upper line joins successive tops in the asset while the lower one connects bottoms. While the price is inside the region bounded by these two lines (the “channel”), it’s probable to stay trapped in it, only consolidating sideways.

Naturally, retests of the upper line can likely result in reversals back to the downside, while the lower one may act as a source of support, helping the coin bottom out and regain an uptrend.

There are different types of parallel channels in TA, like the ascending and descending ones, where the channel is slopped upwards or downwards.

In the context of the current topic, though, a parallel channel parallel to the time axis is of interest. This means consolidation inside this channel occurs between the same top and bottom levels.

Like with other consolidation patterns in TA, a break out of the trendlines of the parallel channel can also suggest a continuation of the trend in that direction. More specifically, a surge above the pattern can suggest bullish momentum for the asset, while a drop under the channel may spell a bearish outcome instead.

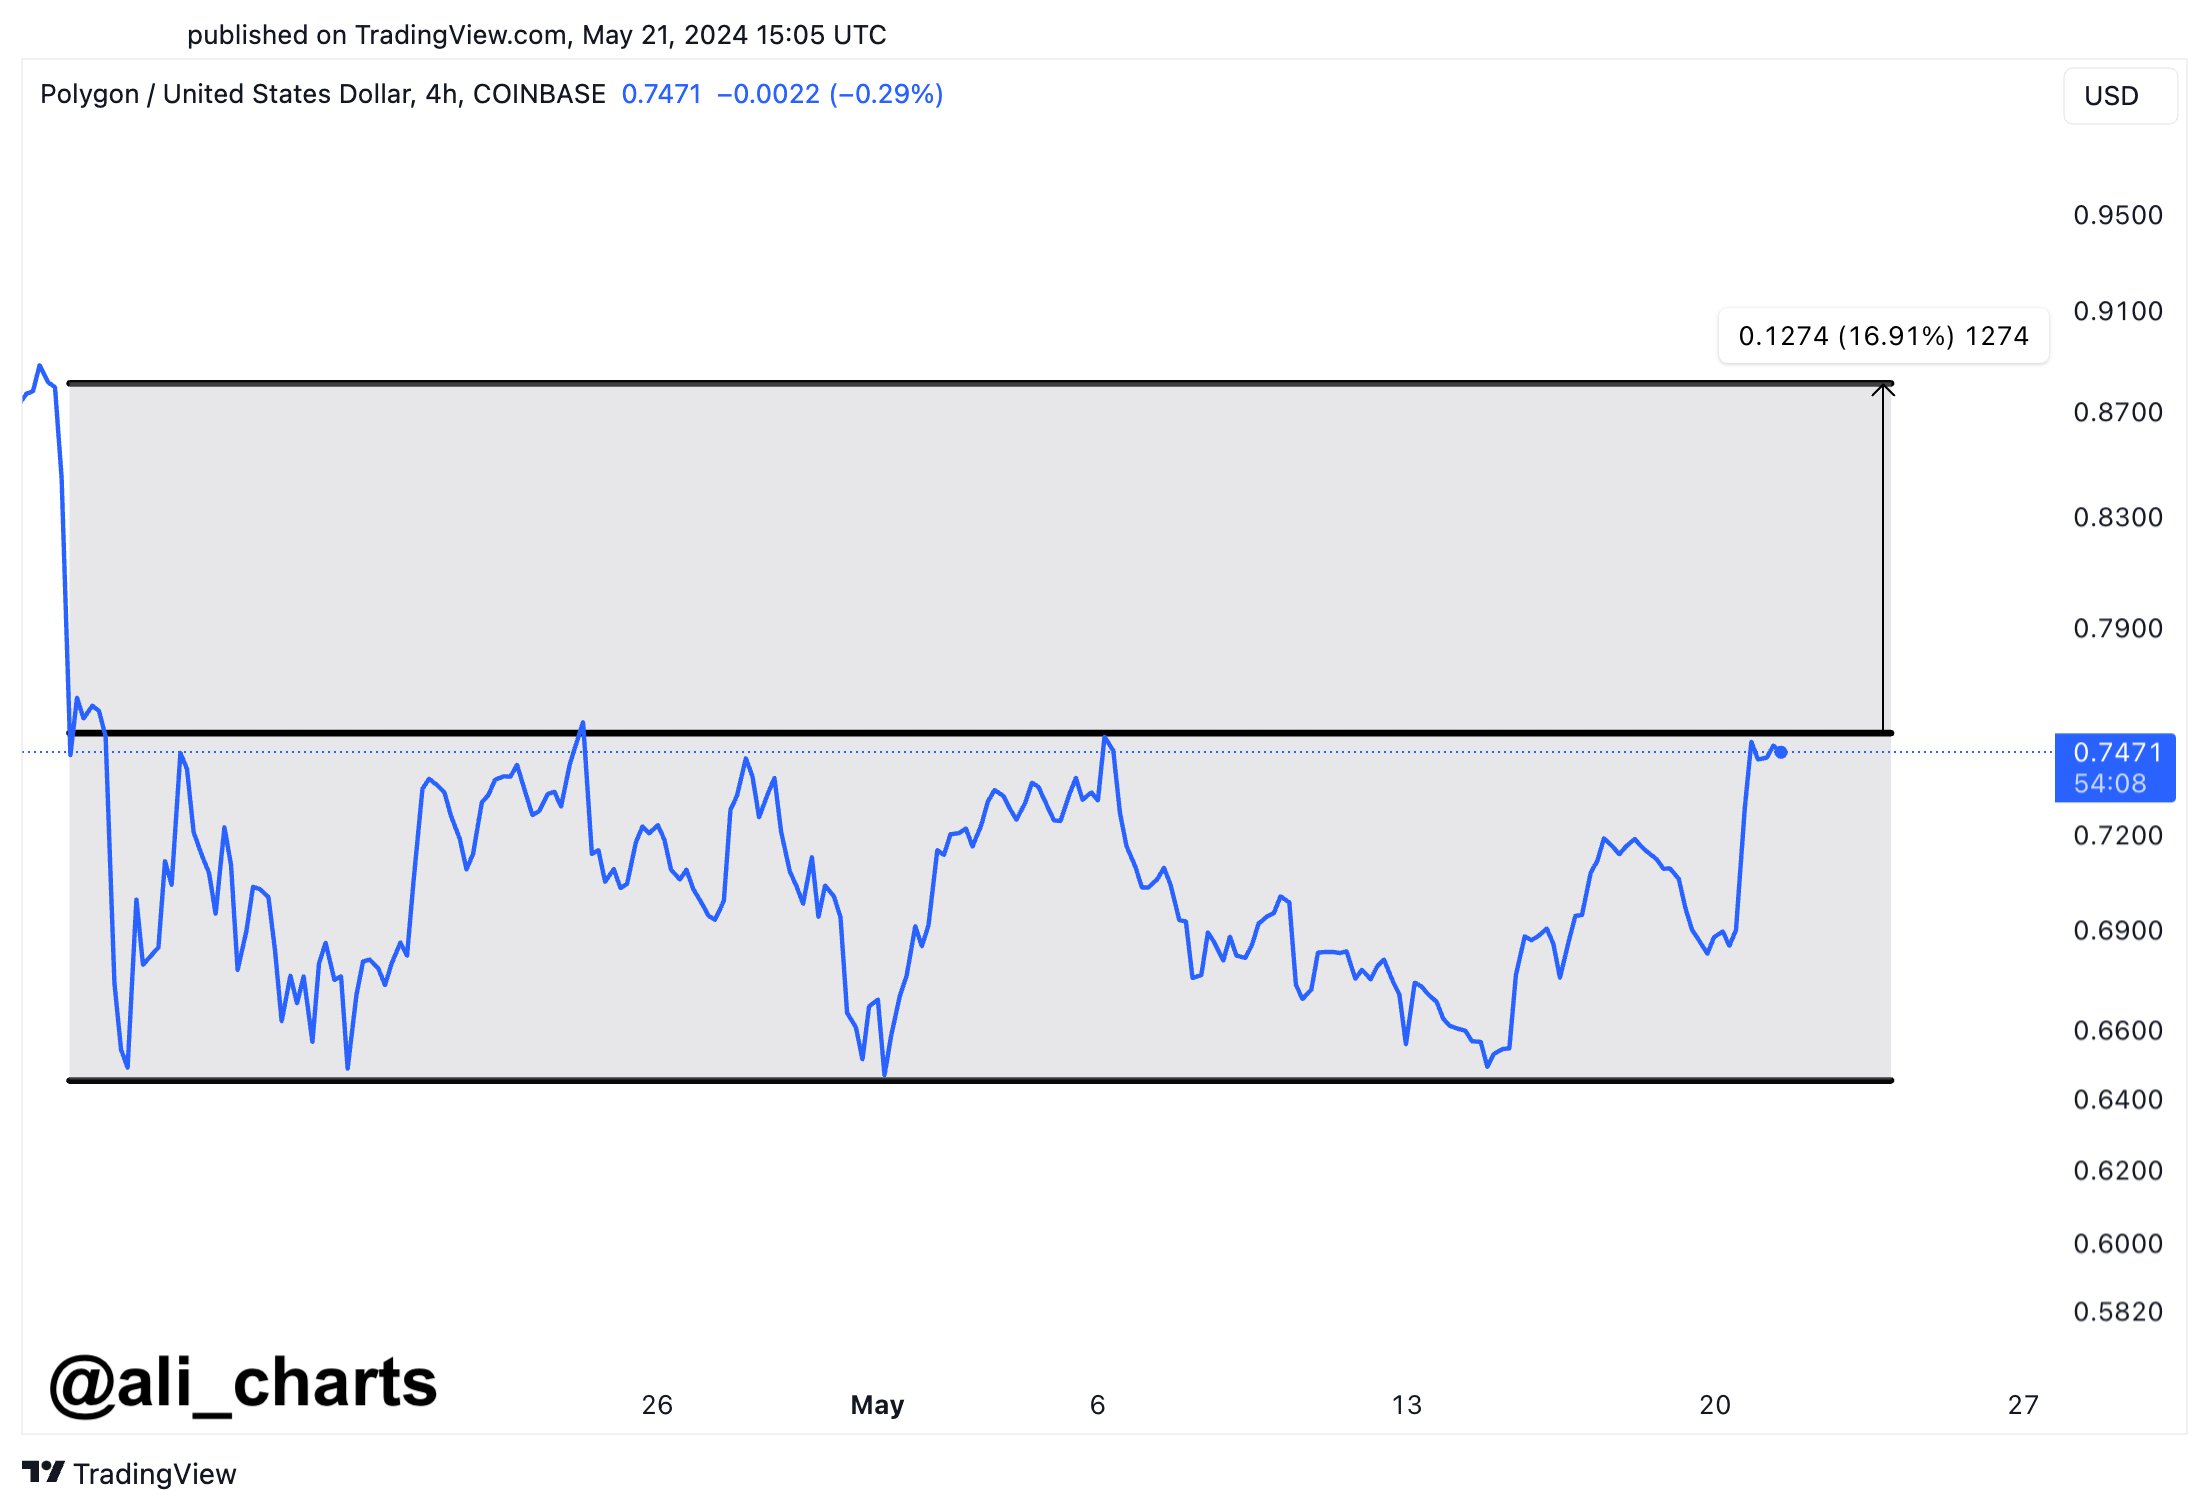
Now, here is a chart that shows how the parallel channel that Polygon has been consolidating inside has looked like over the past month:

Polygon Parallel Channel

From the above graph, it’s visible that Polygon has been stuck in consolidation inside this parallel channel since the cryptocurrency crash last month.

The asset has made some attempts at the upper level, but so far, all of them have failed, with the coin unable to find any break. MATIC is currently floating near the level, so another retest may be coming up soon.

If the Polygon price surges above the channel this time, it may enjoy some sustained bullish momentum. “A breakout above $0.76 could trigger a 17% surge, pushing $MATIC to $0.88!” notes Ali.

This price target is based on the fact that the crash last month, which threw the asset into this consolidation, occurred starting from around that level. Given this potential retest of the upper line of the channel, it now remains to be seen how the cryptocurrency performs in the coming days.

MATIC Price

Polygon almost touched the $0.76 upper level of the channel yesterday, but the coin has since observed a pullback, and it’s now back down to $0.72.
Polygon Price Chart

Polygon (MATIC) In Buy Zone That Earlier Led To 112% & 87% Surges

On-chain data shows Polygon (MATIC) is currently inside the same buy zone that earlier led to rallies of around 112% and 87% for the asset.

Polygon 30-Day MVRV Ratio Is Significantly Negative Currently

As pointed out by analyst Ali in a post on X, MATIC is showing a historically bullish pattern in its 30-day MVRV ratio. The “Market Value to Realized Value (MVRV) ratio” here refers to an on-chain indicator that keeps track of the ratio between the Polygon market cap and realized cap.

The realized cap is a capitalization model that calculates the total valuation of the cryptocurrency by assuming that the “real” value of any coin in circulation isn’t the current MATIC spot price, but rather the price at which it was last transferred on the blockchain.

Considering that the last movement of any coin was the last time it changed hands, the price at its time would serve as its current cost basis. As such, the realized cap essentially sums up the cost basis of every coin in circulation.

Put another way, the realized cap is a measure of the total amount of capital the investors have put into the asset. Since the MVRV ratio compares the value the holders are carrying right now (that is, the market cap) against this initial investment, its value can tell us about the profit-loss status of the market as a whole.

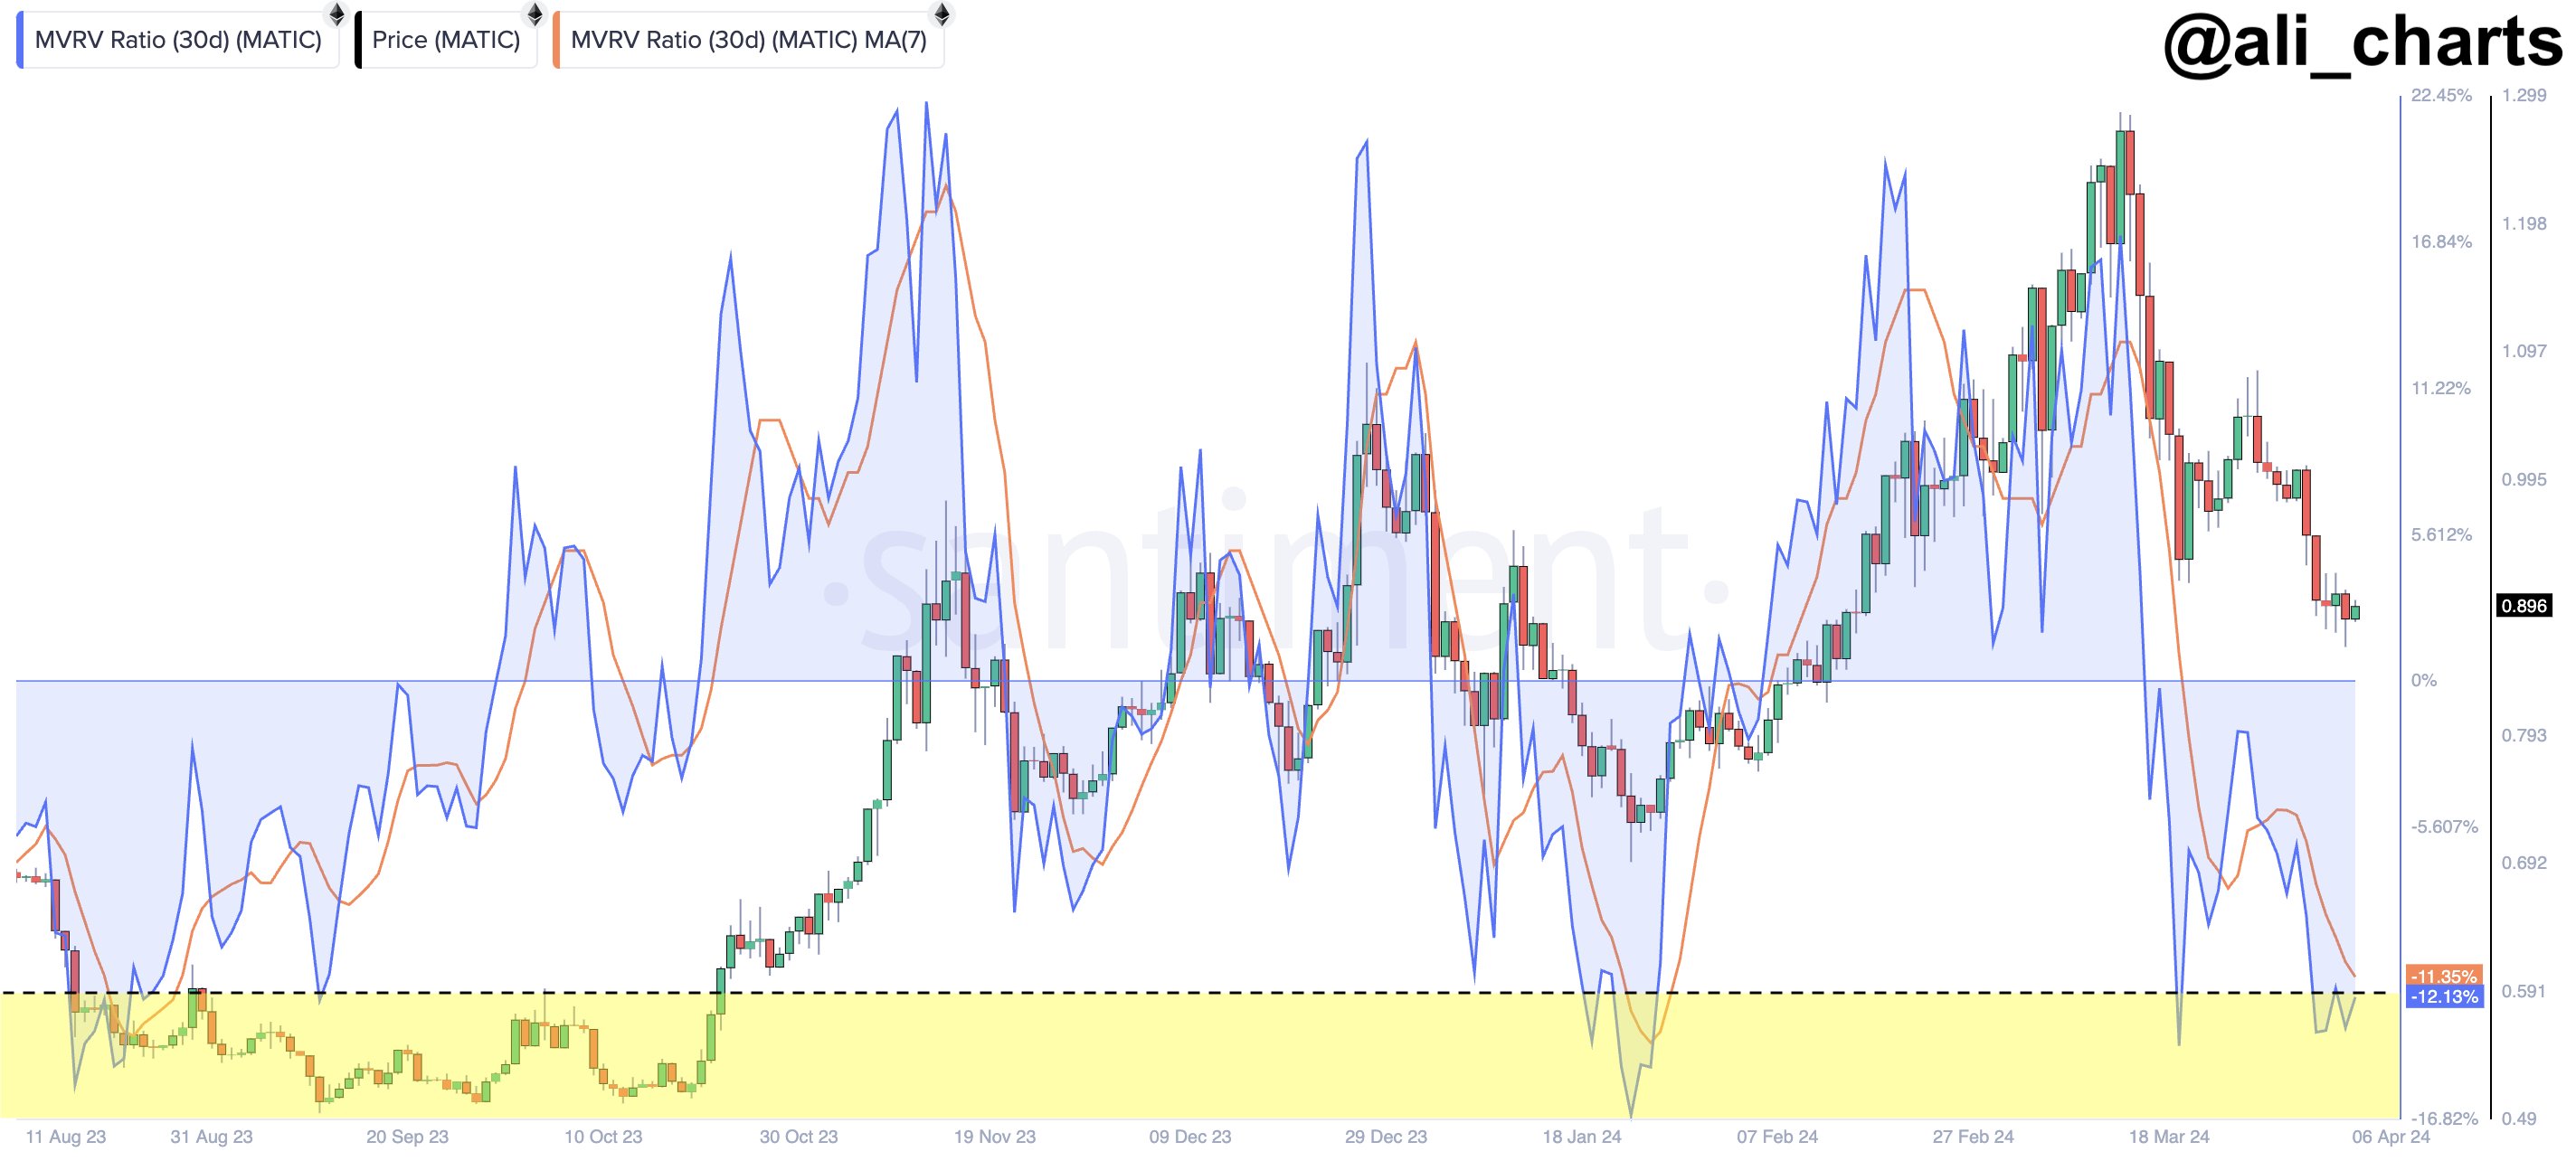
Now, here is a chart that shows the trend in the 30-day version of the Polygon MVRV ratio, which tells us about the profit-loss balance specifically for the investors who bought within the past month:

Polygon MVRV Ratio

In the graph, the 30-day MVRV ratio has been displayed in terms of a percentage, with the 0% mark aligning with the scenario where the market cap and realized cap are equal.

It’s visible that the indicator has registered some steep drawdown for Polygon recently and has dipped deep inside the negative territory. This would imply that the investors who bought within the last 30 days have entered into notable losses.

The latest levels of the metric have been low enough to qualify for a zone that has provided profitable buying opportunities in the past. “Historically, the last two entries into this zone saw MATIC surge by 112% and 87%,” notes the analyst.

A possible explanation behind this pattern could be the fact that as these 30-day investors enter into losses, the selling pressure in the market goes down as there aren’t many profit-takers left. This naturally facilitates for bottoms to take place.

It now remains to be seen whether this past pattern would repeat for Polygon this time as well, and if it does, whether any resulting surge would be of a similar scale or not.

MATIC Price

Polygon has registered a 3% surge in the past day, with its price now floating above $0.93. Given the timing, it’s possible the MVRV ratio buy signal may already be in effect.

Polygon Price Chart

Polygon Could See Bull Rally To $1.73 If This Happens: Analyst

An analyst explained that Polygon could see a potential bull rally to $1.73 if the cryptocurrency’s price is above this level.

Polygon Appears To Be Breaking Out Of A Symmetrical Triangle Currently

In a new post on X, analyst Ali talked about a multi-year Symmetrical Triangle that Polygon has been traveling inside. The “Symmetrical Triangle” is a pattern in technical analysis (TA) that, as its name already implies, looks like a triangle.

The pattern comprises two converging trendlines, with the upper line being made by joining lower highs in the price, while the lower level connects higher lows.

A feature of this pattern is that these two lines approach each other at roughly an equal (but opposite) slope. This is the reason why there is “symmetrical” in its name.

When the price trades inside the triangle, it tends to encounter resistance at the upper level. As such, tops can probably form at the line. Similarly, the lower line can act as a source of support, thus facilitating likely bottoms to take place.

If the asset breaks through either of these barriers, its price could probably see a sustained push in that direction. This means that breaks above the triangle can be bullish signals, while drops under it can signify that a bearish trajectory has taken over.

There are also other triangle patterns in TA, with two popular ones being the Ascending and Descending Triangles. These two patterns differ from the Symmetrical Triangle in that one of their trendlines is parallel to the time axis (meaning their lines can never have an equal slope).

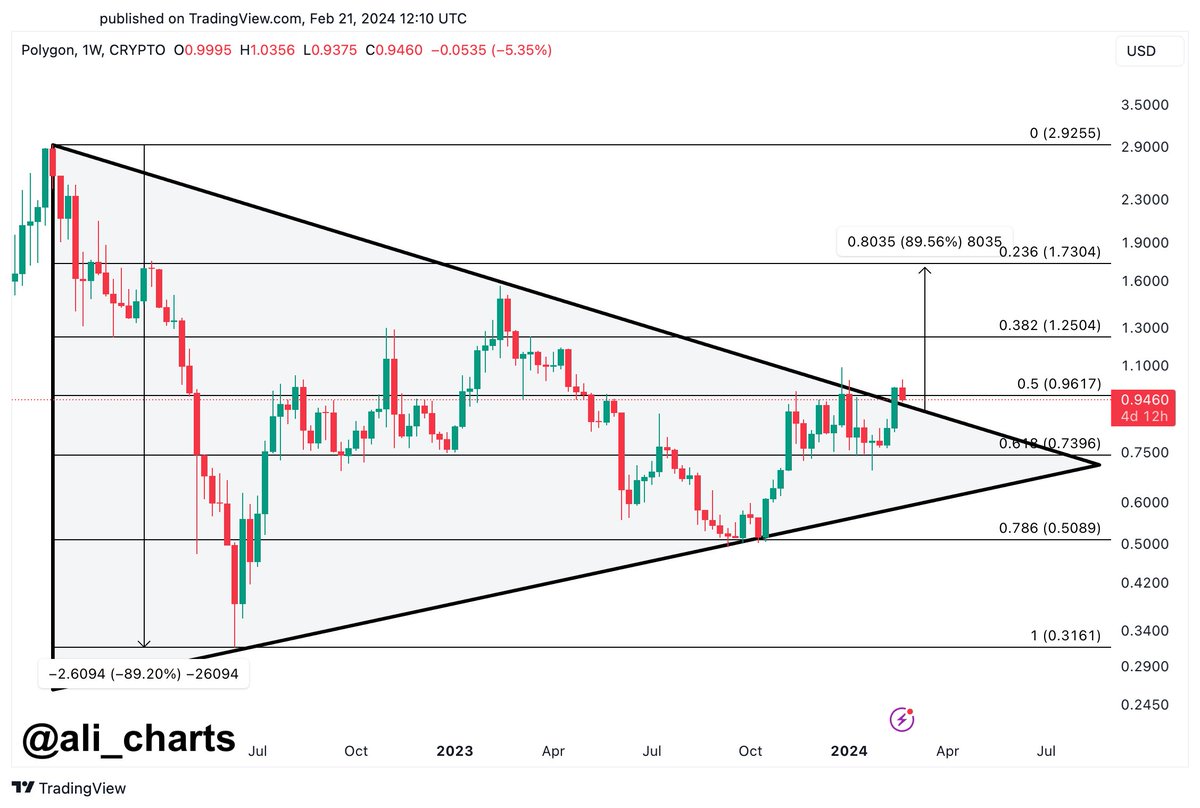
Now, here is the chart shared by Ali that shows a Symmetrical Triangle pattern that the weekly price of Polygon has traded inside for the last couple of years:

Polygon Symmetrical Triangle

As the graph shows, the Polygon weekly price has shown signs of a breakout from this Symmetrical Triangle pattern that it has been stuck inside for multiple years.

Since such breakouts have historically been bullish, this surge for MATIC could mean some sustained bullish momentum may be coming. This is only, of course, if the break truly gets confirmed.

“If MATIC can maintain a close above $0.96, it could signal the start of a bull rally, with a potential target of $1.73!” explains the analyst. From the current asset price, a run to this target would mean an increase of more than 78% for the cryptocurrency.

MATIC Price

After witnessing a break above the $1 mark, Polygon slipped yesterday as its price declined to $0.90. However, the coin has recovered above $0.97 in the past day.

This is above the $0.96 target set by the analyst, so if Polygon can continue to maintain above it now, the break might get confirmed for the asset.

Polygon Price Chart

Polygon Breaks Out Of Symmetrical Triangle, Analyst Puts This Target

An analyst has explained how Polygon is starting to break out of a symmetrical triangle pattern. If the breakout is confirmed, a rally to this level could be coming.

Polygon Weekly Price Is On The Verge Of Breaking Out Of A Symmetrical Triangle

In a new post on X, analyst Ali talked about a pattern that has been forming in the weekly price of MATIC. The pattern in question is called the “symmetrical triangle.”

As its name suggests, this technical pattern looks like a triangle. There are two main trendlines in this formation; the upper one is made by connecting a series of tops, while the lower one joins together bottoms. A feature of the pattern is that these two trendlines converge at about the same incline (which is why it has “symmetrical” in its name).

There are other triangle patterns in technical analysis as well, like the ascending and descending triangles. These patterns, for example, differ from the symmetrical triangle in that they have one trendline moving horizontally, while the symmetrical triangle has both of them at a slope.

As is generally the case with patterns like this, the upper trendline in the symmetrical triangle can act as a source of resistance, while the lower one may provide support.

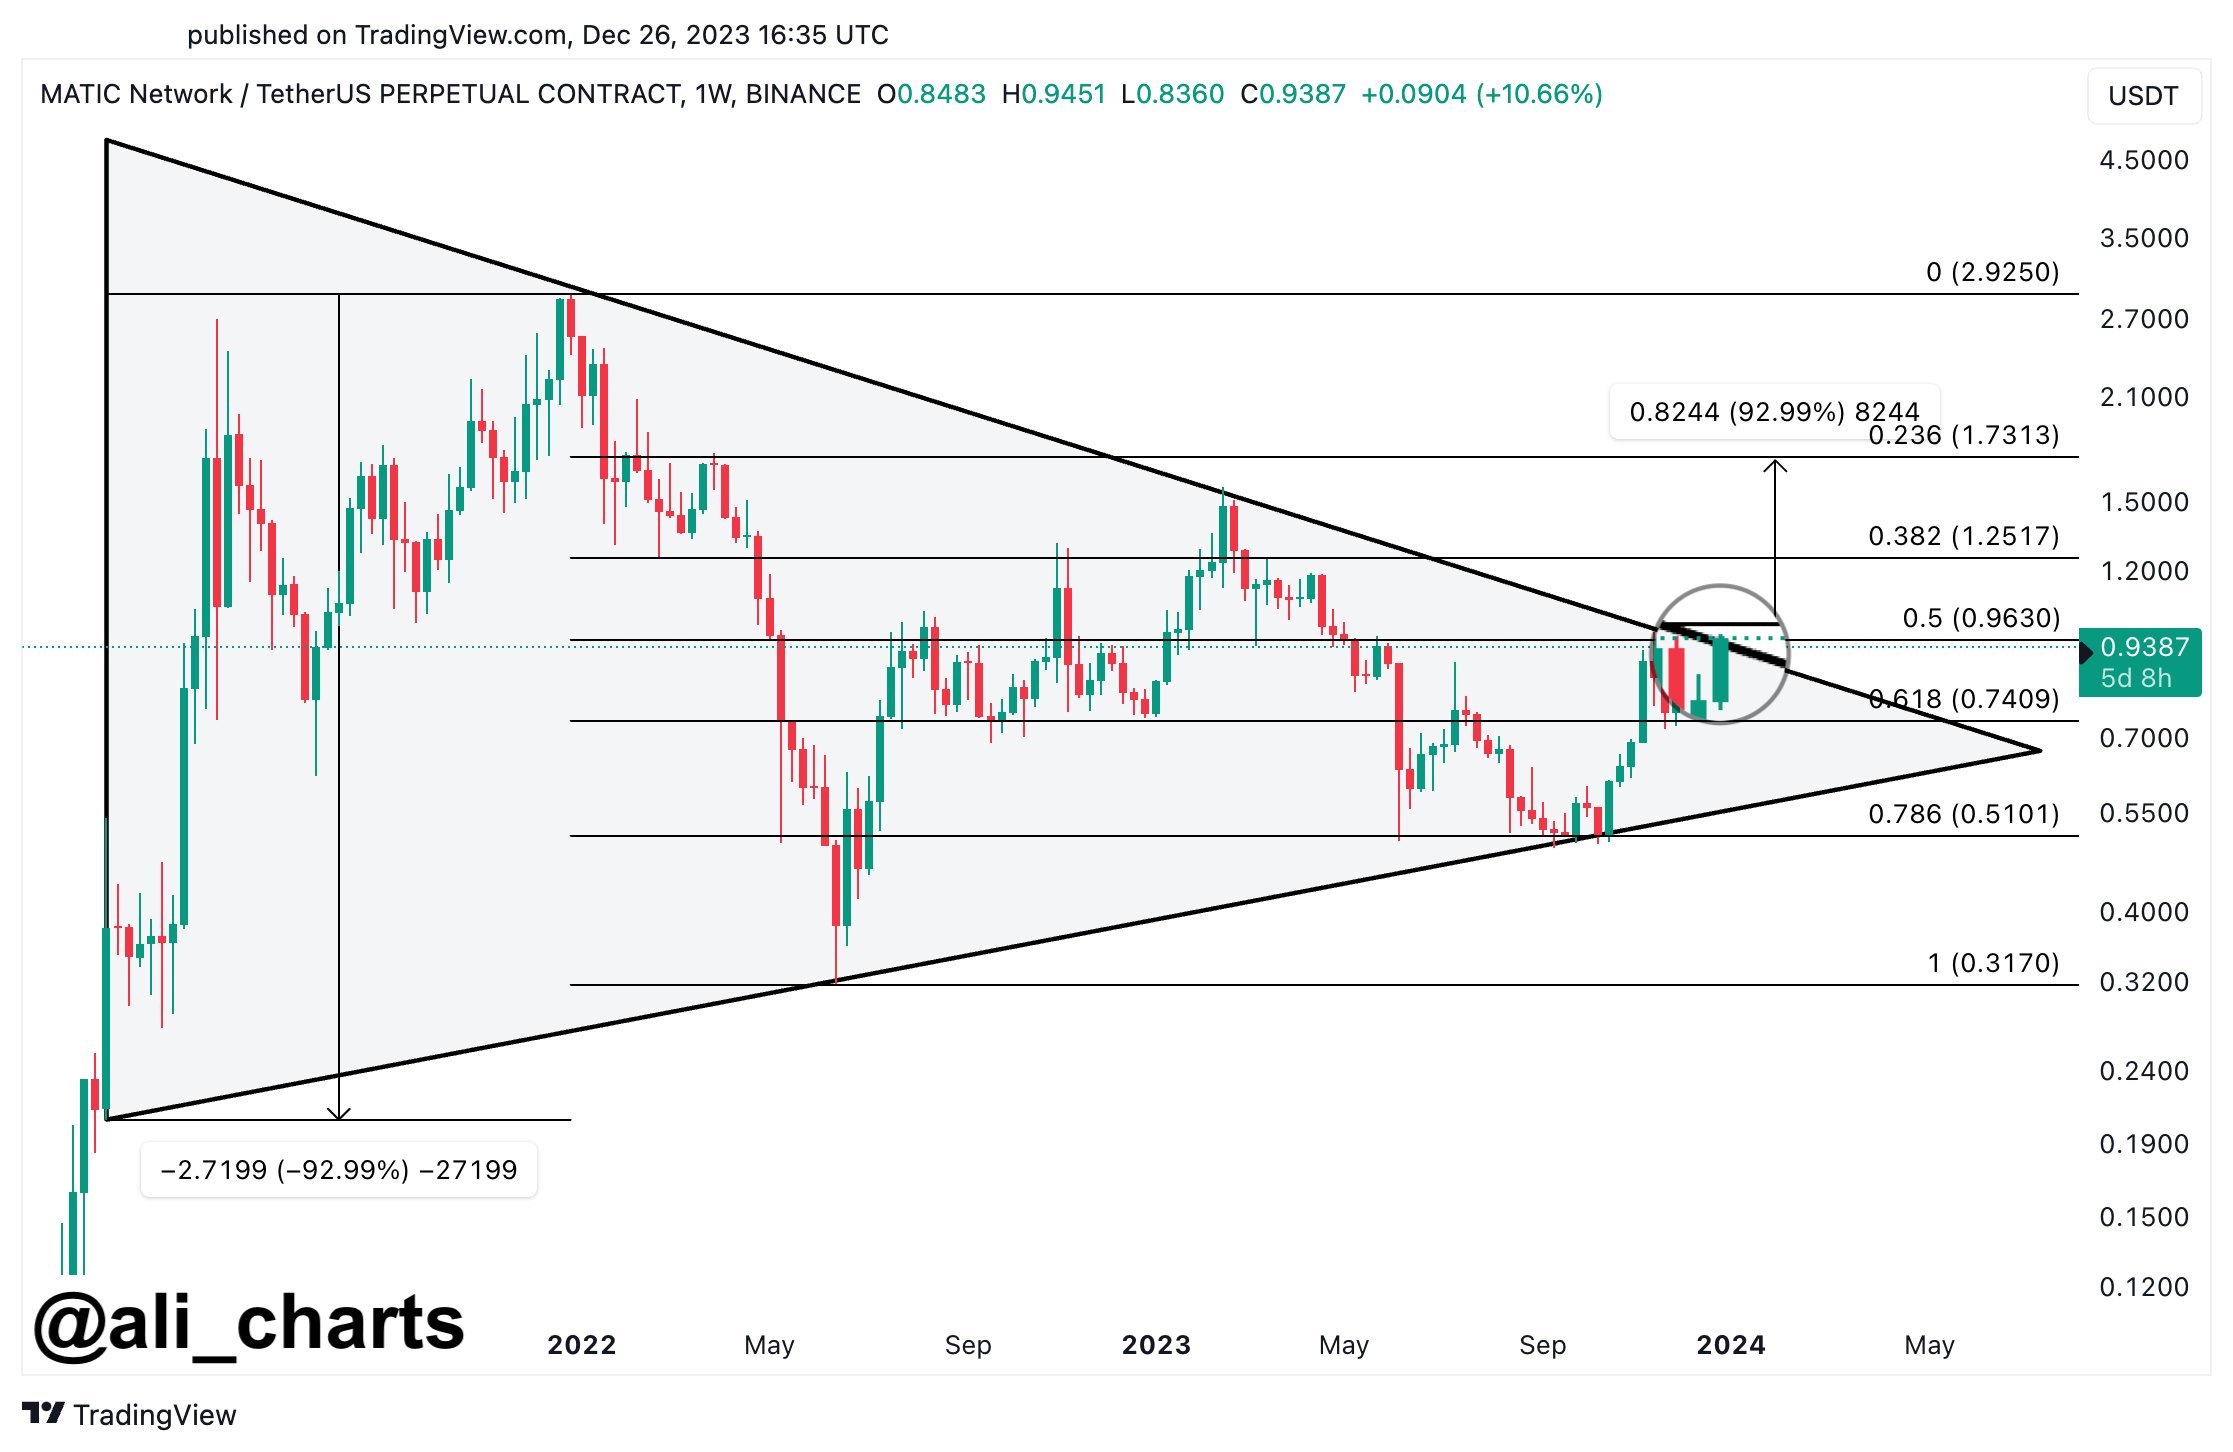
Sustained breaks out of either of these levels can lead to a continuation of the trend in that direction. According to Ali, Polygon’s weekly price has been on the verge of such a breakout recently.

Below is the chart shared by the analyst that highlights this potential break brewing in MATIC:

Image

As displayed in the above graph, Polygon’s weekly price has recently surged toward the upper trendline of a symmetrical triangle pattern and appears to be trying to break out. “A sustained weekly candlestick close above $0.96 could propel MATIC towards $1.73,” explains the analyst.

So far, Polygon seems to be well on its way to confirming this breakout, as its price has shot up more than 19% during the last 24 hours. If the symmetrical triangle break indeed holds up, then MATIC would have to rally another 66% from the current price if the target set by Ali is to be met.

MATIC Has Surpassed The $1 Level For The First Time Since April

Polygon has enjoyed some sharp bullish momentum during the past week as its price has now reclaimed $1, a level that the cryptocurrency hasn’t visited since April.

The below chart shows how the asset has performed during the past month.

Polygon Price Chart

In the past week, the asset is up over 34%. The only cryptocurrency in the market cap top 20 list that has shown better returns is Solana (SOL) with its about 47% profits.

It’s currently unknown whether MATIC can keep up this rally, but if it can, the symmetrical triangle break would be confirmed and more surge would potentially follow.

Polygon Breaks Through $0.85, Is A Move To New Highs Next?

Polygon has seen some sharp uptrend during the past day and has now broken above $0.85. Here’s why this break could pave the way for a further rally.

Polygon Has Risen By More Than 6% During The Past 24 Hours

After topping above the $0.94 mark earlier in the month, MATIC had gone on to register some significant drawdowns. In the last few days, though, the asset appears to have hit a bottom around the $0.75 level, as it hasn’t gone below the mark yet.

Something that could add further evidence for this is the fact that bullish momentum has returned for Polygon in the past day, as its price has shot up over 6%.

The below chart shows how the cryptocurrency has performed during the past month:

Polygon Price Chart

With this sharp surge, the cryptocurrency has recovered back above the $0.85 mark. This break could turn out to be significant for Polygon if on-chain data is anything to refer to.

MATIC Has Broken Past A Major Resistance Zone With The Latest Surge

In a post on X, analyst Ali discussed about how Polygon was about to face a major test of on-chain resistance. When the analyst had made the post, the coin was still trading around the $0.78 mark.

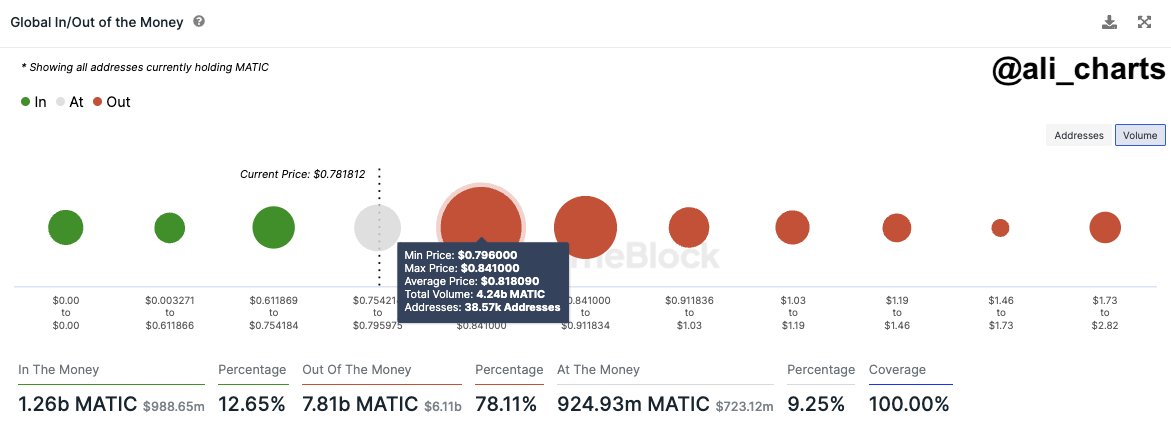
Here is a chart that shows how the on-chain support and resistance levels looked like at the time of the post:

Polygon On-Chain Resistance

In on-chain analysis, the potential of any price range to act as support or resistance depends on the number of coins that the investors purchased inside the particular range.

This is because of the fact that holders are more likely to react whenever the price retests their cost basis or acquisition price, as such a retest can flip their profit-loss condition. The more addresses that have their cost basis inside a particular range, the stronger the market reaction when the price retests said range.

From the chart, it’s visible that Polygon’s price had been trading just under the $0.79 to $0.84 range at the time Ali had made the post. This range carried the cost basis of around 38,570 addresses, which bought 4.24 billion MATIC at it.

Generally, whenever the investors are in a loss (as these holders would have been when MATIC was trading under the range), there is a chance that they sell when the price retests their cost basis since they might get desperate to exit the market and break-even would sound like a good opportunity to do so.

As a result of this, price ranges above the spot price that are dense with investors can provide resistance to the cryptocurrency. This had made the aforementioned thick $0.79 to $0.84 range important for Polygon. “For MATIC to embark on a journey to new heights, it’s crucial to break through this level with conviction,” the analyst noted in the post.

Following the latest surge, MATIC has clearly surged past this major obstacle. And as is visible in the graph, there aren’t any ranges this difficult to break anymore, either. It now remains to be seen how the Polygon price develops from here, given the lower on-chain resistance at the levels above.

Polygon Whales Go On 120 Million MATIC Buying Spree, Rally Soon?

On-chain data shows the Polygon whales have loaded up on 120 million MATIC during the past week, a sign that could be bullish for the asset’s price.

Polygon Whales Have Increased Their Holdings Recently

As pointed out by an analyst in a post on X, MATIC whales have made a decent amount of buys during the past week. The relevant indicator here is the “Supply Distribution,” which keeps track of the total amount of Polygon that the different holder groups are carrying in their wallets right now.

In the context of the current topic, the whales are the ones of interest and their group address balance range may be defined as 10 million to 100 million MATIC (which converts to about $7.7 million to $77 million at the current exchange rate).

The whales are the most powerful entities on the network, because of the sheer scale of reserves they hold. As such, their movements can often be worth keeping an eye on, as they may end up having an influence on the asset’s value.

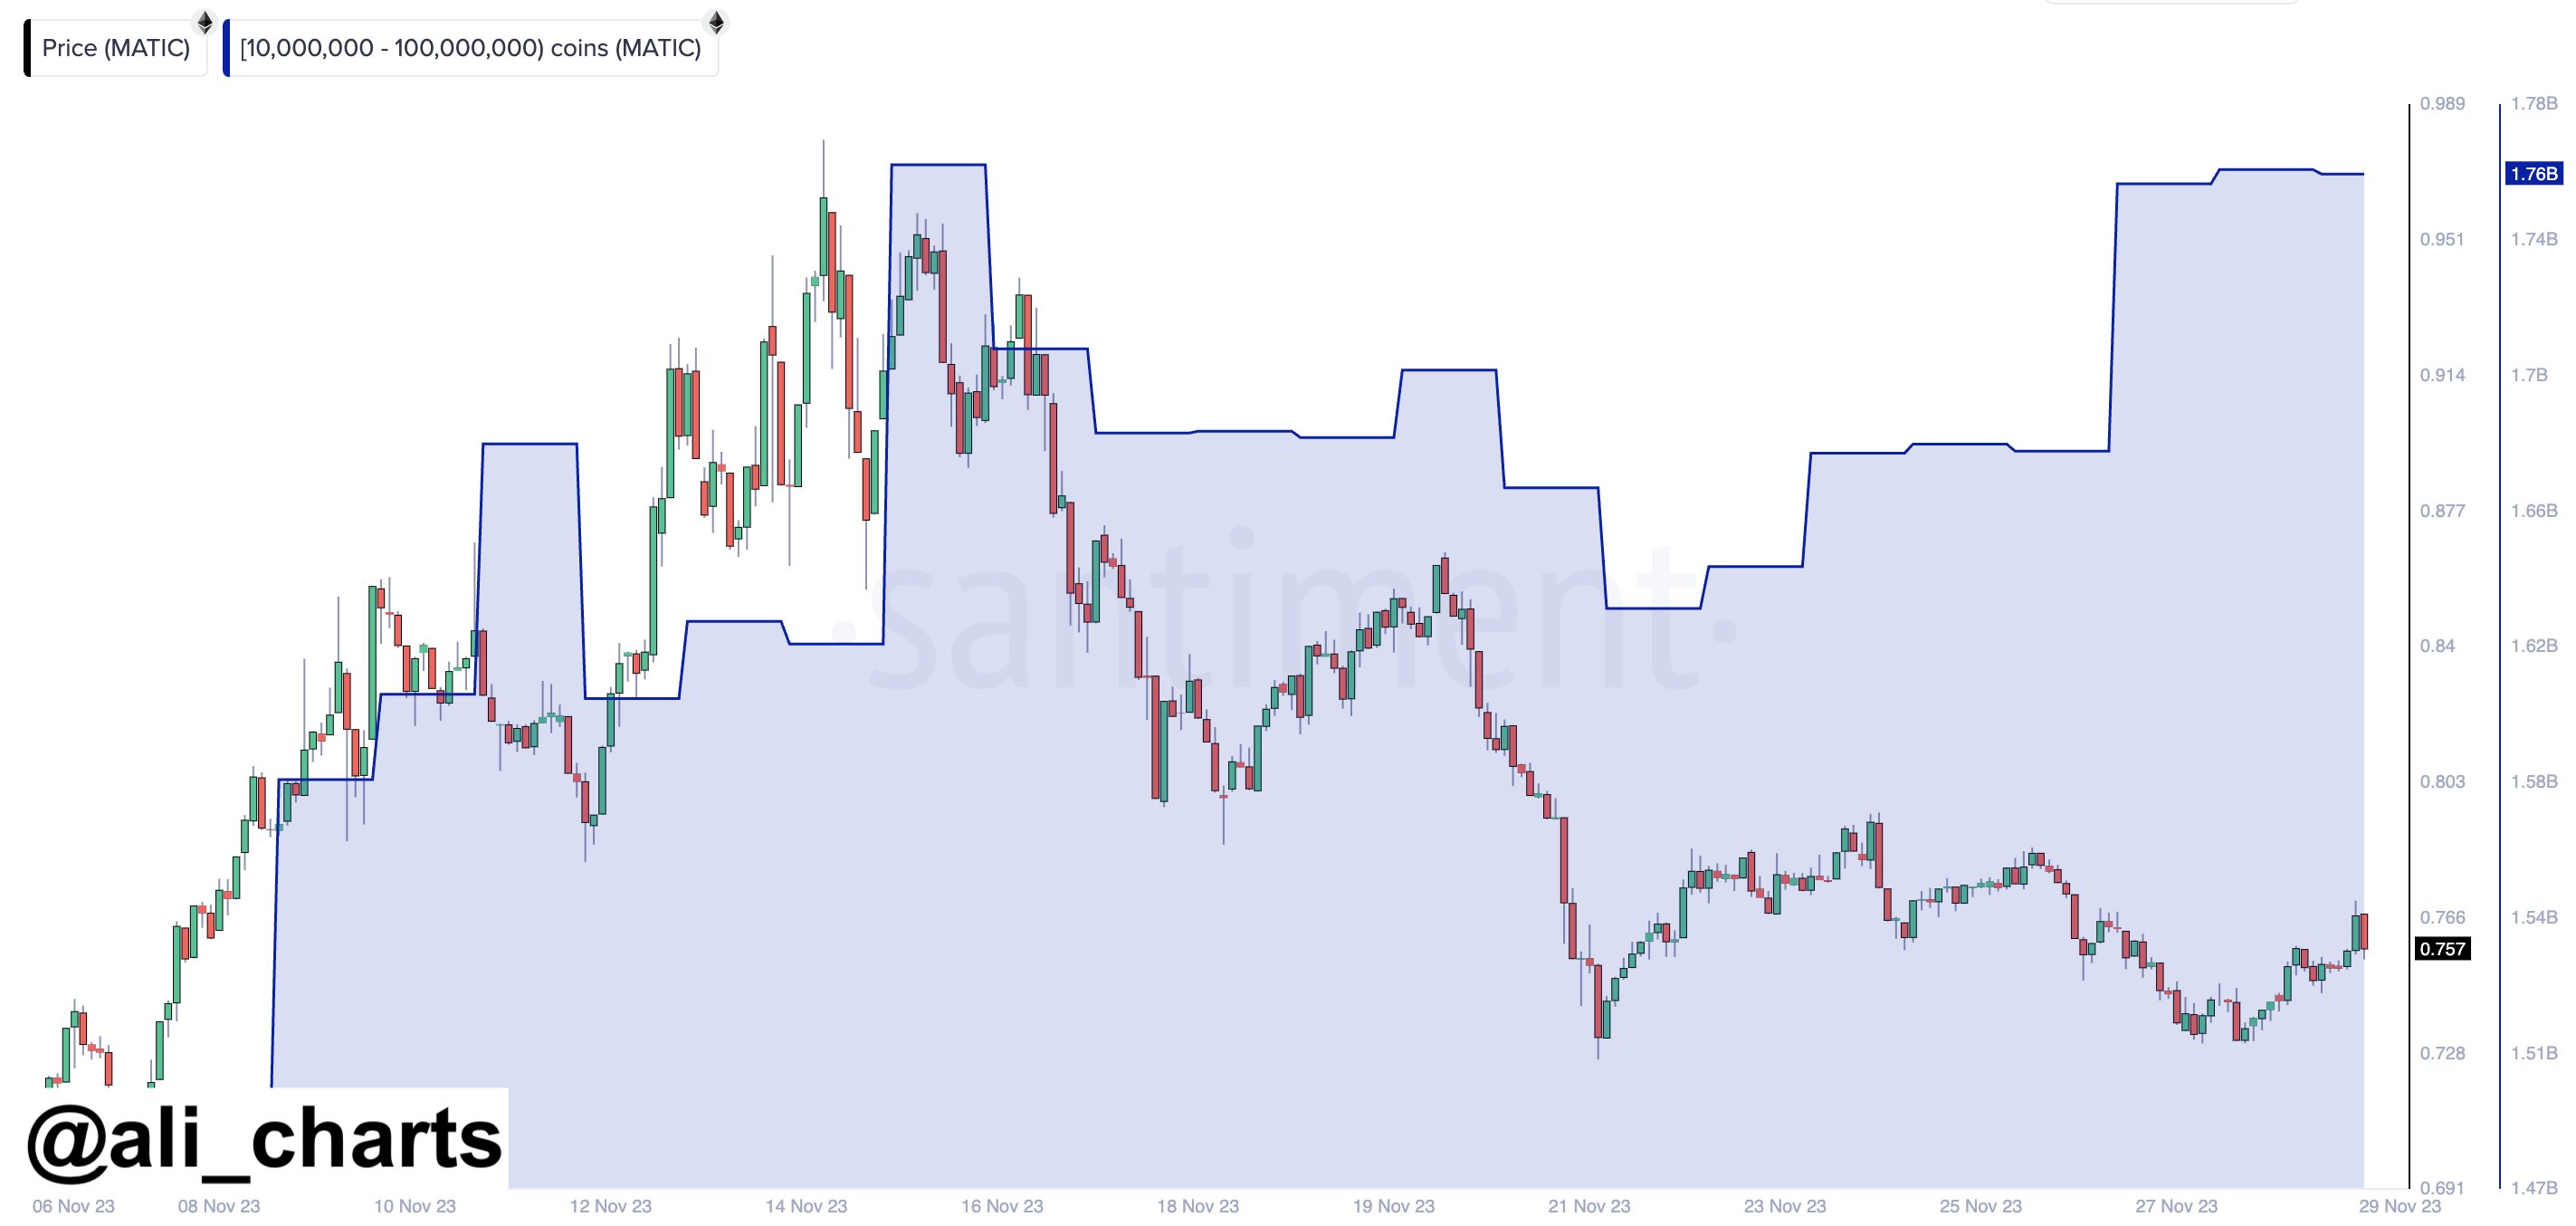
Now, here is a chart that shows the trend in the Polygon Supply Distribution specifically for these humongous holders over the past month:

Polygon Whales

As displayed in the above graph, the indicator’s value for the Polygon whales has registered a notable uplift during the past week. In total, these large investors have scooped up more than 120 million MATIC (approximately $92.5 million) in this window.

These buys from the whales have come while the cryptocurrency’s price has been trading around its lows following a sharp pullback from just under the $1 level.

Naturally, this accumulation could be a positive sign for the asset’s future, as it suggests that the whales believe the current prices are low enough to gamble more on.

While this may be so, though, another signal has also been brewing for Polygon recently and this one’s not quite as optimistic. As another analyst has explained in a CryptoQuant Quicktake post, the MATIC exchange reserve has observed a considerable rise recently, as the below chart shows.

Polygon Exchange Reserve

The “exchange reserve” here is an indicator that keeps track of the total amount of Polygon that’s currently being stored in the wallets of all centralized exchanges.

From the chart, it’s apparent that the metric started rising shortly after the recent rally in the asset took place, implying that investors began making net deposits.

One of the main reasons why investors would transfer their coins to the exchanges is for selling purposes, so it’s likely that these deposits were coming from those looking to cash in on the profit-taking opportunity.

This isn’t particularly egregious behavior, but the worrying fact may be that the exchange reserve has only continued to rise even after the asset has observed a significant downtrend from the top, meaning that the selling pressure isn’t slowing down.

The whale accumulation is a bullish sign for Polygon, but so long as these exchange inflows continue, it’s perhaps unlikely that the price would feel any benefit in the short term.

MATIC Price

Polygon is currently trading above the $0.77 mark, having seen a plunge of over 21% since the top earlier in the month.

Polygon Price Chart

Polygon (MATIC) Jumps Another 6% As Whales Show High Activity

Polygon has continued its recent bullish momentum in the past day, jumping a further 6%, as on-chain data shows the whales are highly active currently.

Polygon Is Now Up More Than 21% In The Past Week

The past month has been a great time for Polygon investors as the cryptocurrency has observed a substantial uplift. Earlier in this period, the growth had been slower, but recently the asset has really stepped up.

Here is a chart that shows how MATIC’s rally has looked over the last 30 days:

Polygon Price Chart

With the latest leg in the surge, Polygon has reclaimed the $0.80 level for the first time since July of this year. Earlier in the day, the coin had spiked to as high as $0.84, but since then it has registered a pullback towards the current price levels.

Nonetheless, even with the retrace, the asset is up a net 6% during the last 24 hours. As it stands, MATIC’s profits of 21% in the past week are among the best in the sector, with only Chainlink (LINK) showing a better performance inside the top 20 assets by market cap.

It would appear that the whales may be playing a major role in this latest rally if on-chain data is anything to refer to.

Polygon Whale Transaction Count Is At Elevated Levels Currently

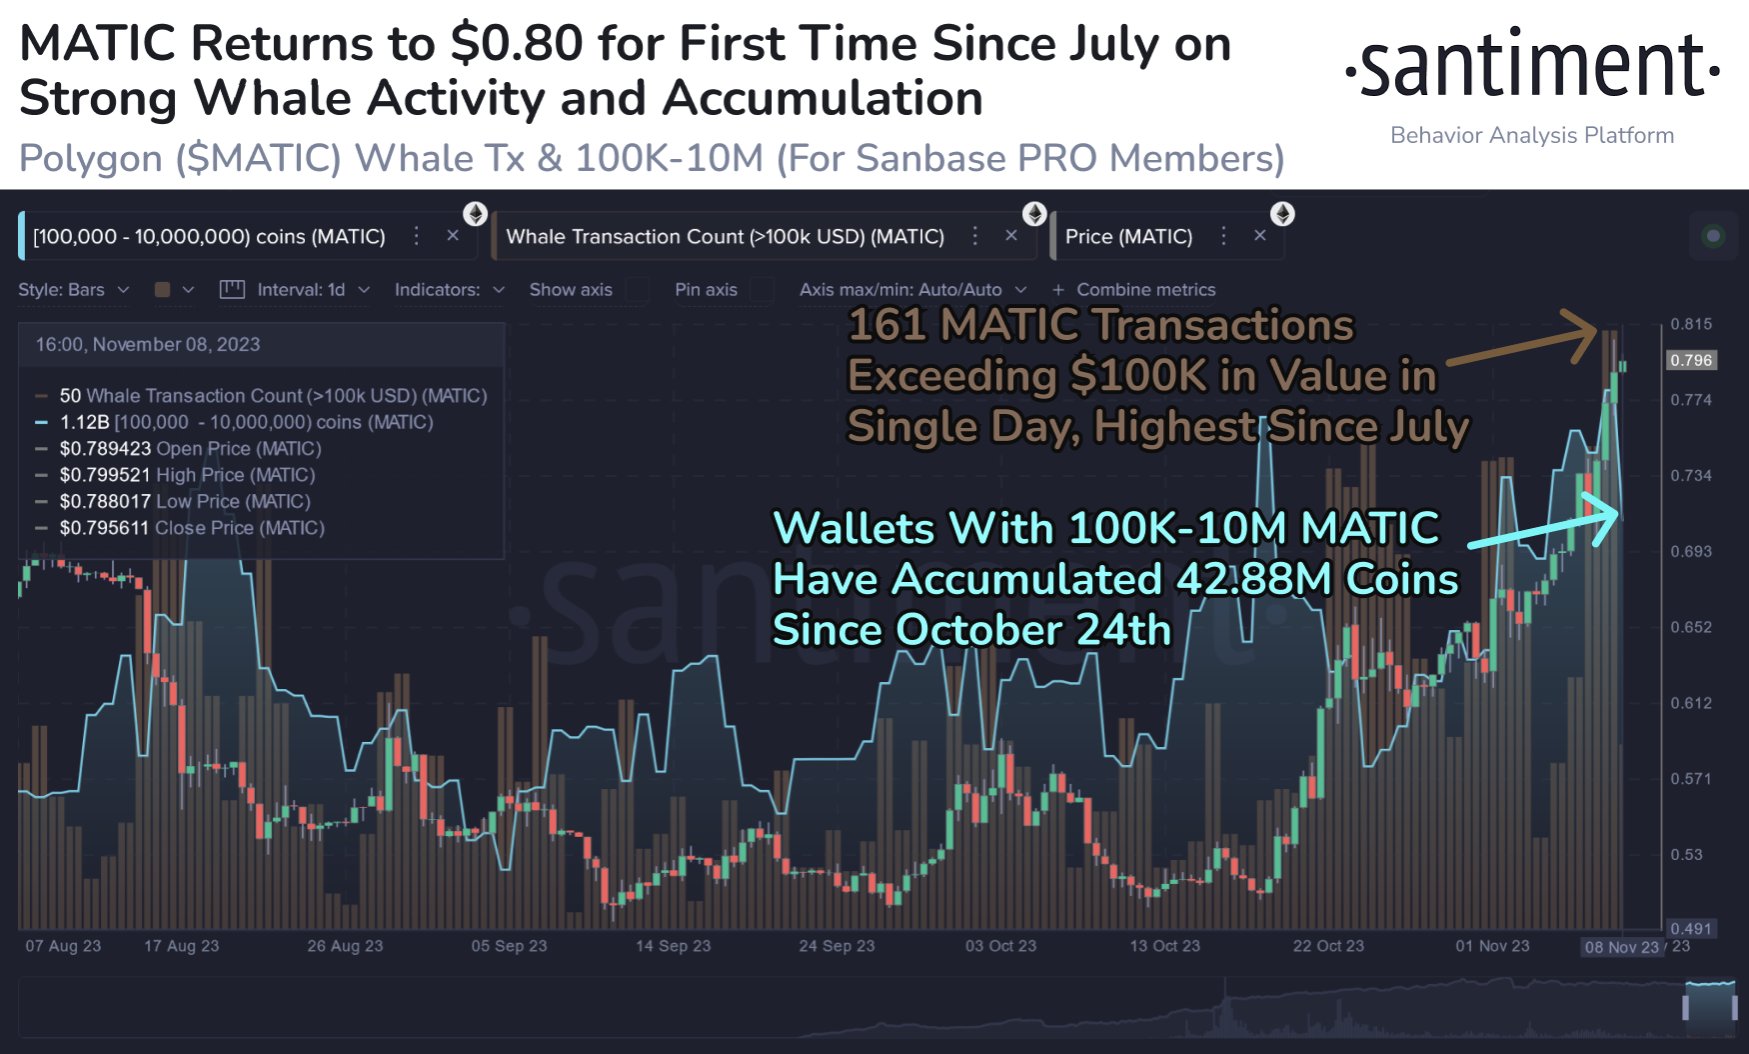
As pointed out by the on-chain analytics firm Santiment, whales have been quite active in the market recently. The relevant indicator here is the “whale transaction count,” which keeps track of the total number of Polygon transactions that are carrying at least $100,000 in value.

The below chart shows the trend in this MATIC metric over the past few months:

Polygon Whale Activity

As displayed in the above graph, the Polygon whale transaction count has been at high levels recently. To be more particular, the whales have been making more than 161 transactions per day, which is the highest the metric has been since July.

Generally, high activity from the whales can be a predictor of volatility, as a large number of moves of these humongous holders together can have the power to move the market.

Naturally, such volatility can take the cryptocurrency in either direction, as the whale transaction count metric merely tells us about the number of transfers that the whales are making, and not whether these are buying or selling transactions.

In the chart, Santiment has also attached the data for another metric: the combined supply held by the 100,000 to 10 million MATIC addresses. As is visible in the graph, the sharks and whales have been accumulating since 24th October, suggesting that their buying may have been providing support to the rally.

The supply of these key holders may be one to watch for in the coming days, especially given the high transaction activity that the whales in particular are making currently. If the indicator observes a significant drawdown, then it would be a sign that the group has decided to take their profits.