Stablecoin Exchange Inflows Plummet $61 Billion—Warning Sign for Bitcoin?

On-chain data shows the exchange inflows related to the stablecoins USDT and USDC have seen a sharp plunge. Here’s what this could mean for Bitcoin and other cryptocurrencies.

Stablecoin Exchange Inflows Have Dropped Below Yearly Average

In a new post on X, CryptoQuant author Axel Adler Jr has discussed about the latest trend in the Exchange Inflow of the top two stablecoins in the sector, USDT and USDC.

The “Exchange Inflow” refers to an on-chain indicator that keeps track of the total amount of a given asset that’s moving into the wallets associated with centralized exchanges.

Generally, investors may deposit their coins into these platforms when they want to trade them away, so a high value on the Exchange Inflow can indicate demand for swapping the cryptocurrency. For volatile assets like Bitcoin, this is something that can naturally be bearish for the price.

In the case of stablecoins, however, their price doesn’t see any impact from exchange deposits, since it always remains, by definition, stable around whatever fiat currency the asset is tracking.

That said, stablecoin inflows aren’t without consequence. Investors usually deposit these assets to swap into a volatile cryptocurrency of their choice. As such, coins like Bitcoin can see a bullish effect from an Exchange Inflow spike related to these fiat-tied tokens.

Now, here is a chart that shows the trend in the combined Exchange Inflow of the top two stablecoins, USDT and USDC, over the past few years:

Stablecoins Exchange Inflow Vs Bitcoin Price

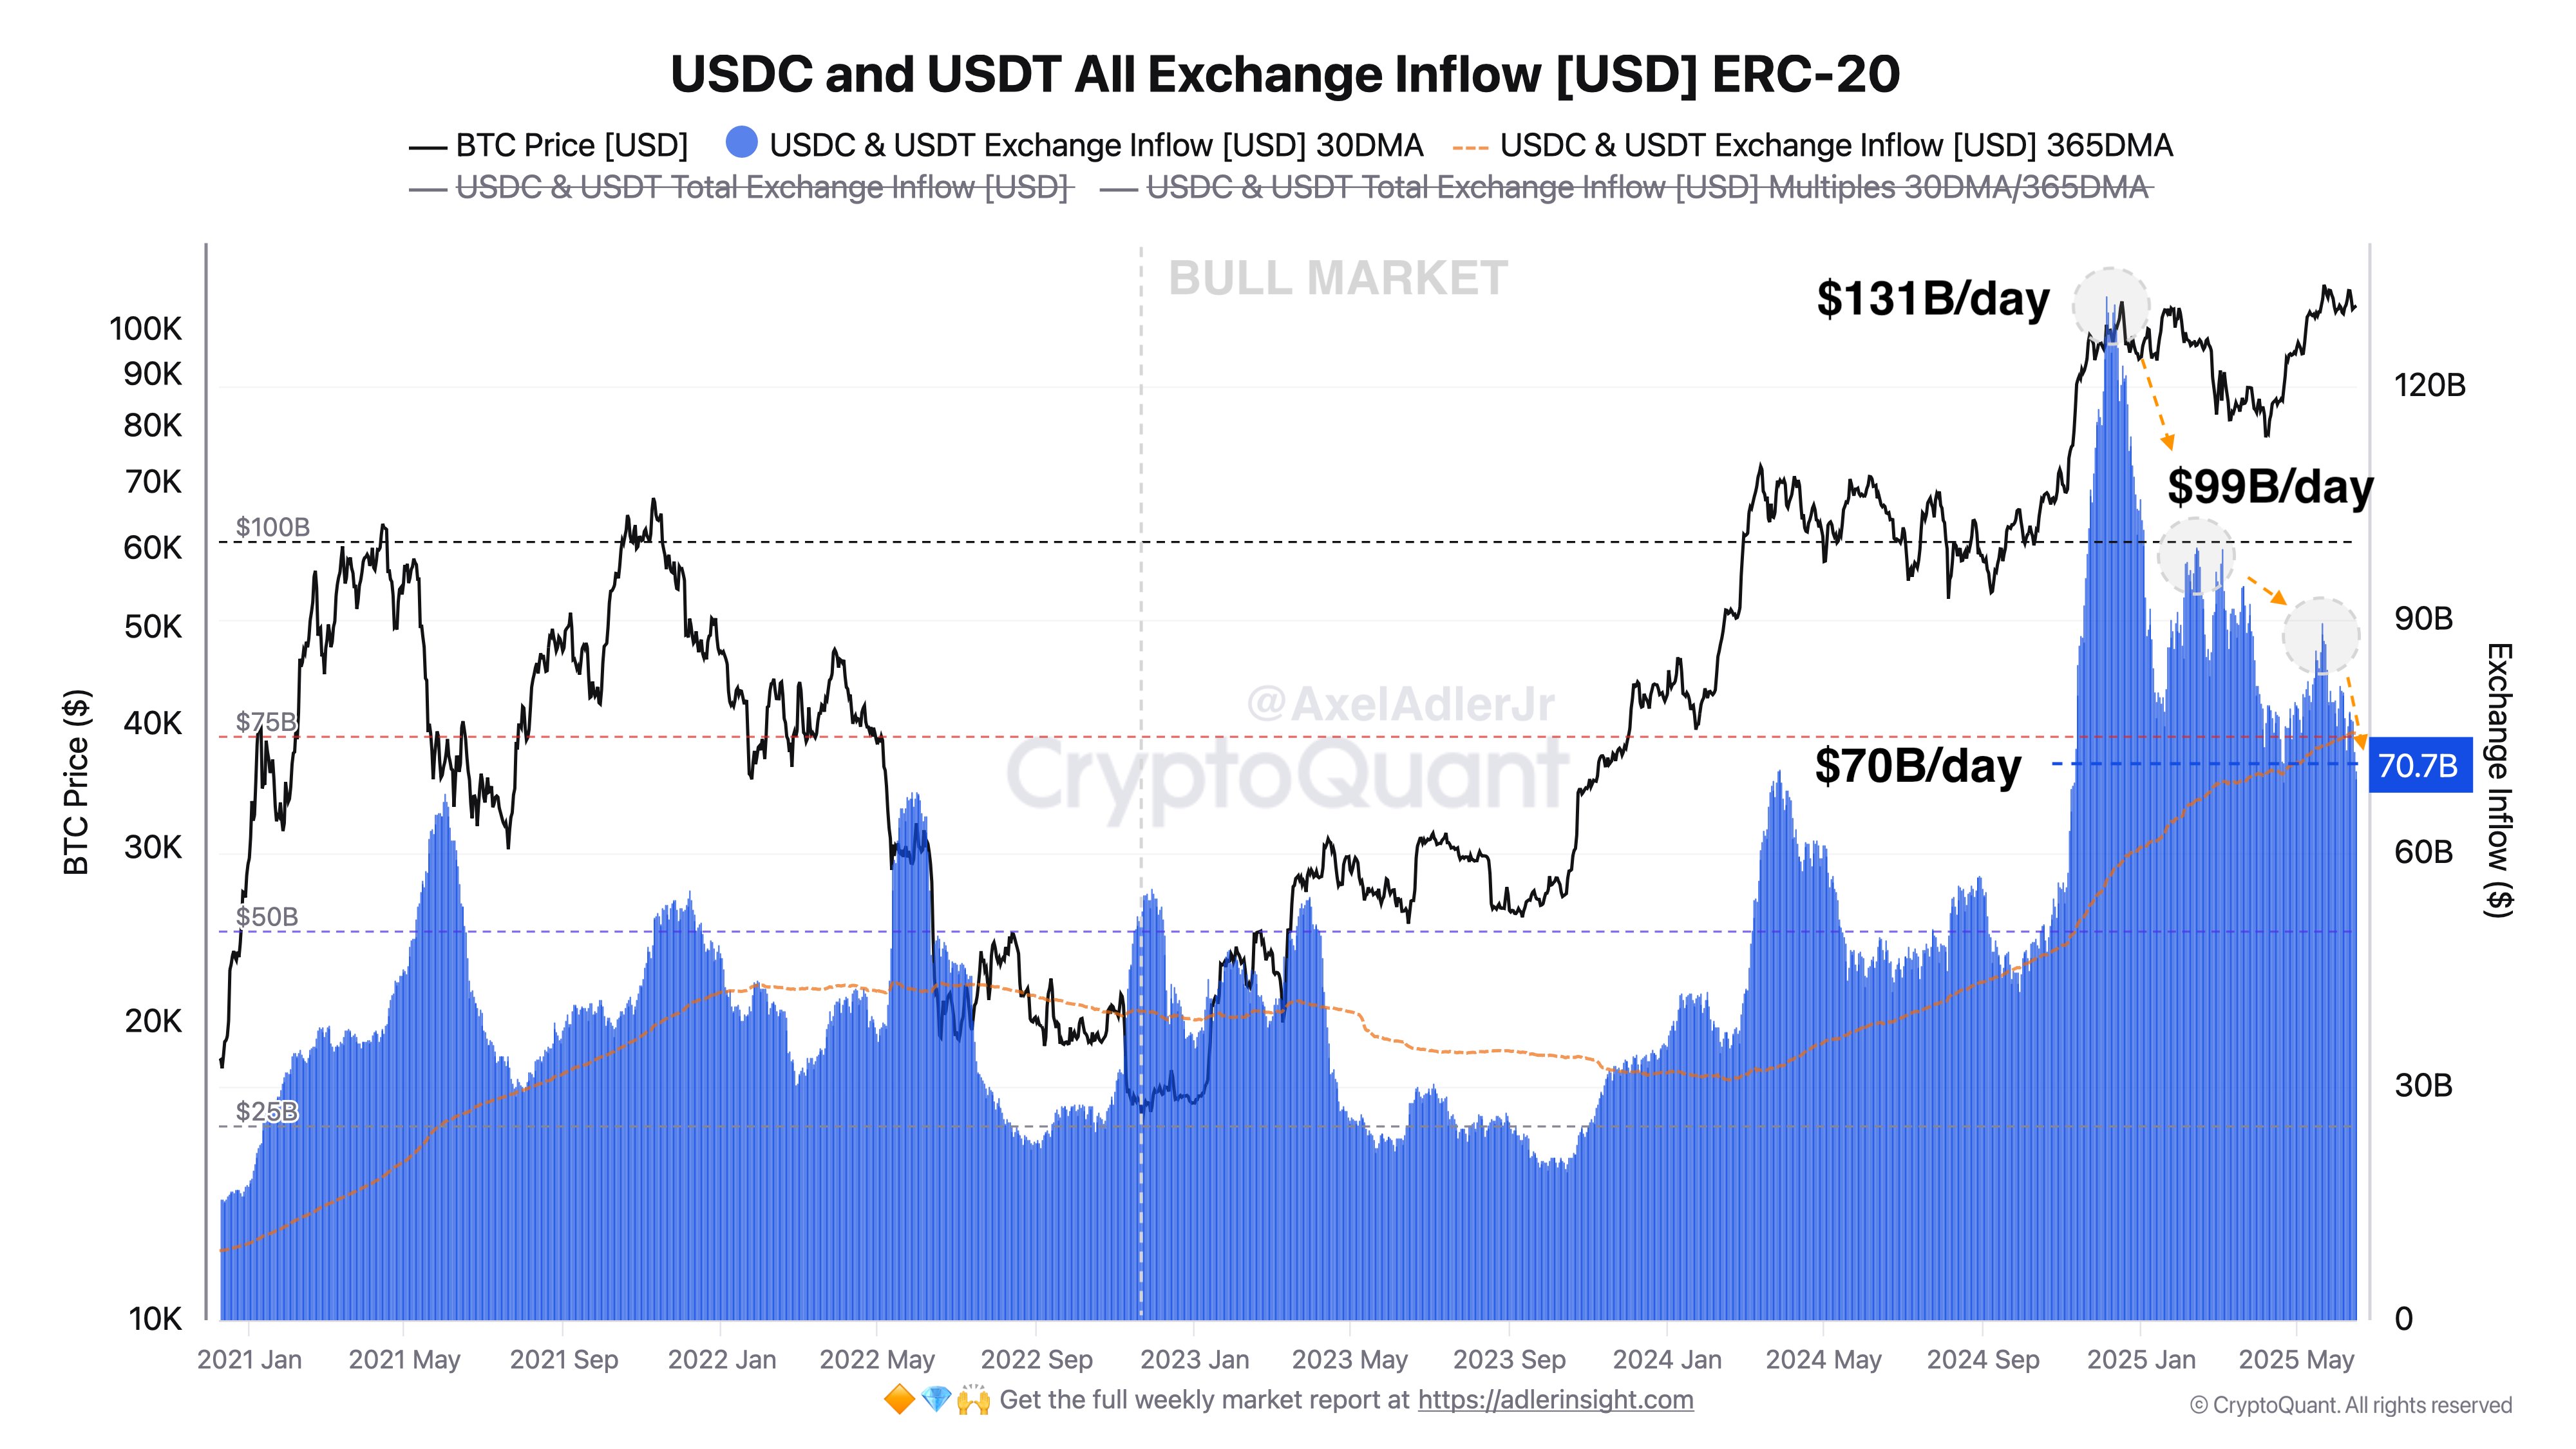
As displayed in the above graph, the Exchange Inflow of USDT and USDC shot up to a very high value at the end of last year, a sign that the investors were making massive deposits of these stablecoins.

Alongside the spike in the indicator, the Bitcoin price observed a rally to a new all-time high (ATH), a potential sign that the stablecoin inflows may have helped provide the fuel for the run.

At the peak of the spike, the metric reached a value of $131 billion per day. From the chart, it’s apparent that since then, the indicator has been following a downward trajectory and today, its value has come down to $70 billion per day.

This represents a significant decline of $61 billion since the high. Though, while the indicator is indeed notably down compared to the peak, its current level is still high in the context of the wider cycle so far.

Naturally, if this drawdown in the stablecoin Exchange Inflow keeps up, it could potentially turn out to be a bearish sign for Bitcoin and other digital assets. That said, even though BTC went down earlier in the year, its price is still above the $100,000 mark right now, a possible sign that investors may simply be entering a phase of consolidation.

Bitcoin Price

Following a surge of about 2.5% over the last 24 hours, Bitcoin has managed to recover back to the $108,100 level.

Bitcoin Price Chart

Stablecoins See Positive Momentum: Will This Lead To New Bitcoin All-Time High?

Data shows the stablecoins USDT and USDC have been seeing capital inflows recently, something that could turn out to be bullish for Bitcoin.

Top 2 Stablecoins Have Seen Their Market Caps Grow Recently

In a new post on X, the on-chain analytics firm Santiment has discussed about the latest trend in the market caps of the top two stablecoins: USDT and USDC. Below is the chart shared by the analytics firm, that shows the data for the 30-day change in the market caps of the two cryptocurrencies.

Stablecoin Market Cap

As is visible in the graph, the 30-day percentage change in the market cap of USDC has spiked to sharp positive levels recently, implying that the stablecoin has been growing at a rapid rate.

Unlike USDC, which has seen sustainable growth for the last few months, USDT kicked off the year 2025 with its 30-day market cap change dipping into the negative territory. Since bottoming at around -2% earlier in the month, though, momentum has returned for the asset as the indicator has just turned back green.

This means that at present, both of the two stablecoin giants are enjoying an increase in their market caps. Historically, growth in these fiat-tied tokens is something that has been bullish for Bitcoin and other volatile cryptocurrencies.

The reason behind this is the fact that investors who store their capital in the form of stablecoins generally plan to invest into the volatile side of the market eventually. When they buy BTC with their stables, its price naturally receives a positive effect.

The most bullish scenario for the sector occurs when both Bitcoin and the stablecoins witness a rise in their market caps. Such a setup implies both sides of the market are getting net capital inflows. When only one rises while the other goes down, it means capital is merely seeing a rotation between the two.

The recent inflows into USDT and USDC have come while BTC has been consolidating sideways. This suggests the capital entering into the stables is fresh, as BTC would have gone down if it was otherwise. At the same time, BTC itself isn’t seeing any direct inflows, hence the flat price action.

Usually, stablecoin holders deposit to centralized exchanges when they want to purchase the volatile cryptocurrencies. Thus, the number of stable deposits into these platforms can tell us about whether large-scaling buying of this type is happening or not.

An analyst has shared the data for the metric in a CryptoQuant Quicktake post.

Bitcoin Exchange Depositing Transactions

From the above chart, it’s apparent that the indicator is following a flat trajectory right now. An increase in it, like the one witnessed earlier, may provide fuel for a further rally for Bitcoin.

Bitcoin Price

At the time of writing, Bitcoin is floating around $104,800, down 1% in the last week.

Bitcoin Price Chart

Bitcoin To Smash $100,000? Rapid Stablecoin Exchange Inflows Continue

On-chain data shows exchanges have continued to receive stablecoin deposits recently, a sign that could be bullish for Bitcoin and other digital assets.

Stablecoin Exchange Netflow Has Remained Positive Recently

As pointed out by an analyst in a CryptoQuant Quicktake post, stablecoins have been flowing into exchanges recently. The on-chain metric of relevance here is the “Exchange Netflow,” which keeps track of the net amount of a given asset that’s moving into or out of the wallets associated with centralized platforms.

When the value of this metric is positive, it means the investors are making net deposits of the coin to exchanges. Such a trend suggests the holders want to trade the asset away.

On the other hand, the indicator being negative implies investors prefer to hold onto the cryptocurrency, as they are taking their tokens off into self-custody. The implication of these trends for the wider sector and the asset itself can be different depending on the exact type of coin that’s witnessing the outflows/inflows.

In the case of volatile assets like Bitcoin, a positive Netflow can be bearish for the price, as it means the holders are looking to sell. BTC also acts as one of the main transition points for capital in the sector as a whole, so it being sold can be a bad sign for the rest of the coins as well.

Stablecoin deposits also imply traders want to sell them, but since their price always remains stable around the $1 mark, the selling has no ‘bearish’ effect on them.

Like Bitcoin, the stablecoins act as a gateway for capital into the sector. More particularly, investors invest their money into the stables whenever they want to avoid the volatility associated with other assets.

Such holders usually eventually plan to delve into the volatile coins, and once they are ready, they transfer these fiat-tied tokens into exchanges to make the swap. This naturally acts as buying pressure for whatever asset that they are shifting to. As such, positive stablecoin Exchange Netflows are considered bullish for Bitcoin.

Now, here is the chart shared by the quant that shows the recent trend in the Exchange Netflow for the stablecoins:

Bitcoin Vs Stablecoin Exchange Netflow

From the graph, it’s visible that the stablecoin exchange netflow has mostly been sitting inside the positive territory for the last few weeks. Alongside these inflows, Bitcoin has been breaking record after record, so it’s likely that these stablecoin deposits have been acting as fuel for the asset.

The indicator’s value has continued to show strength recently, so it seems the investors aren’t done with their BTC accumulation yet. If the earlier trend continues, the latest stablecoin inflows can elongate the rally and perhaps help the asset to finally break through the $100,000 dream target.

Bitcoin Price

Bitcoin had seen a plunge under the $96,000 level yesterday, but it appears the coin has already bounced back as its price is now trading around $98,400.

Bitcoin Price Chart

Is Another Bitcoin Rally Coming Soon? This Pattern May Say So

On-chain data shows a pattern in the stablecoin shark and whale holdings that may suggest the Bitcoin rally could make a return in the near future.

Stablecoin Sharks & Whales Have Been Accumulating Recently

According to data from the on-chain analytics firm Santiment, the sharks and whales of the major stablecoins have been increasing their reserves while Bitcoin has been struggling recently.

The “sharks” and “whales” are two of the largest cohorts in the sector, with investors belonging to the former holding at least $100,000 and at most $1 million worth of the asset, while the latter has wallet balances in the $1 million to $10 million range.

Due to such large holdings, these investors can potentially move around a large number of coins at once, something that can make them influential entities in the market.

In the context of the current discussion, the sharks and whales of stablecoins are of interest. In particular, the four largest players in the market are of relevance here: Tether (USDT), USD Coin (USDC), Binance USD (BUSD), and Dai (DAI).

Santiment has used its “Supply Distribution” metric to track the holdings of these humongous holders and this indicator tells us about the percentage of the supply that each group in the market is holding right now.

Here is a chart that shows the trend in this metric specifically for the sharks and whales of the top 4 stablecoins in the sector:

Stablecoin Sharks & Whales

As displayed in the above graph, the holdings of these stablecoin sharks and whales have been on the rise recently. Interestingly, while this trend has formed, the price of Bitcoin has dipped below the $30,000 level.

A similar pattern in the supply held by these large investors had also formed last month, as these investors had been buying more stablecoins, while BTC had been on a decline.

What followed this period of accumulation back then was a sharp Bitcoin rally that had taken the cryptocurrency’s price above the $30,000 level.

An explanation of this curious trend may lie in what the holdings of these large stablecoin holders signify. Generally, these investors opt for stables whenever they want to exit volatile assets such as BTC.

Such holders, however, usually only seek to temporarily take shelter in these dollar-tied tokens, because if they wanted to stay away from the sector for extended periods, they would have exited through other means like fiat.

Thus, these investors would eventually shift their stablecoins into Bitcoin and others again, and with this exchange, provide a bullish boost to their prices. This is why the supply of these sharks and whales may be looked at as the available buying pressure that these humongous investors can put on the asset at any point they want.

From the chart, it’s visible that the BTC rally above $30,000 didn’t actually kick off from new money being pumped back into the asset by the sharks and whales, but rather the conversions that they made back into the asset, as their holdings decreased while the rally happened.

As the large investors of the major stables have again been accumulating recently, it’s possible that Bitcoin could see a bullish effect from this down the road once more, although it’s uncertain how long it may be before these investors deploy their stablecoins back into the market.

Bitcoin Price

At the time of writing, Bitcoin is trading around $29,300, up 1% in the last week.

Bitcoin Price Chart

Sharks & Whales Accumulate Stablecoins, Why This Could Be Bullish For Bitcoin

Data shows the sharks and whales of the largest stablecoins have been accumulating, something that may turn out to be bullish for Bitcoin.

Sharks & Whales Have Been Loading Up On Stablecoins Recently

According to data from the on-chain analytics firm Santiment, the sharks and whales have recently improved their share of the total supply of stablecoins like USD Coin (USDC), Dai (DAI), and Binance USD (BUSD).

The relevant indicator here is the “Supply Distribution,” which tells us what percentage of a cryptocurrency’s total circulating supply is being held by which wallet group in the market.

Addresses are divided into these “wallet groups” based on the total number of tokens that they are holding at the moment. In the context of the current discussion, the 100,000 to 10 million coins cohort is of interest.

This group naturally includes the wallets of all the investors who are carrying a balance of at least 100,000 and at most 10 million tokens. As the assets in question here are USD-pegged stablecoins (meaning that their value is fixed at $1), the bounds of this range convert to $100,000 and $10 million, respectively.

As these amounts are massive, only the largest of the investors in the market would be sitting on these addresses. The sharks and whales are two such cohorts that are large enough to cover these wallets.

These groups can be quite influential in the market, as they have the power to move a notable amount of coins at once. Obviously, the whales would be the more important group of the two, as they are the larger cohort.

Now, here is a chart that shows the trend in the Supply Distribution of these sharks and whales for three of the most popular stablecoins in the sector:

Stablecoins Sharks & Whales

As displayed in the above graph, the supplies of these three stablecoins hit a low back in March, but have since then observed an increase. This means that sharks and whales of the respective tokens have been accumulating during this period.

Generally, investors use stables whenever they want to avoid the volatility associated with other assets like Bitcoin. So, sharks and whales picking up these coins can be a sign that they have been exiting the other assets recently.

Eventually, however, such investors who have taken safe haven in stablecoins may exchange these tokens back for the volatile coins, once they feel that prices are right to jump in.

Whenever these holders swap their stables, the prices of the assets that they are shifting into can naturally observe a buying pressure. This implies that the currently piled-up stablecoin supplies of the sharks and whales can be looked at as the potential dry powder that may be deployed into assets like Bitcoin.

In the last couple of weeks, the USDC, DAI, and BUSD supplies of these humongous holders have flatlined, meaning that they may have slowed down their exit from the volatile coins. If the trend now reverses and they start scooping up the other cryptocurrencies with their stables, BTC could possibly feel a bullish effect.

BTC Price

At the time of writing, Bitcoin is trading around $26,700, down 1% in the last week.

Bitcoin Price Chart

Stablecoins Interest Spikes As Traders Look To Exit Market

Data shows there has been a large spike in interest around stablecoins recently, a sign that investors of Bitcoin and other assets may be looking to exit.

Stablecoins Have Observed A Sharp Rise In Social Volume Recently

According to data from the on-chain analytics firm Santiment, there has been a major uptick in the social volume of the stablecoins recently. The “social volume” refers to an indicator that measures the total number of social media text documents that are talking about a certain topic or term.

The social media text documents here have been collected by Santiment and include a variety of sources like Reddit, Twitter, Telegram, and other internet forums.

Something to note about the metric is that it only tells us about the unique number of such posts that are mentioning the given term at least once. This means that even if a thread includes several mentions of the topic, its contribution towards the social volume will still remain only one unit.

The social volume can provide insight into the degree of attention any particular coin is getting on social media platforms. Whenever this indicator’s value goes up, it means that the general interest in the asset among investors is rising currently.

Now, here is a chart that shows the 7-day change in the social volume for the various assets in the cryptocurrency sector (including the stablecoins):

Stablecoin and Bitcoin Social Volume

As displayed in the above graph, the social volume of a lot of the volatile assets has registered a negative 7-day change, implying that there is a lesser amount of discussion happening related to them right now as compared to a week ago.

Some of the assets like Bitcoin have seen a positive 7-day change in the metric, but the increase has only been minuscule for them, implying that their social volume is relatively unchanged.

Interestingly, while the volatile assets may have seen decreasing or sideways-moving social volumes, the stablecoins have seen a completely different trend with the metric; their social volumes have sharply surged in the past week.

USD Coin (USDC), which is the stablecoin second only to Tether (USDT) in terms of market cap, has seen an extraordinary rise of more than 300% in terms of this metric. This suggests that discussions around the coin have increased by more than 300% during the past week.

Tether itself has observed a positive 7-day change in the social volume of more than 30%, which, while much lesser than USDC’s, is still quite significant nonetheless.

Generally, investors use stables whenever they want to escape the volatility associated with the other coins in the sector. So, since the interest around these tokens has surged recently while the volatile cryptocurrencies have been seeing a red period, it would appear that holders may once again be seeking the safety of this stable form of digital assets.

BTC Price

At the time of writing, Bitcoin is trading around $27,300, down 2% in the last week.

Bitcoin Price Chart