In a recent post on X, Michael Steinbach highlighted that Toncoin’s current price is at $2.80, which he considers one of the most exciting levels of the year. With momentum building, Steinbach noted that traders everywhere are now asking the same question: Is a breakout finally underway, or is a sharp sell-off just around the corner?
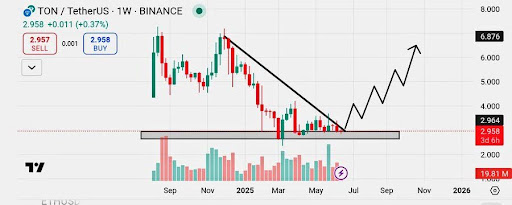
Toncoin Locked In A Narrow Range Between $2.70 And $2.80
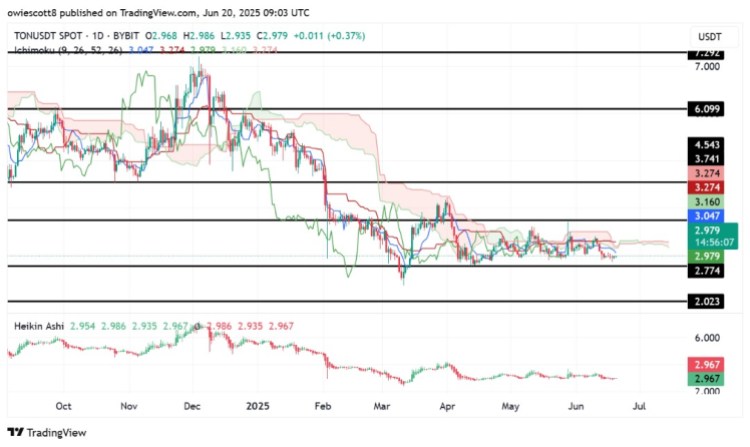
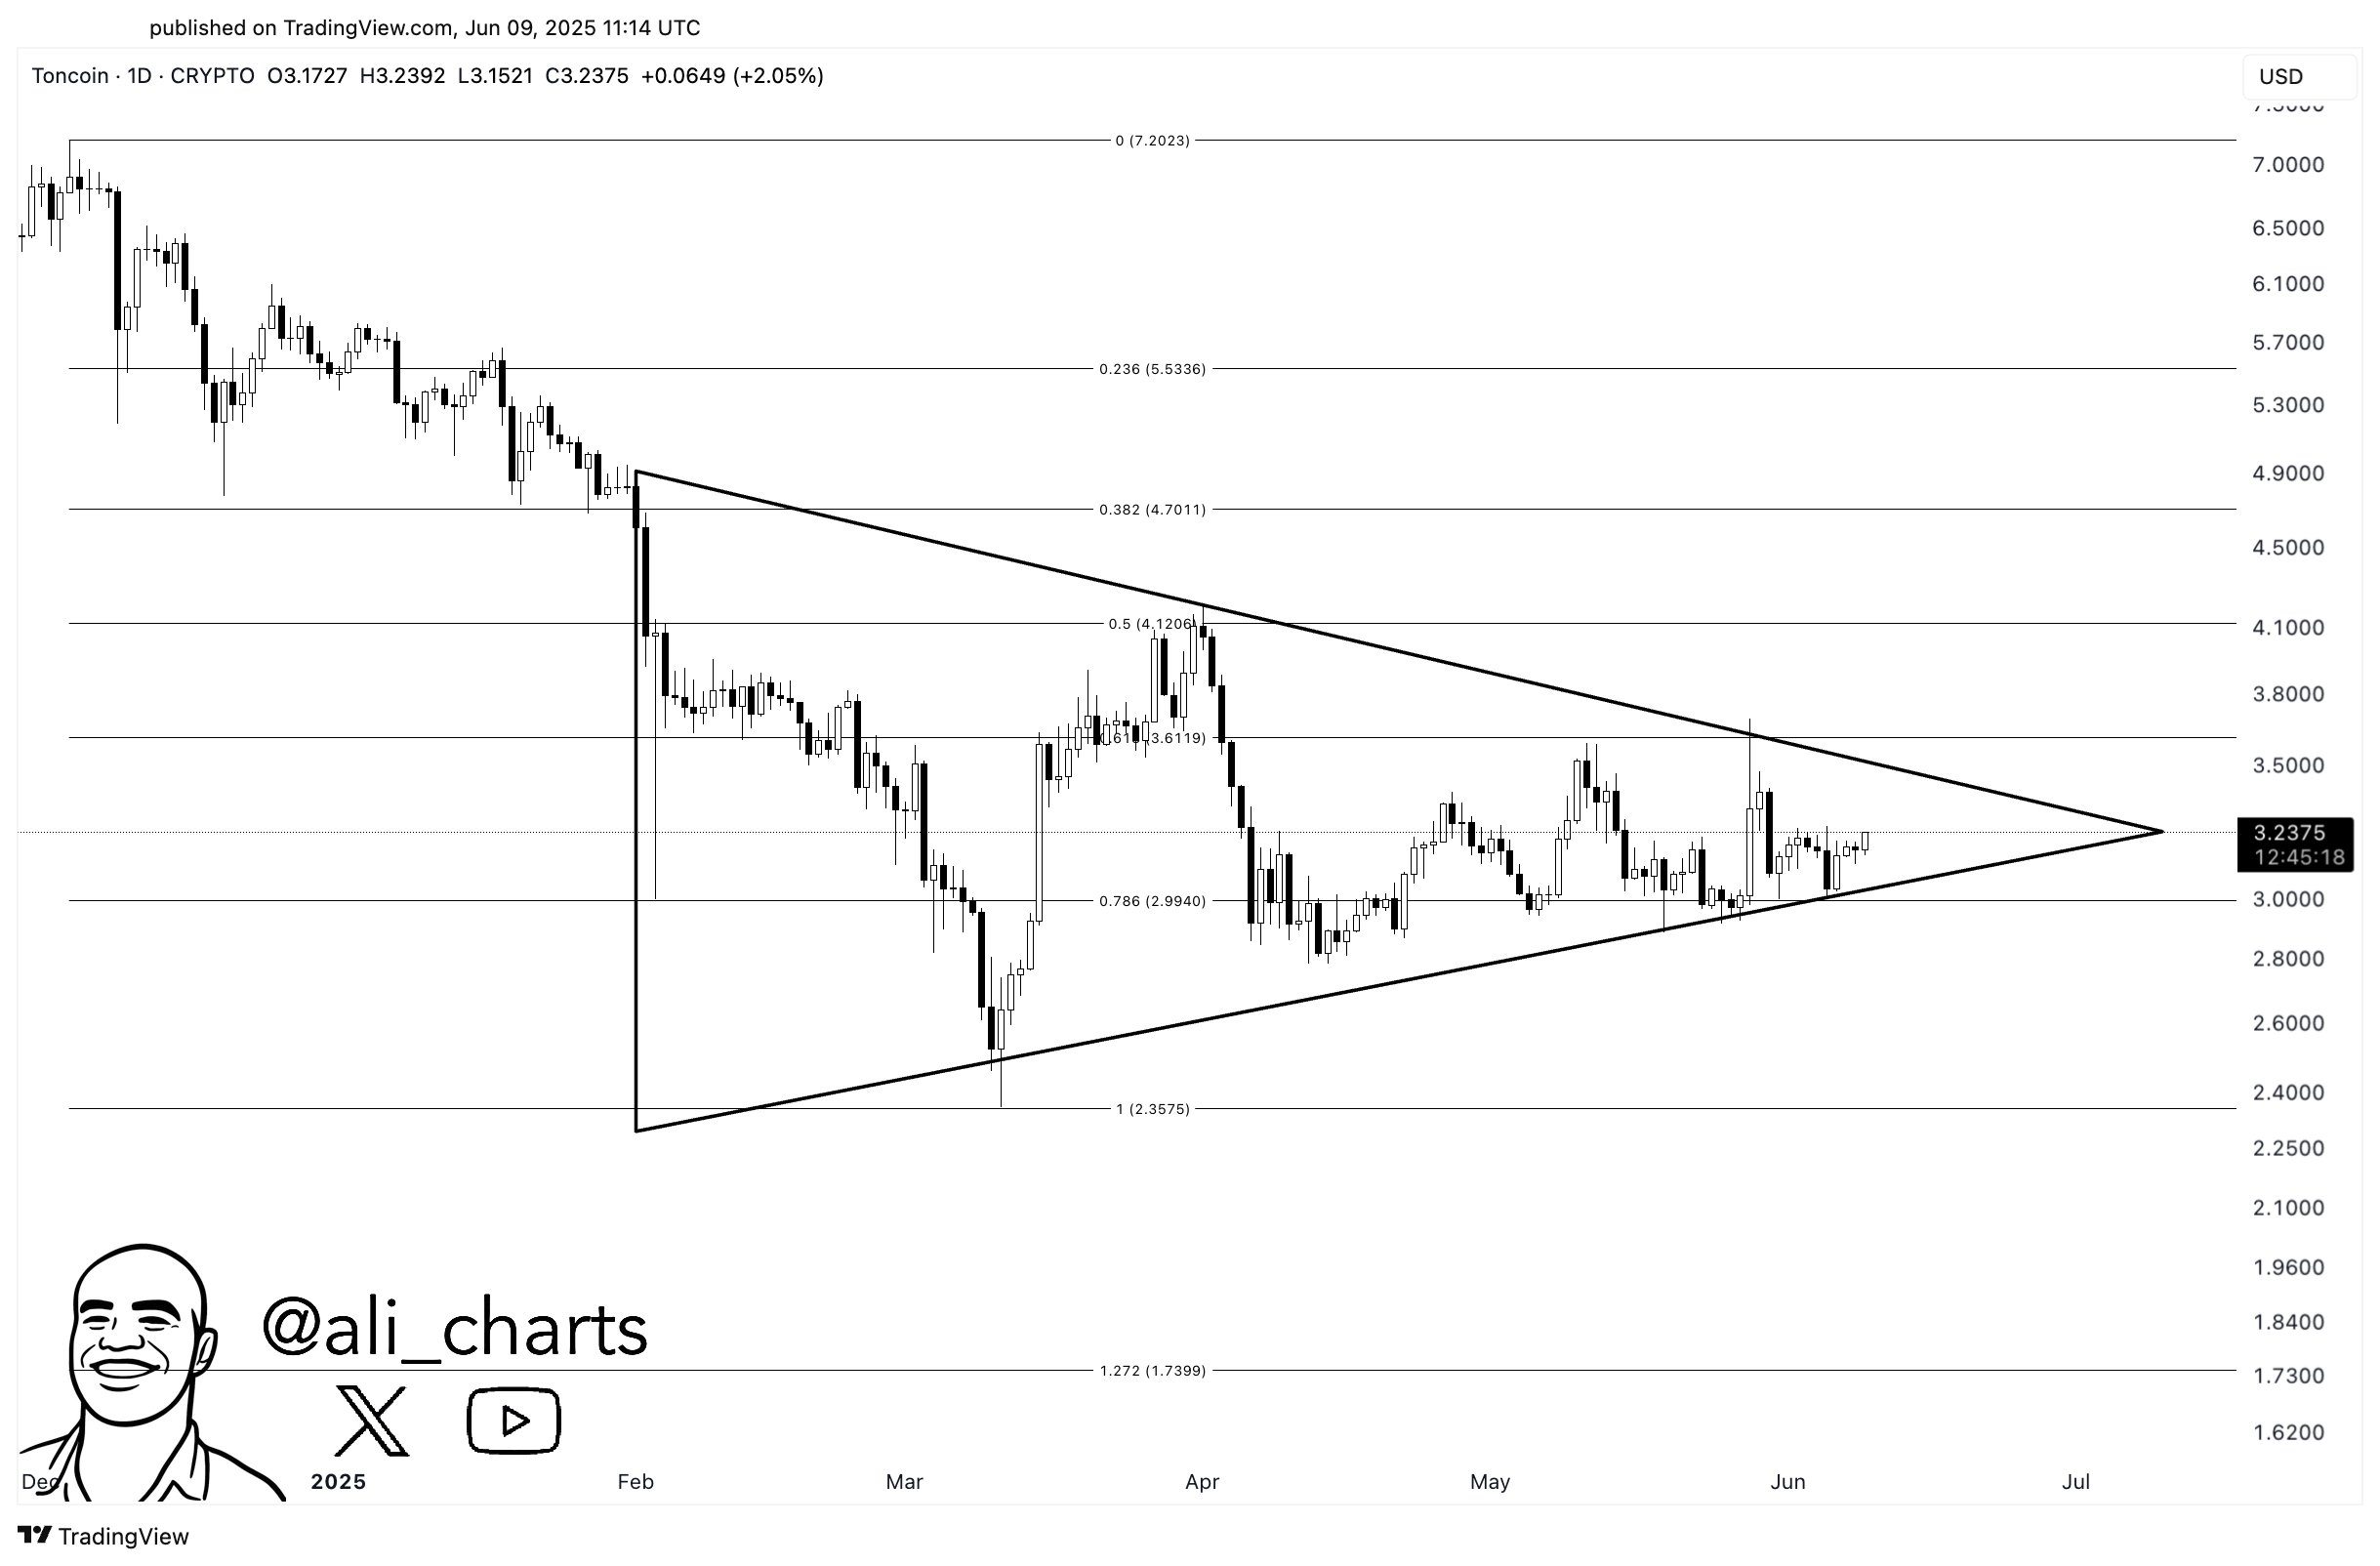
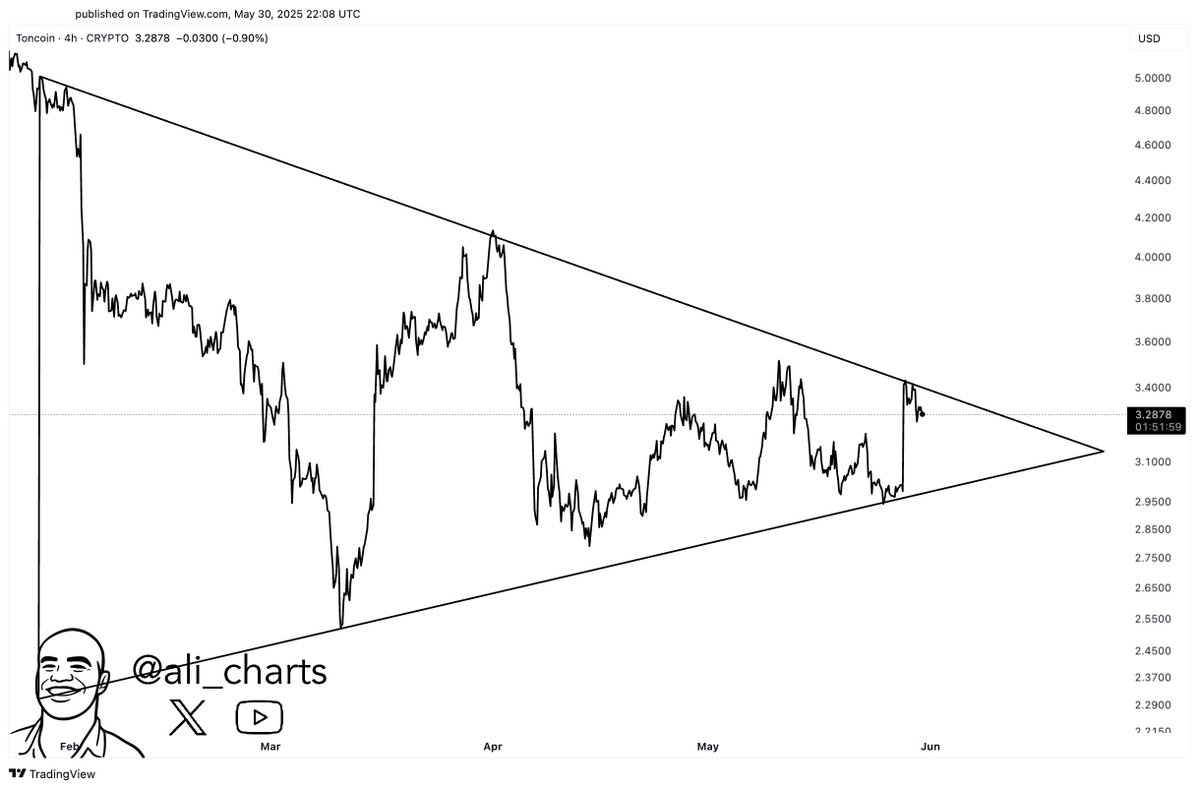
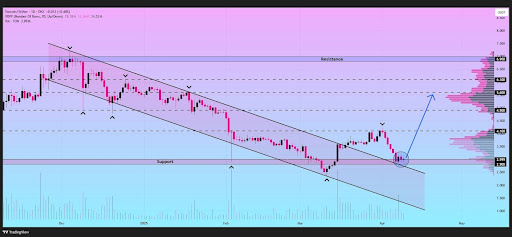
Analyzing the daily chart, Michael Steinbach points out that Toncoin has been locked in a tight range between $2.70 as support and $2.80 as resistance for several weeks now. He warns that jumping into the market without a clear plan is a recipe for losses, especially when others are already navigating these well-defined zones with precision.
He highlights the RSI sitting at 39, a relatively weak position. While it’s not yet in oversold territory, Steinbach notes that buyers may be holding off for deeper levels. Back in April, a strong rebound occurred from below 30, making the 30–32 zone a critical area to watch for potential bullish reactions.
In terms of risk, Steinbach warns that a break below the $2.70 support could hand control over to the bears. If that level fails, the next downside targets to watch are $2.50 and, in a worst-case scenario, $2.00. He reminds traders that repeated tests of a support zone tend to weaken it over time, and when it finally cracks, the fallout can come fast.
Whether watching for a breakout or a breakdown, having a plan is essential. Reacting after the crowd moves rarely pays off; it’s the calm, pre-planned decisions that give traders the edge when volatility strikes.
Breakout Or Pullback? Define The Setup Before Entering
In outlining the bullish scenario, the analyst noted that if Toncoin manages to secure a daily close above the $2.80 resistance, momentum could quickly follow through. This breakout could open the path toward $3.00, with an extended target near $3.40, representing a potential 26% gain from current levels. That’s the kind of upside savvy traders prepare for.
So, what’s the key takeaway? According to the analyst, successful trading doesn’t rely on gut feeling; it requires well-defined triggers. That means either entering on a confirmed breakout above $2.80 with a stop-loss just below, or stepping back and waiting for a pullback that aligns with RSI signals. The focus should always be on minimizing risk while allowing profits room to grow.
As for now, the analyst sees the trend as sideways to slightly bearish. Until the chart sends a crystal-clear signal, the best approach is patience — no FOMO trades, no blind bets, just disciplined setups.


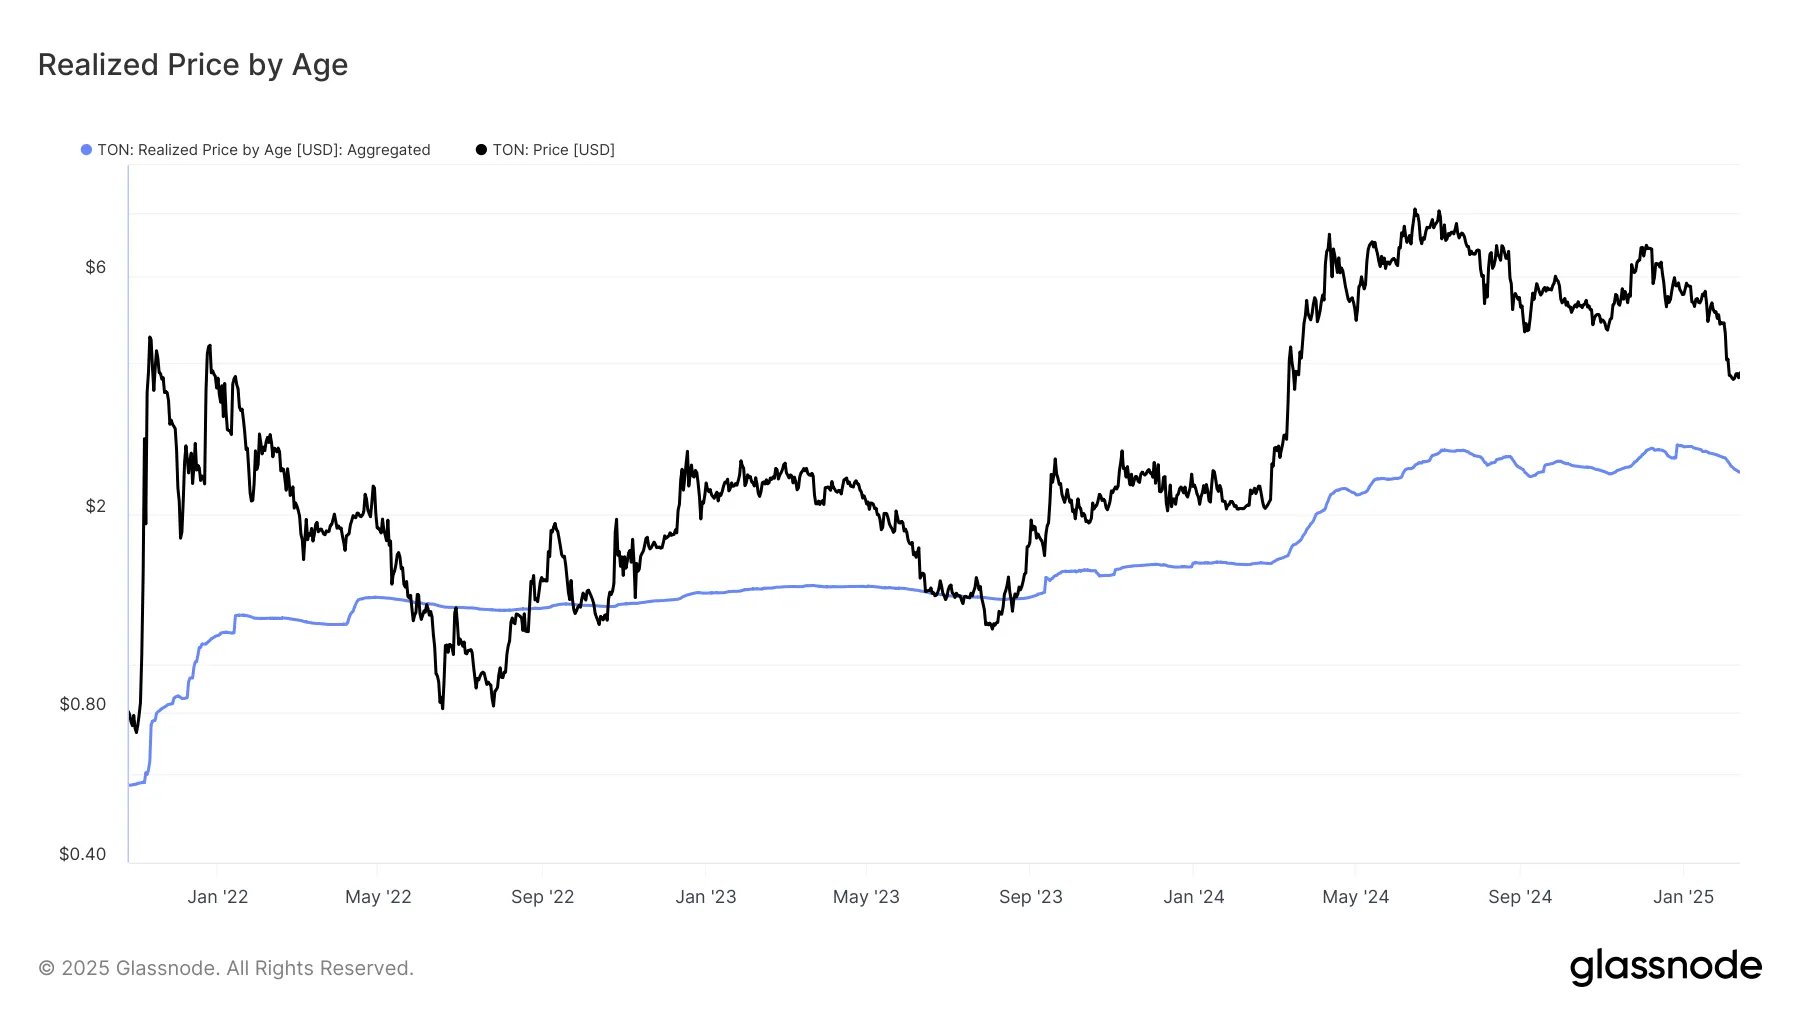
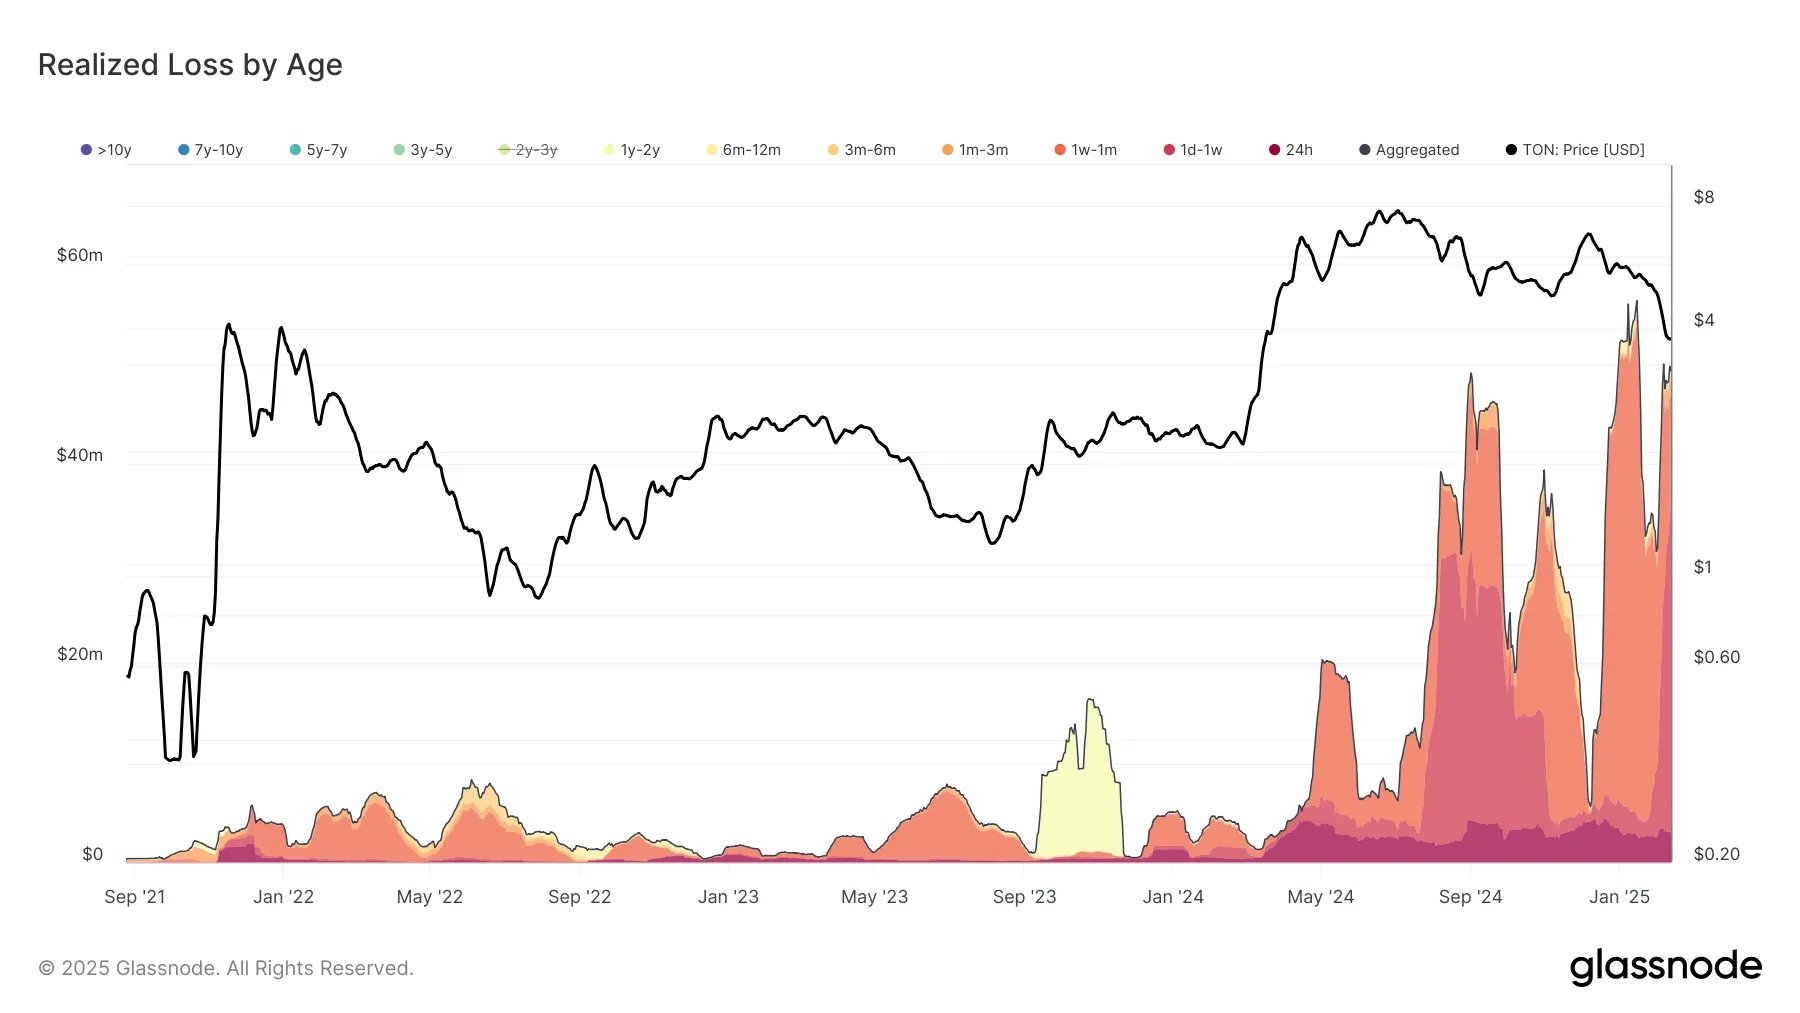
 Currently, investors who have held their positions for over one year are still enjoying a 69% profit, whereas short-term investors are incurring losses.


 Risk Appetite Soars Among
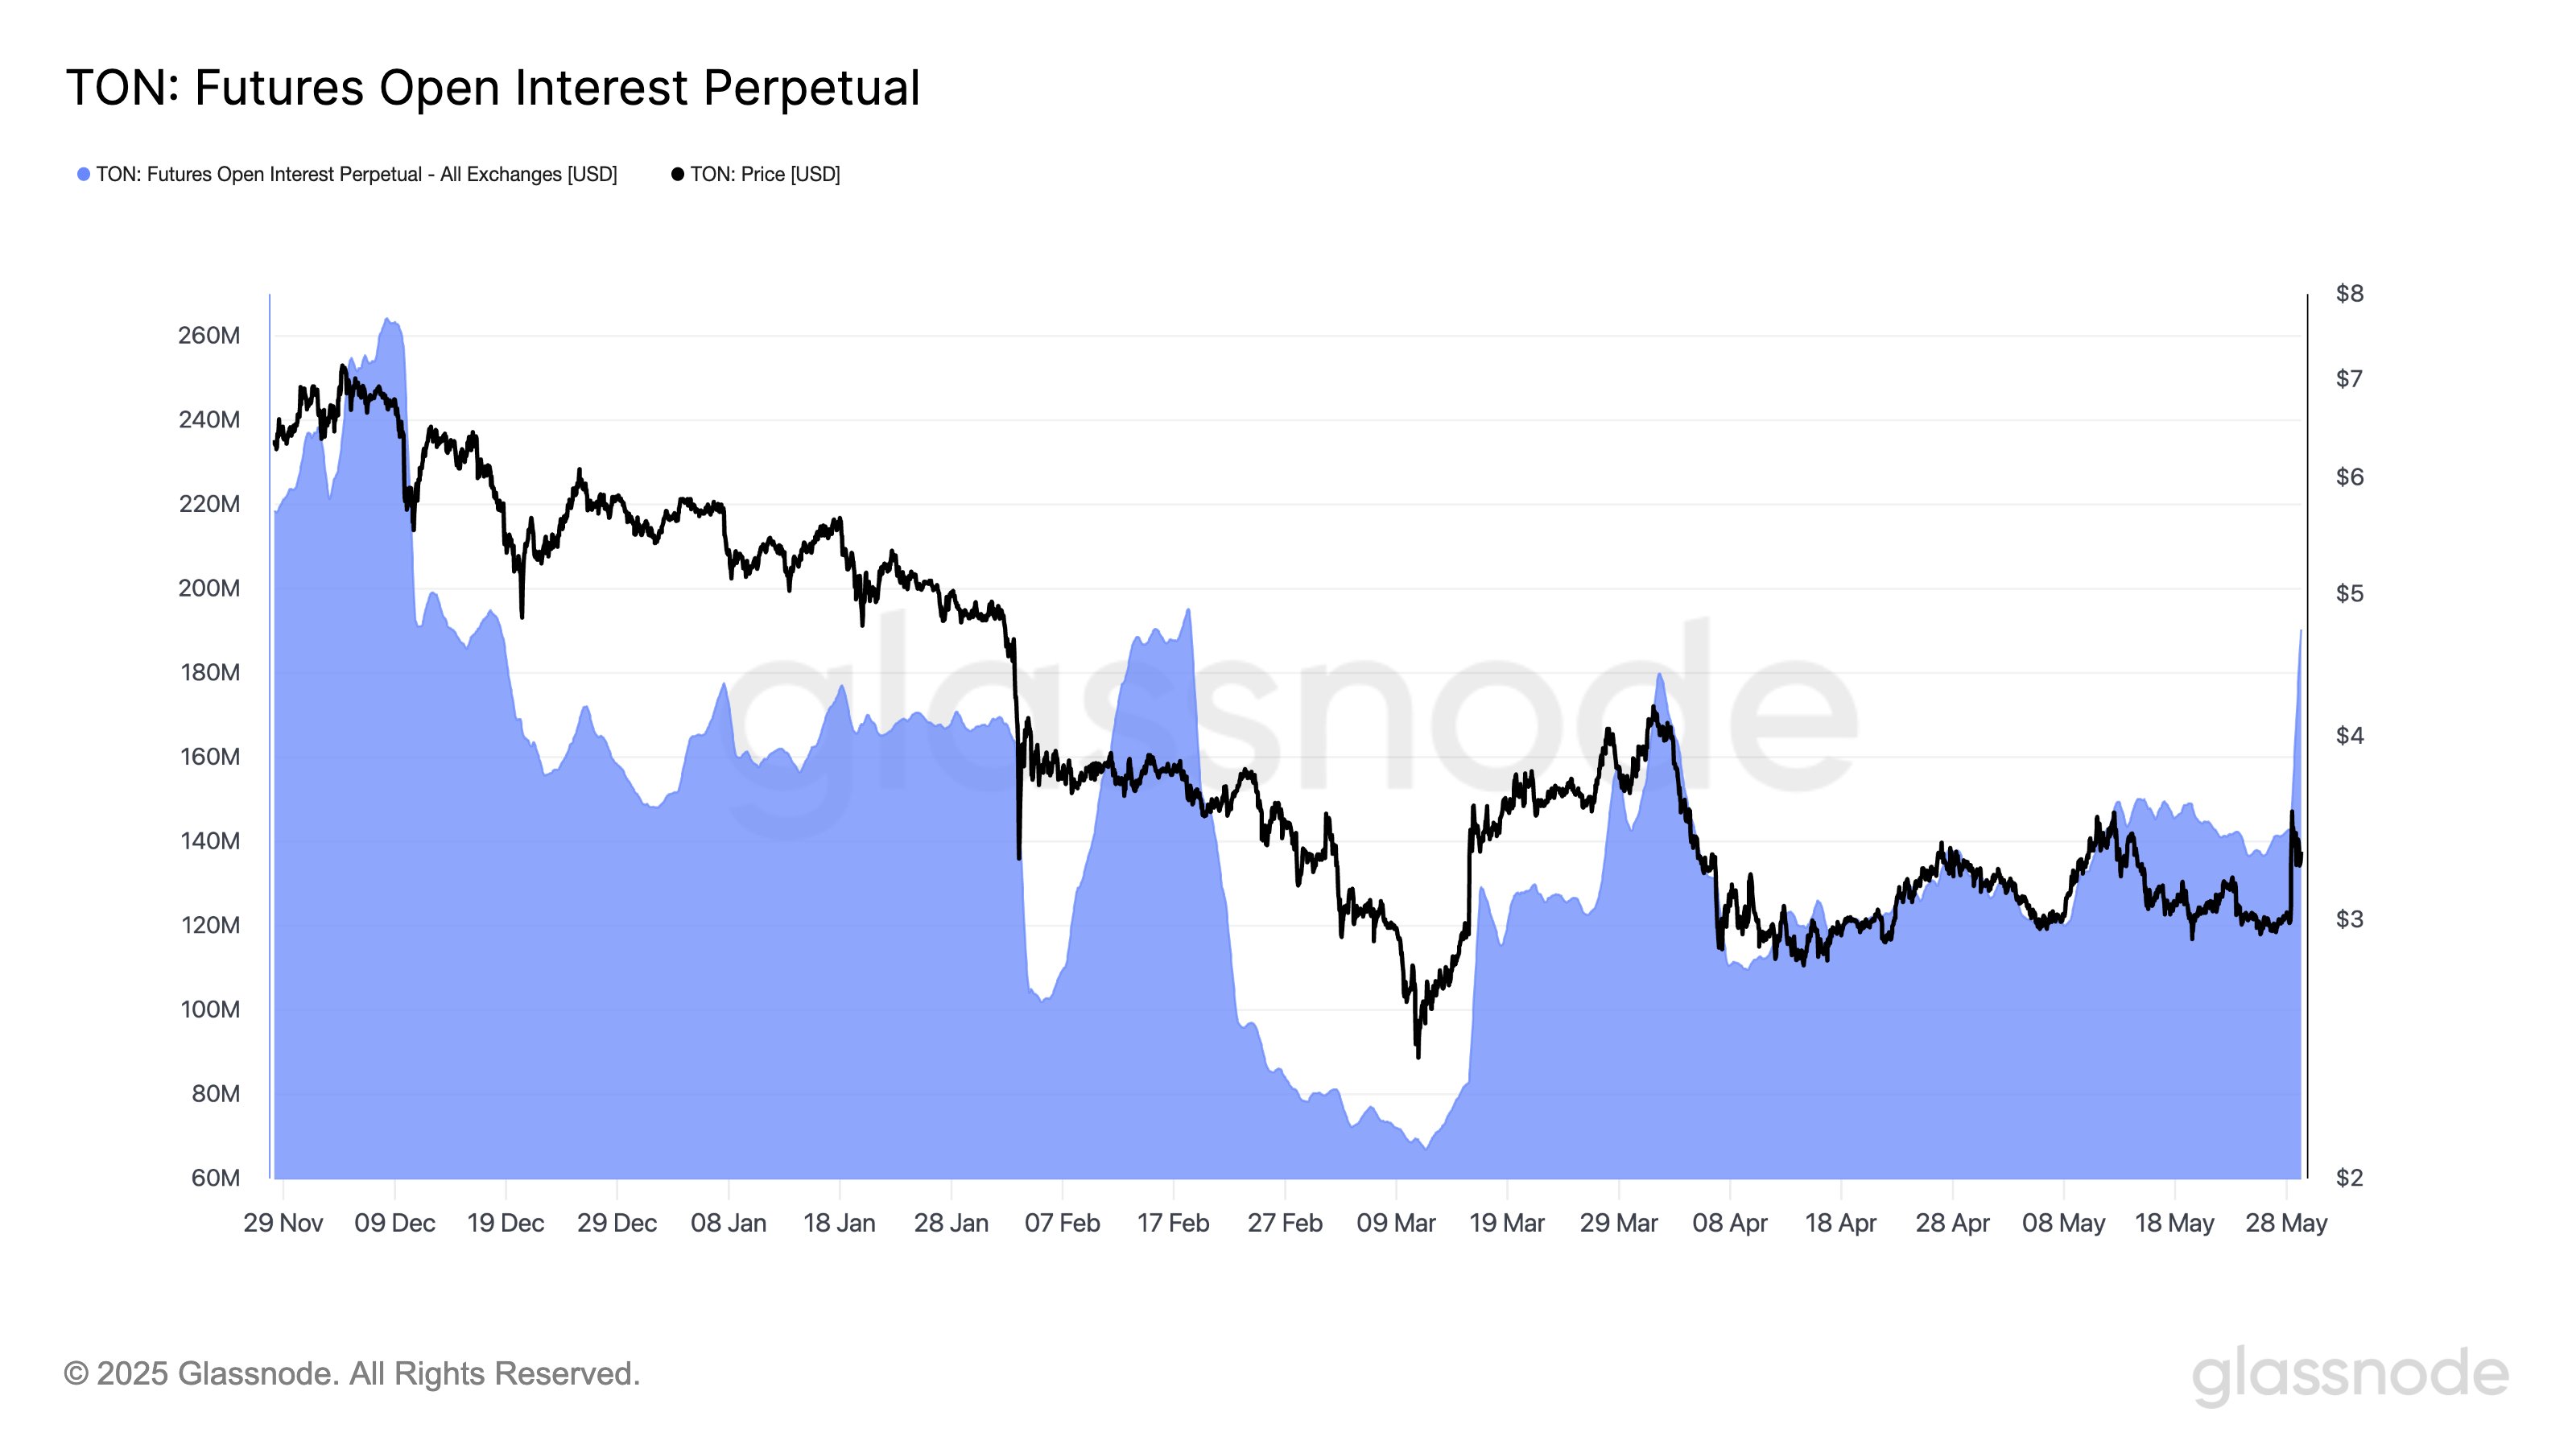
  We are currently witnessing a historic high in risky investments, such as derivatives, options, and lending, on TonCoin.


