US President-elect Donald Trump is reportedly open to establishing a strategic reserve that would include US-founded cryptocurrencies.
Cryptocurrency Financial News
US President-elect Donald Trump is reportedly open to establishing a strategic reserve that would include US-founded cryptocurrencies.

The integration requires no action from app developers and is currently live for all users.

Some Coinbase users are airing frustration at the region’s MiCA laws, which is forcing the exchange to stop offering yield on USDC in the European Economic Area.

Sheetz has expanded its partnership with Flexa to accept BTC, ETH and stablecoin payments at over 750 locations in the US.

The issues with liquidating the WEMIX stablecoin were not detailed, but the blockchain game producer has problems enough to choose from.

The fall of Silicon Valley Bank prompted Venture Capitalist Tim Draper to tell the firms he’d invested in to buy Bitcoin.

Tether’s USDT hegemony in the stablecoin market may shift as institutional investors chip into the crypto market.

The Lummis-Gillibrand Payment Stablecoin Act is a step in the right direction, but enactment in an election year may be difficult.

Despite Circle’s rising transaction count, Tether’s USDT still accounts for over 68% of the entire stablecoin market.

The U.S. government’s arguments on stablecoins in an unrelated criminal case could bolster Binance’s position in its civil case with the SEC.

The exchange is optimizing operations after acquiring ErisX on the eve of crypto winter and expects to save millions.
On-chain data shows Coinbase has just witnessed its largest USD Coin (USDC) inflow. Here’s why this may be relevant for Bitcoin.
As pointed out by analyst Maartunn in a post on X, a large amount of USDC has flowed into Coinbase during the past day. The on-chain indicator of interest here is the “exchange inflow,” which keeps track of the total amount of a given asset entering into the wallets associated with a centralized exchange or group of platforms.
A spike in the exchange inflow can indicate that investors are interested in trading away the cryptocurrency. In the case of an asset like Bitcoin, such a trend can naturally be a bearish signal for the price.
In the context of the current discussion, though, a stablecoin is of focus. While USDC exchange inflows would also imply that the holder wants to sell the asset, the transaction wouldn’t affect the price since, by nature, the coin always remains stable at around $1.
This doesn’t mean that the sale of USD Coin isn’t of interest to the cryptocurrency sector as a whole, however. If investors are swapping stable coins in favor of volatile coins like BTC, then the prices of these latter assets would observe a buying effect.
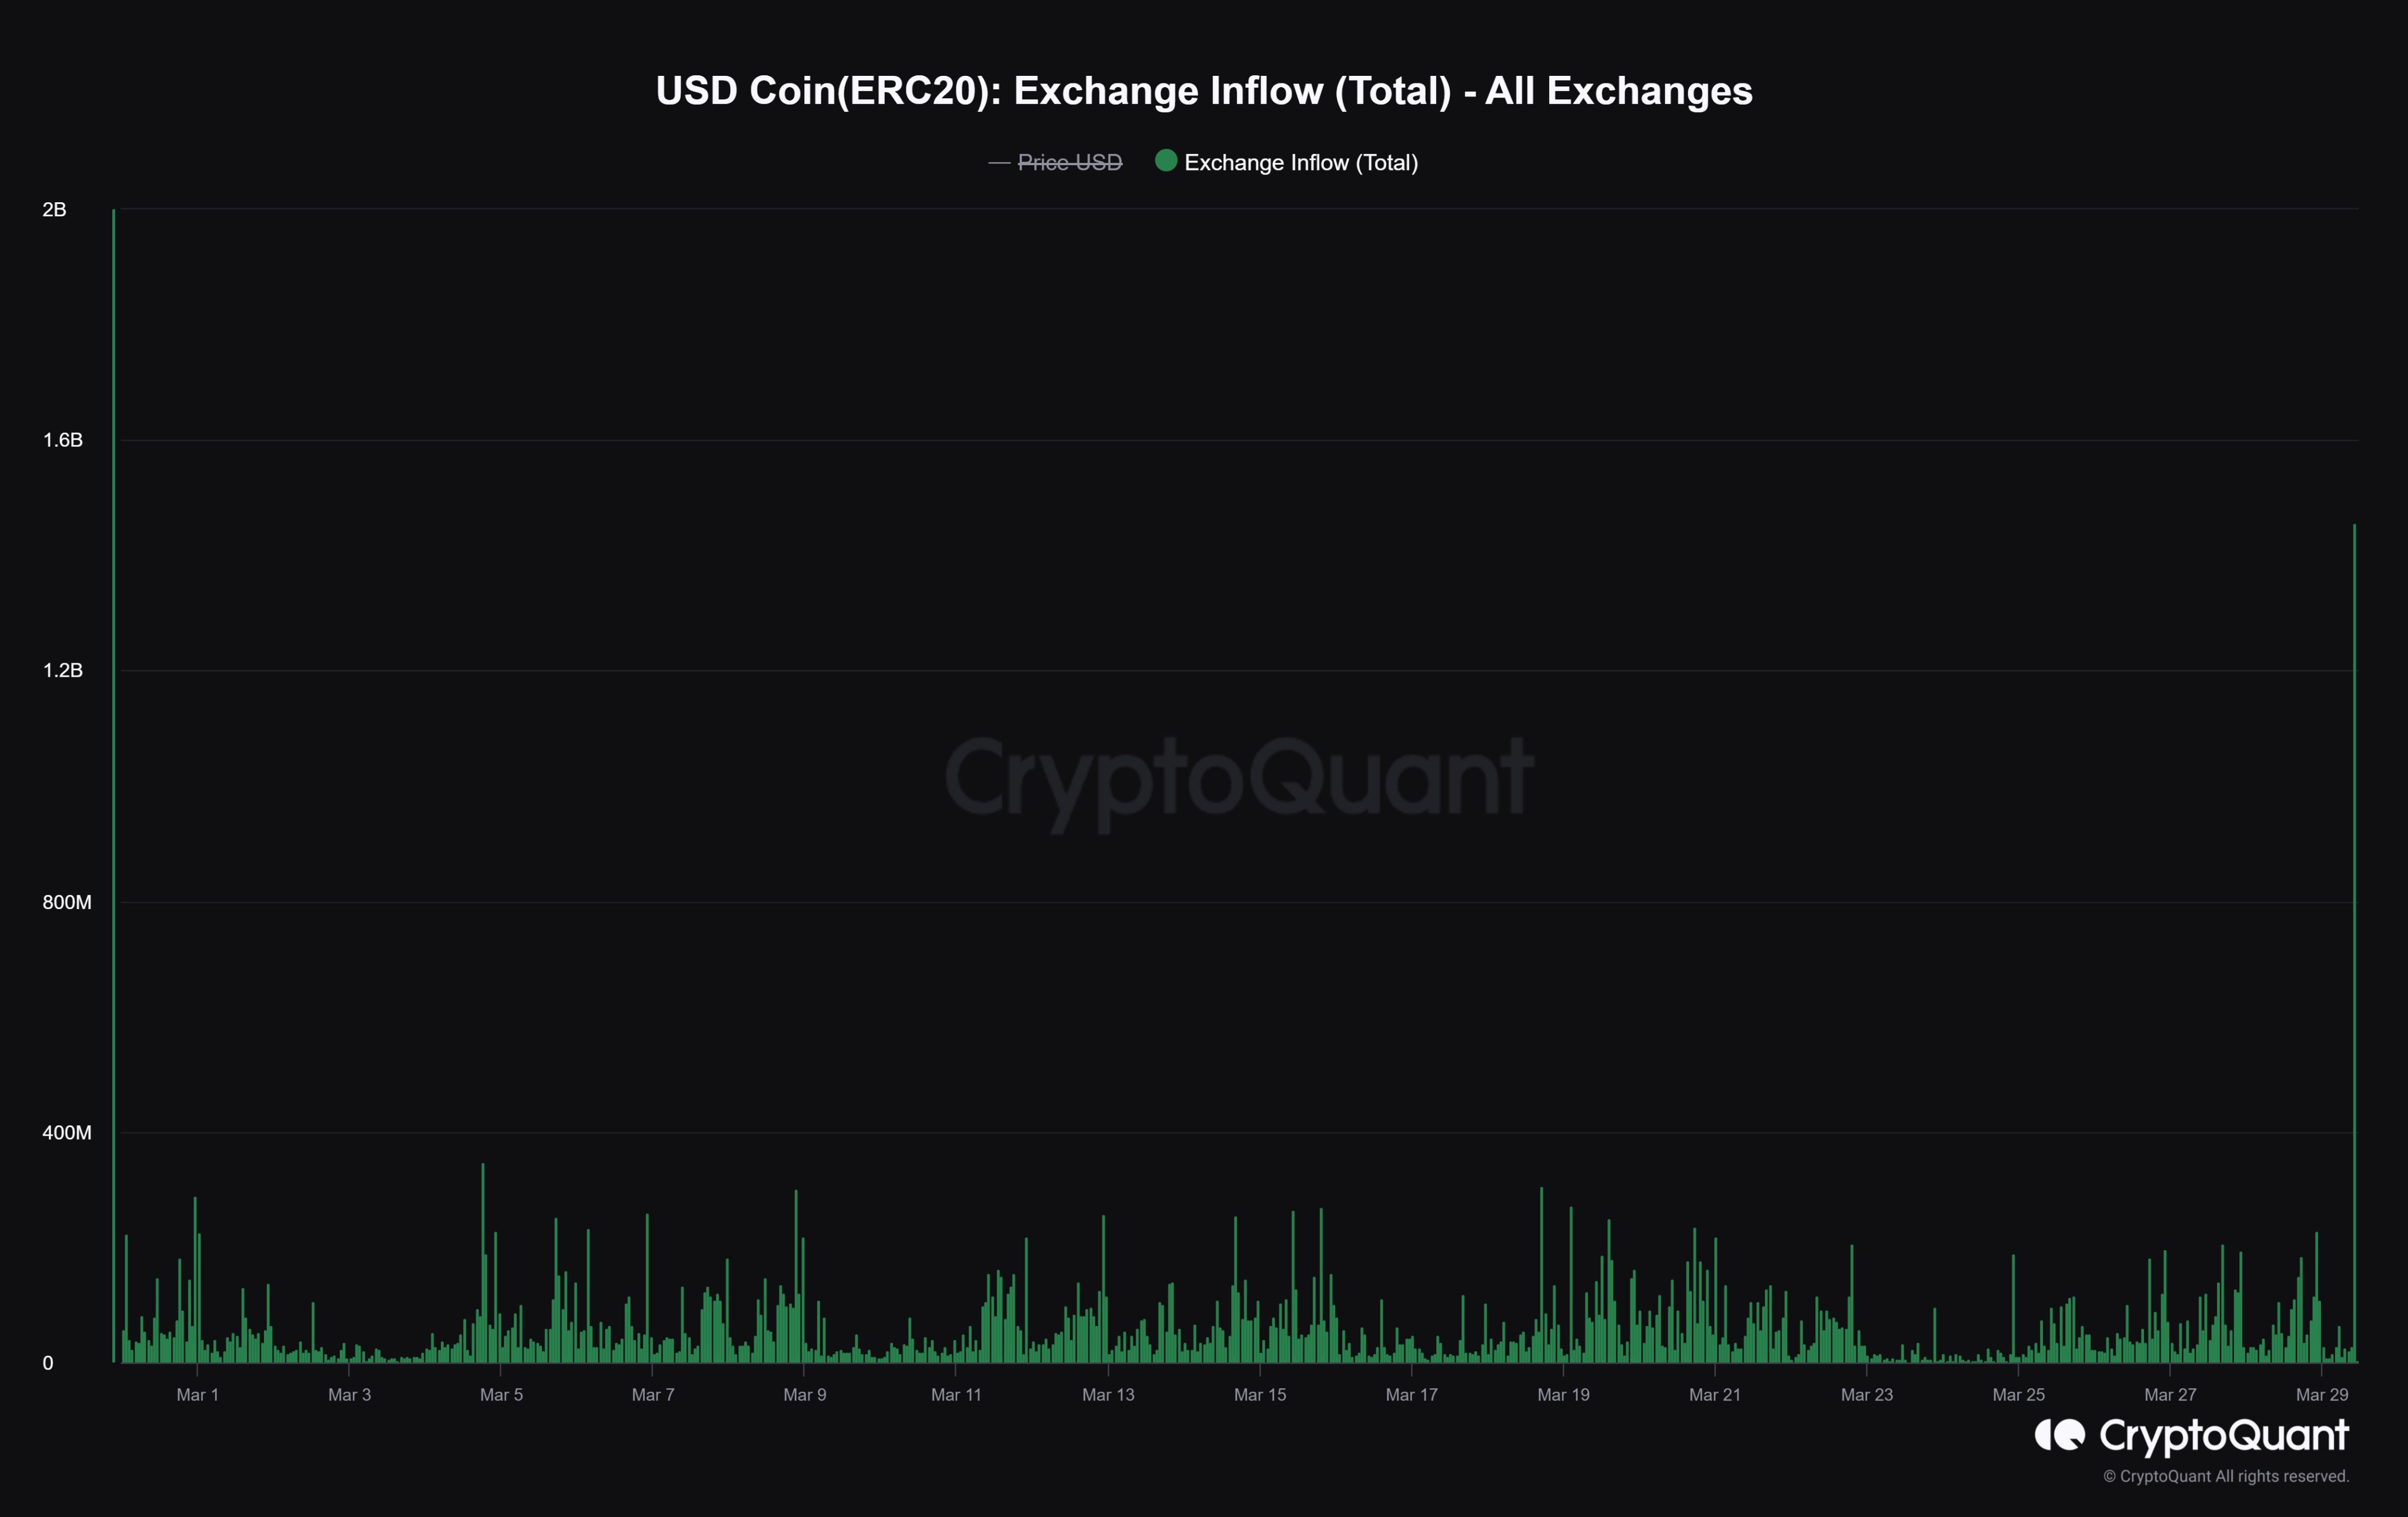
Now, here is a chart that shows the trend in the USDC exchange inflow over the past month:
The above graph shows that the USDC exchange inflow has just registered a huge spike. According to Maartunn, this inflow was headed towards the cryptocurrency exchange Coinbase.
In total, $1.4 billion worth of the stablecoin has entered the platform’s wallets with this inflow, the largest the exchange has ever observed. Given the extraordinary scale, this could prove to be quite bullish for Bitcoin and others if the entity behind the inflow is planning to go on a buying run with this dry powder.
There also exists the scenario, however, where the whale actually intends to trade away the USD Coin stack in favor of fiat rather than using it to buy other cryptocurrencies. In such a case, a net amount of capital would be exiting the sector, which would be a bearish sign.
It now remains to be seen whether the massive USDC deposit indeed ends up causing any noticeable fluctuations in the volatile side of the market, particularly in the price of Bitcoin.
Bitcoin had observed sharp bullish momentum earlier to cross above the $70,000 level, but since then, the asset has fallen back to sideways movement, with its price remaining unchanged.
Other stablecoins such as USD Coin may benefit from the coming regulatory crackdown and gain market share, the report said.

Traditional financial firms are increasingly connecting services, portfolios and operations with digital assets.

Recipients need to download a Coinbase Wallet to receive the funds, but the crypto exchange says they’ve simplified the process for less tech-savvy users.
Recipients need to download a Coinbase Wallet to receive the funds, but the crypto exchange says they’ve simplified the process for less tech-savvy users.
Recipients need to download a Coinbase Wallet to receive the funds, but the crypto exchange says they’ve simplified the process for less tech-savvy users.

While Ether represents 50% of the total crypto donations made to Save the Children’s HODL Hope Campaign, Bitcoin donations amount to 34% of the lot so far.

The stablecoin ecosystem has evolved significantly over the years, with new regulations and models shaping the landscape.

The United States-based stablecoin issuer Circle reports a partnership with Taiwan’s second-largest convenience store chain, FamilyMart and a local crypto exchange, BitoGroup.