Dogwifhat (WIF) Targets $1.50 Amid 50% Weekly Jump – Here Are The Levels To Watch

Amid its breakout, Solana memecoin Dogwifhat (WIF) eyes a reclaim of $1.50 and a continuation of its bullish rally. Some analysts suggest that new highs are bound to come if the token holds above a crucial level.

Dogwifhat Reclaims $1.00

Over the past month, dogwifhat has seen a massive 190% surge, climbing back to the $1.00 barrier. The memecoin has been in a downtrend since hitting its Q4 2024 high of $4.19 in November, retracing over 92% in five months.

After the TRUMP memecoin and LIBRA token controversial launches, the sector faced market exhaustion, with most memecoins struggling during the Q1 2025 retraces. As a result, WIF lost the $1.00 mark for the first time in a year.

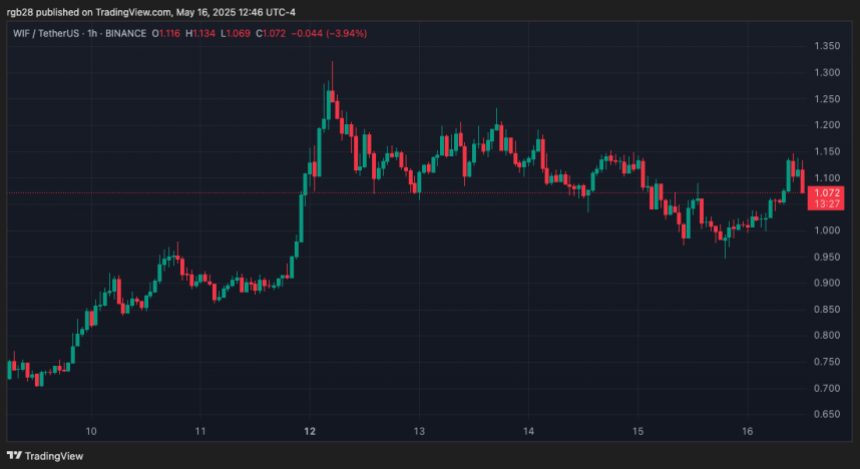
Amid last month’s pullbacks, dogwifhat hit a 14-month low of $0.32 before the crypto market recovery started, but jumped to the $0.60 support at the end of April. Since then, WIF has soared over 70%, reclaiming the key $1.00 resistance on Monday.

This week, the memecoin has hovered between the $1.00-$1.20 price range after hitting a three-month high of $1.32 four days ago. Additionally, it retested the recently reclaimed level as support after bouncing from the $0.95 level on Thursday.

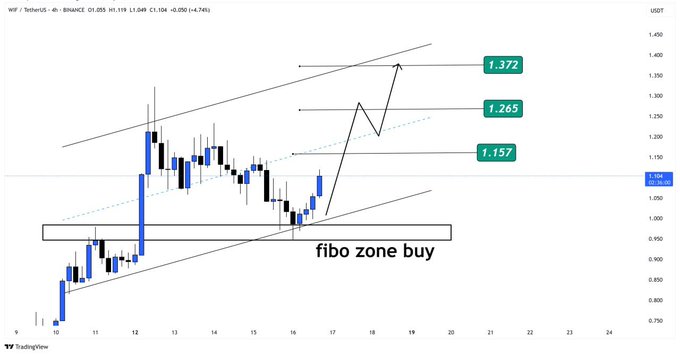
Market watcher Rose Premium shared a technical outlook for the cryptocurrency, noting a bullish structure after its recent performance. The trader explained that dogwifhat shows “a classic bullish structure after rebounding from the Fibo Zone,” between the $0.95-$0.98 range.
dogwifhat

Based on this, WIF’s trend continuation is likely if the memecoin holds the $1.00 level as support. This could propel the token toward an initial target of $1.15, before reclaiming the $1.26 level and finally reclaiming the $1.37 mark.

WIF Breakout Eyes $1.50

Trader Coinvo suggested that WIF’s “classic break and re-test pattern” is “guaranteed” to send the memecoin’s price in a parabolic rally. Similarly, analyst Carl Runefelt from The Moon Show affirmed that dogwifhat is “potentially ready to continue its rally to new highs.”

Per the chart, WIF has been in a symmetrical triangle pattern over the past week, with price breaking out of the upper boundary after surging above the $1.05 level.

According to the formation, the cryptocurrency targets $1.50 if the breakout is confirmed. This level has been a crucial horizontal level, serving as a key bounce area during the 2024 retraces, and could propel dogwifhat to higher targets if reclaimed.

Meanwhile, analyst The Cryptonomist highlighted a falling wedge pattern in WIF’s lower timeframe chart. The memecoin broke out of the 3-day pattern after today’s bounce, breaking out of the upper boundary after reclaiming the $1.03 mark.

The analyst stated that WIF could target the $1.49 resistance area if it holds its current levels and the entire market “goes for another leg up from here.”

As of this writing, dogwifhat trades at $0.14, a 1.8% increase in the daily timeframe.
dogwifhat, WIF, WIFUSDT

Dogwifhat (WIF) Surges 16% Amid Las Vegas Sphere Project Expectation, Breakout Coming?

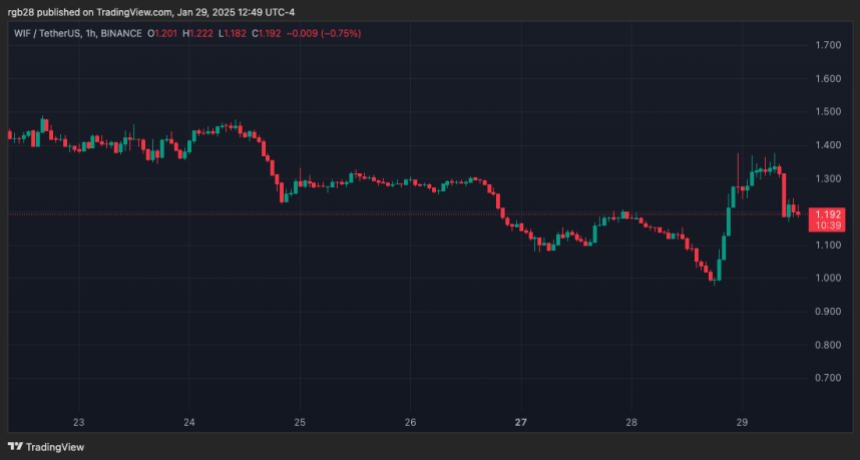
On Wednesday, Dogwifhat (WIF) led the crypto market with a 16% surge to $1.37, becoming one of the best-performing cryptocurrencies in the last 24 hours. The token swam against the current as most of the top memecoins recorded red numbers, leading analysts to suggest a possible breakout for the token.

Las Vegas Sphere About To Be WIF Hat

Dogwifhat has recovered from yesterday’s drop below the $1 mark following its team’s tease of the long-awaited Las Vegas Sphere project. On Tuesday night, the official Dogwifhat X account shared a picture of its mascot in Las Vegas.

The image included the cute dog with the Las Vegas Sphere as its hat and an old Nokia phone with “01.2025” on its screen. Additionally, the account stated that the “hat stays on,” explaining that dates will be shared “as soon as we are allowed.”

WIF

The bullish tease propelled the token back to its recently lost support of $1.30 and reignited the broader community’s interest in the memecoin.

WIF became the memecoin sensation of 2024, reaching an all-time high of $4.88 last March. The token also led the memecoin narrative during Q2 and recovered some of its early glory during the December pump.

However, WIF’s spotlight was eclipsed by the oversaturated memecoin sector and the rise of many other market sensations like PNUT and CHILL, dropping 40% in the last six months and 75% from its ATH.

During its 2,000% growth phase, many crypto investors put their hats on, which prompted a massive fundraising campaign to display the memecoin in the Las Vegas Sphere, the world’s largest LED screen, for a week.

The community raised $700,000 to achieve this dream but was left in the dark over the last several months. In July 2024, many investors expressed concern and frustration about the project after Crypto.com displayed Bitcoin’s logo on the Sphere.

Some community members questioned the project, calling the initiative an alleged scam. However, the organizer repeatedly assured the WIF community that they were working to make “wif on Sphere” happen soon.

Is the Dogwifhat Bottom In?

Crypto analyst Altcoin Sherpa shared his outlook on WIF’s recent performance. He suggested that the pump doesn’t seem “actually real/sustainable” based on the “overall chart/market conditions.”

However, he considers that if Dogwifhat shows some consolidation above the $1.23 mark, it could see another leg up. Meanwhile, crypto trader Bluntz stated that its current levels could potentially be WIF’s bottom.

According to the post, “the major A wave has now been swept” and there are some “nice signs of life forming” in the lower timeframes despite the retrace lasting longer than he anticipated.

The trader previously forecasted an “inevitable” fall to the $1 range, arguing that WIF was headed for a large retrace before the next parabolic run, which could lead to a new ATH.

After the recent performance, Bluntz warned that it is a “very early day, and we haven’t seen a 5-wave rise from the lows ‘yet’, but I think there’s a decent chance one has begun to form.”

Another market watcher also pointed out a one-month falling wedge pattern on WIF’s chart, which targets $1.90 at a “minimum and quickly” if the memecoin breaks out of the upper downtrend line at around $1.40.

As of this writing, dogwifhat trades at $1.21, a 14.4% surge in the daily timeframe.
WIF, WIFUSDT, dogwifhat

WIF Shakes Off Setbacks As Bullish Resurgence Targets More Gains

WIF is making a powerful return to the market, as bullish momentum takes hold and drives the price higher. After showing signs of resilience, the digital asset is on an upward trajectory, with strong positive traction setting the stage for further gains. As WIF continues to gain ground, the digital asset is positioning itself for continued growth, pushing past key resistance levels.

This article aims to analyze WIF’s current strength, which is propelling the asset toward higher price levels. The goal of examining the key drivers behind this surge, including market sentiment, and technical indicators, is to understand how the meme coin is positioning itself for sustained upward movement. It will also explore the potential for the asset to break through significant resistance points and set new highs while assessing the durability of the rally.

WIF’s Bullish Traction: Analyzing The Path Forward

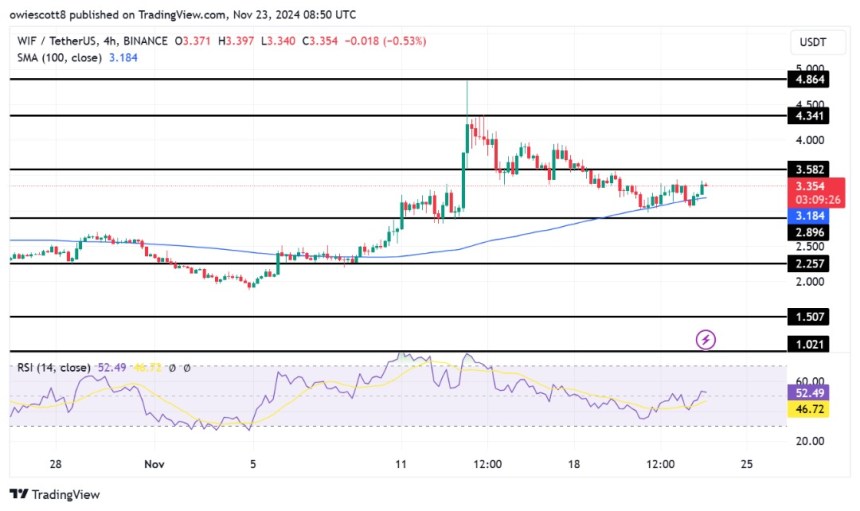
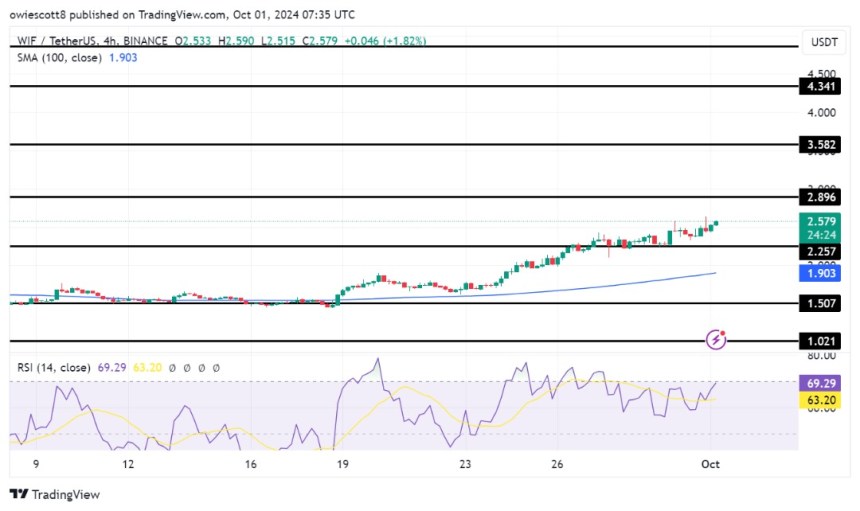
WIF has demonstrated renewed positive strength after rebounding from the $2.89 support level, steadily advancing toward the $3.58 resistance level. This recovery indicates a significant shift in sentiment, with buying pressure triggering more price growth. Also, the cryptocurrency is trading above the 100-day Simple Moving Average (SMA) on the 4-hour chart, which reinforces the bullish trend and a strong foundation for further gains if WIF successfully breaks above the $3.89 resistance.

WIF

An examination of the 4-hour Relative Strength Index (RSI) shows that the RSI has climbed back above the 50% threshold after experiencing a decline to 40% signaling a resurgence in buying pressure, reflecting renewed bullish momentum in the market. A persistent climb would indicate strong overbought conditions, suggesting robust demand and the possibility of more price growth.

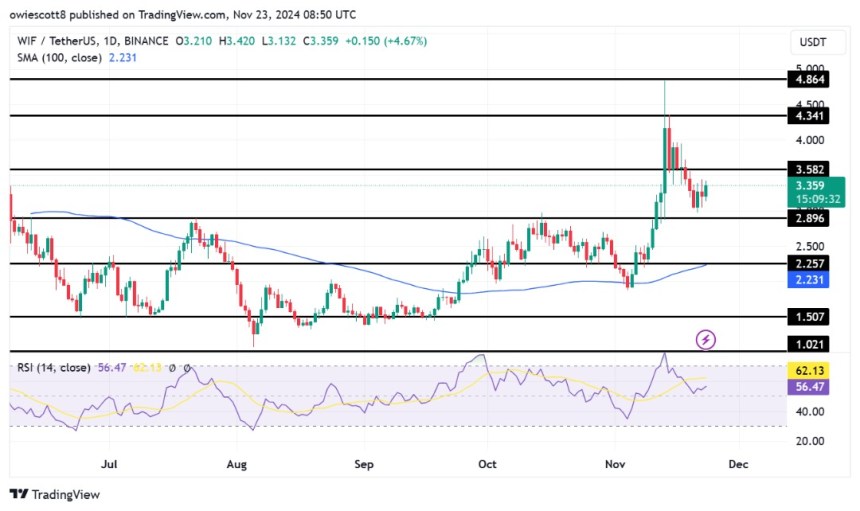
Also, the daily chart highlights WIF’s strong upward momentum, evidenced by the formation of a bullish candlestick as the price rebounds from the $2.89 level. Its position above the SMA further solidifies the positive trend, signaling consistent strength. As WIF continues its ascent, it inspires growing market confidence and paves the way for an extended price increase.

WIF

Lastly, the daily chart’s RSI has recently surged to 57%, reflecting a strong wave of optimistic sentiment as it maintains a position above the critical 50% threshold. This rebound comes after a temporary dip to 51%, demonstrating the re-emergence of buyers in the market

Resistance Levels To Watch: Can WIF Break Through?

As WIF continues its upward trajectory, key resistance levels will play a pivotal role in determining its next move. The immediate challenge lies near the $3.58 mark, a critical threshold that could either pave the way for additional gains or temporarily halt the rally. A successful break above this level could set WIF on course toward new highs, reinforcing its bullish trend.

However, if WIF fails to surpass the $3.89 resistance, it may face consolidation or a pullback toward the $2.89 support level. A breach below this key support could trigger a more significant decline, possibly extending toward the $2.2 level and below.

WIF

WIF Slide Below $3.582 Sparks Fears Of Further Losses

WIF latest dip below the crucial $3.582 support has triggered concerns across the market, as bearish sentiment appears to be gathering strength. Its break below this key level could pave the way for even greater losses, leaving traders to question whether the bulls can stage a comeback or if further declines are inevitable.

As downside risks grow, this analysis aims to examine WIF’s recent drop below the critical $3.582 support level and explore the potential implications of this bearish shift for future price movement. By assessing current market sentiment, key technical indicators, and possible support zones, we seek to determine whether WIF is positioned for more losses or if a reversal may be on the horizon.

Examining WIF’s Drop Below The Critical $3.582 Support Level

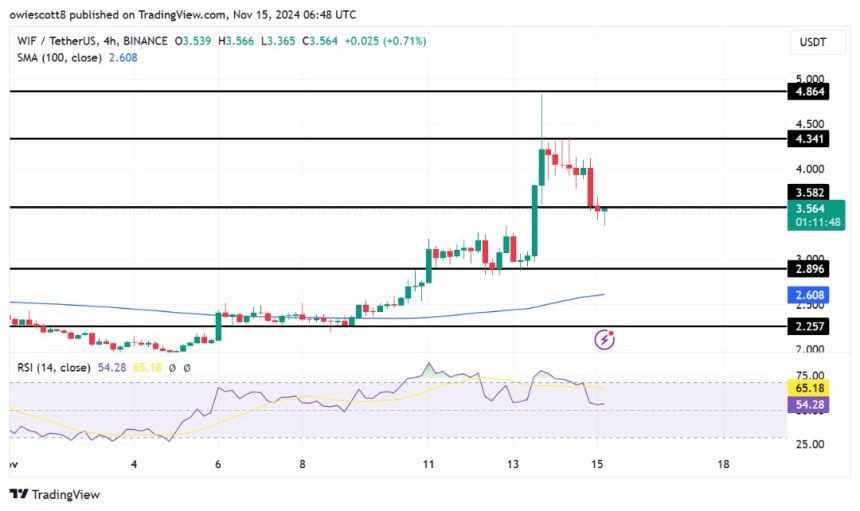
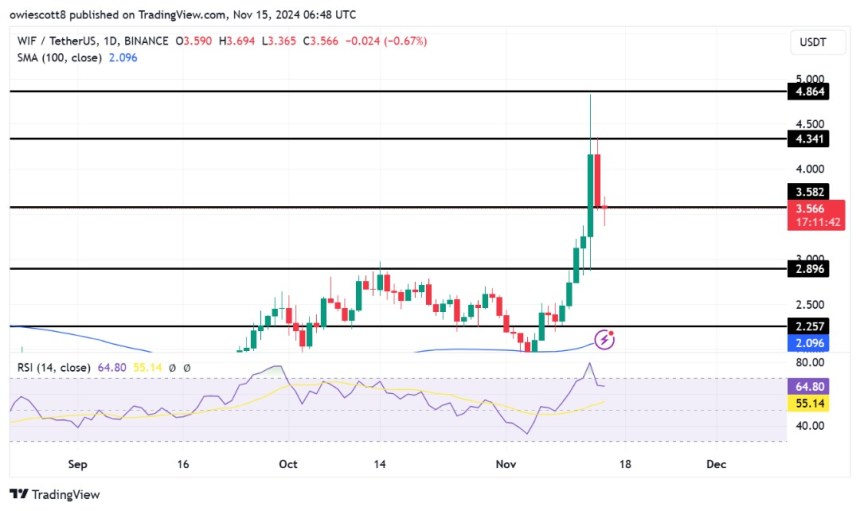
On the 4-hour chart, WIF has recently broken below the $3.582 level, triggering bearish momentum as the price moves toward the $2.896 support range and the 100-day Simple Moving Average (SMA). As the bearish trend develops, the market is closely watching for any signs of stabilization or a deeper slide toward key support zones.

WIF

The 4-hour Relative Strength Index (RSI) has dropped from the overbought zone to 53%, signaling a reduction in upward momentum. This move toward neutral territory suggests that buying pressure may be waning, and market participants will be looking for indications of continued decline or a potential shift in momentum.

On the daily chart, WIF is showing strong negative strength, highlighted by a bearish candlestick pattern that has pushed the price below the critical $3.582 support. This pattern indicates that sellers are firmly in control of the market, relentlessly driving the price lower, prompting a strong likelihood of further drops in the near term.

WIF

An analysis of the 1-day RSI suggests WIF may face extended losses as it has dropped from a high of 80% to 64%, indicating a reduction in buying pressure. Typically, this decline points to a possible weakness of bullish momentum, with more downward pressure likely if the RSI continues to wane. 

Potential Support Zones To Watch If WIF Continues To Drop

If WIF continues to drop, key support zones to watch out for include the $2.896 level, which has previously acted as a critical point for price stabilization. Below this, the next support level to monitor is positioned around $2.257, where WIF may find additional buying interest. A break below these levels could open the door to further declines toward other psychological support zones.

Conversely, if WIF breaks below the $2.896 support level, it could signal the start of a bullish comeback, potentially pushing the price back above the $3.582 level and toward higher resistance points.

WIF

Analysts Bullish On Dogwifhat (WIF) $5 Target As Price Retests $4 Resistance

Solana-based Memecoin Dogwifhat (WIF) is among the tokens leading the crypto market. The cryptocurrency surged over 40% in the last 24 hours, breaking above the $4 resistance zone following its Coinbase listing. As a result, some market watchers forecasted a massive WIF rally before year-end.

Dogwifhat Rallies 40% Amid Coinbase Listing

Dogwifhat has been one of the best-performing memecoins of this cycle, seeing a 2000% surge to its $4.83 all-time high (ATH) in March. The token led the Solana meme frenzy during Q1 but faced a significant 66% price drop in the following months while the market retraced.

As the crypto market regained momentum, the token broke above the crucial $2 resistance zone, reclaiming this level as Q3 closed. Since Trump’s victory in the US presidential elections, WIF has joined the market’s broader rally, breaking out of an 8-month downtrend.

WIF’s reclaim of the $3 mark earlier this week fueled investors’ bullish sentiment as the token reached levels not seen since June. Moreover, the cryptocurrency experienced a massive 40% rally in the last 24 hours after being listed on a major crypto exchange.

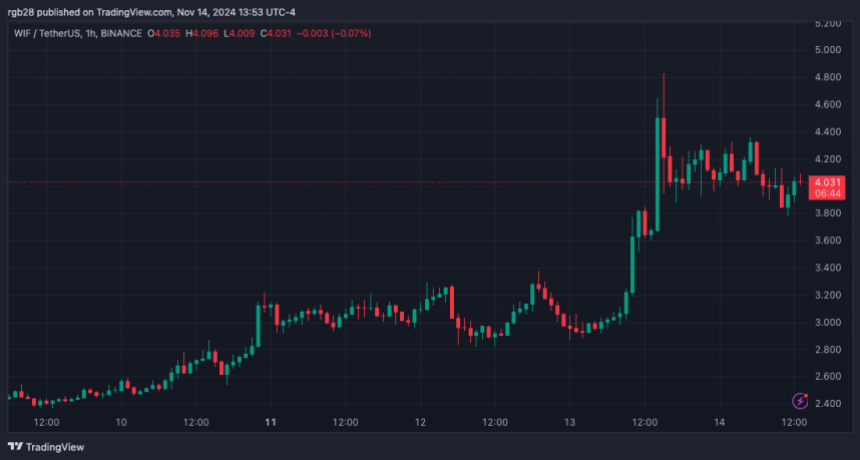
On Wednesday, Coinbase announced the listing of Dogwifhat alongside frog-themed memecoin PEPE. The news propelled a massive rally for the dog-themed token, sending its price from the $2.93 weekly low to the $4.00 resistance level.

On Thursday morning, the memecoin rallied toward the $4.30 mark, seeing its highest price since early April. Since the listing news, WIF has tried to turn the $4 resistance into support, briefly losing the level as Bitcoin (BTC) retraced to $87,000.

Despite the momentary retrace, Dogwifhat remained among the best-performing cryptocurrencies among the top 100 list, seeing a 9.9% increase in the last 24 hours, while the broader market bleed 2.2%.

WIF To $5 By Christmas Day?

Following its massive performance, some market watchers forecasted a $5 target for the cryptocurrency. Trader Koala suggested that WIF would see a deviation from its 24-hour $3.90-$4.30 range.

After the deviation, the analyst stated that the memecoin could see a bounce from the range’s lows toward the range highs before moving toward the $5 zone. The token has momentarily recovered from the drop below $4, trading at the range’s lower levels, just 16.4% below its ATH.

Meanwhile, another market watcher suggested that Dogwifhat could see a rally like Shiba Inu’s (SHIB) 2021 run. X user Sito noted that SHIB rallied 1800% after being listed in Coinbase, reaching its ATH of $0.00008616 42 days later.

Per the post, WIF could see its surge above the $50 mark if it performs similarly to SHIB’s price action post-Coinbase listing. Sito pointed out that this would lead to WIF’s price trading at $52 by Christmas day.

Moreover, he detailed that SHIB’s listing occurred towards the end of the previous bullish cycle, arguing that dogwifhat’s listing could be “even more bullish as it would allow for more organic growth.”

As of this writing, WIF is trading at $4.05, a 71.6% surge in the last seven days.

dogwifhat, WIF, WIFUSDT

Dogwifhat (WIF) Shines With 15% Rally In The Past Week — Is $2.8 The Next Stop?

The emergence of Donald Trump as the president-elect of the United States has been one of the biggest catalysts the crypto market has seen this year. The meme coin market has largely benefited from the recent bullish sentiment in the crypto industry, with the price of Dogwifhat (WIF) also running rapidly to the upside.

Although this spurt of bullish momentum has drawn the attention of traders and other market participants, several investors are still treading with caution while anticipating a brief pullback. However, a prominent crypto analyst believes it is time to buy and has come forward with an audacious projection for the price of Dogwifhat.

Solana-based Meme Coin Dogwifhat To Rally 20% — Here’s How

In a November 9 post on the X platform, crypto pundit Ali Martinez shared an exciting analysis of the WIF price, explaining that the meme coin might not be done just yet. Based on recent price action, the Dogwifhat token appears to be in line for a sustained upward price run.

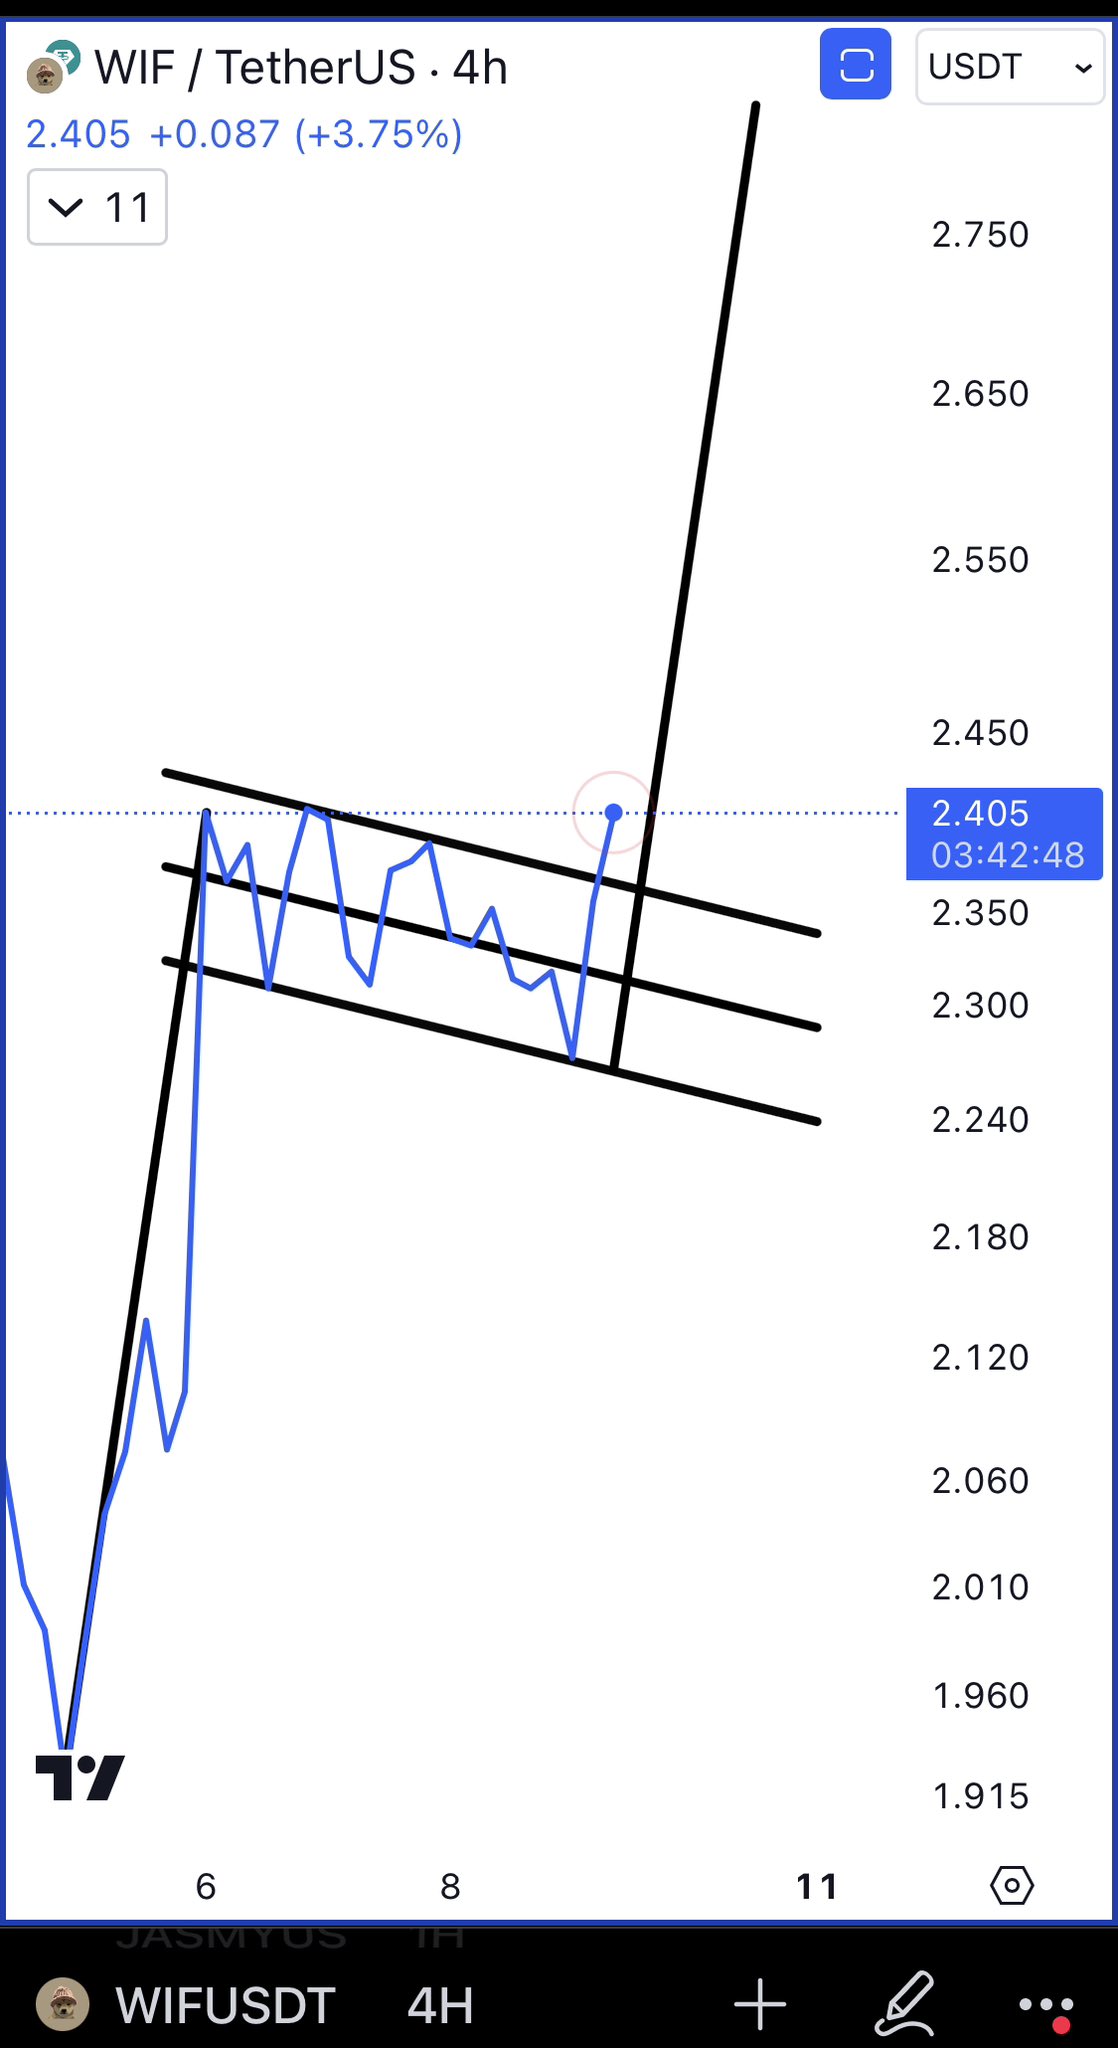
The rationale behind this projection is the formation of a bull flag pattern on the 4-hour chart. A bull flag pattern is a chart formation used in technical analysis and is characterized by a period of steep upward price movement (the flagpole) and a short period of consolidation or slight downward trend (the flag).

The bull flag typically acts as a strong continuation pattern for an upward price trend. However, it is important to look out for a price breakout to the upside of the flag in order to confirm the trend continuation prognosis.

Dogwifhat

As shown in the chart above, the price of Dogwifhat appears to be breaking out of the flag, suggesting the potential persistence of the upward trend. Should this breach be successful, it is worth noting that the breakout usually replicates the length of the initial flagpole.

Using this first flagpole as a template, Martinez placed the price target for the Solana-based meme coin at $2.84, which represents a 20% increase from the current price point. 

WIF Price At A Glance

As of this writing, the price of Dogwifhat stands at around $2.40, reflecting a 5.9% increase in the past 24 hours. This single-day action has further improved the meme coin’s performance on the weekly timeframe, bringing it up to 14.6% in the past seven days.

Dogwifhat

Dogwifhat (WIF) Prepares For A Bullish Breakout – Analyst Sets $3 Target

Dogwifhat (WIF) has emerged as one of this cycle’s standout meme coins, and a major move might be imminent. WIF is trading just above $2.5, a key support level that top analyst and investor Ali Martinez believes could be a launchpad for a 17% surge to the $3 mark. 

Martinez shared a technical analysis highlighting WIF’s strong base above $2.5, signaling that bullish momentum is building for the token.

As WIF holds above this crucial level, investor optimism and trading volume are rising, suggesting that both short-term and long-term holders are preparing for another leg up. The next few days—or even hours—could be decisive, as WIF sits at a pivotal point that could set the stage for significant gains. 

With interest in meme coins surging and market sentiment favoring breakout plays, Dogwifhat is on track to test the $3 mark soon. If WIF breaks through, it may continue to draw more interest as one of the leading tokens in this meme coin cycle.

Dogwifhat Holding Above Key Support Level

Dogwifhat (WIF) has remained in a consolidation phase after reaching a local high of $2.97, now stabilizing above a crucial support level at $2.5. According to top analyst Ali Martinez, this consolidation period could set the stage for a breakout. 

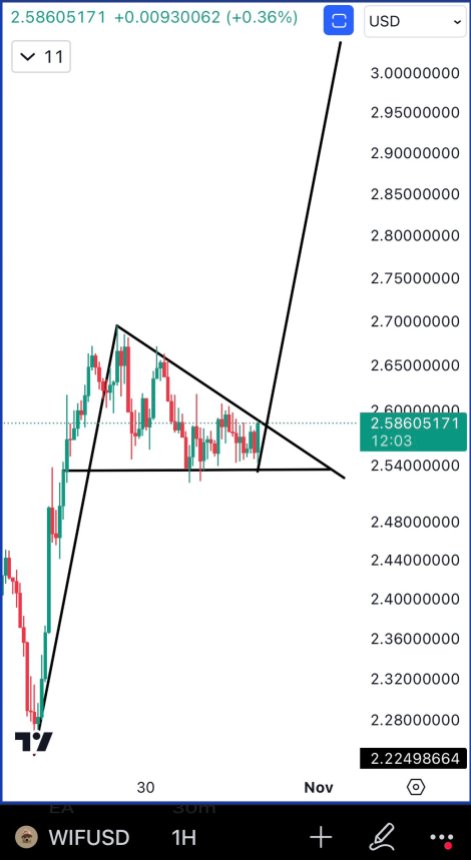
Martinez shared a technical analysis on X highlighting a bullish pattern forming on WIF’s 1-hour timeframe, suggesting that the token may soon be ready to push higher.

Dogwifhat bullish pattern formation (1H)

Martinez’s analysis indicates that WIF’s resistance level within this bullish pattern sits around $2.6. Should WIF break above this key resistance, a surge to the $3 mark is anticipated, which could spark renewed interest in the token. 

As meme coin traders know, FOMO (fear of missing out) can drive demand rapidly, especially for tokens with strong online communities and viral appeal. A move above $3 could position Dogwifhat as a top contender among this cycle’s meme coins, potentially leading to increased trading volume and broader market interest.

However, broader market conditions, particularly Bitcoin’s price action, will play a crucial role in determining whether WIF and other meme coins continue their uptrend. Many traders and analysts are watching Bitcoin closely, as a push above its all-time high could catalyze a rally across the entire market.

 If BTC breaks into new highs, the resulting optimism and influx of capital could serve as the final push that Dogwifhat needs to leap to the $3 mark and beyond. Until then, WIF remains in a holding pattern, with its potential for a breakout hinging on technical triggers and broader market sentiment.

WIF Technical Levels To Watch

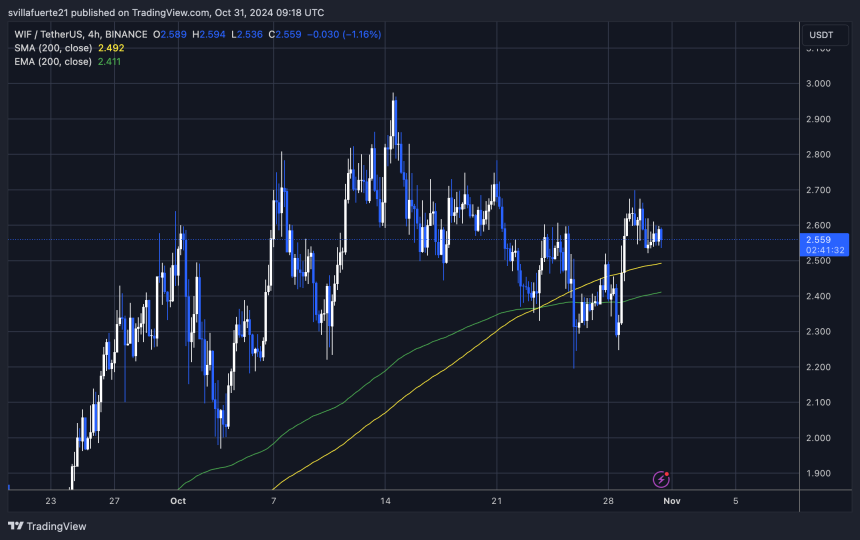
Dogwifhat (WIF) trades at $2.56, breaking above the 4-hour 200 moving average (MA) set at $2.49. This move above the 200 MA signals bullish momentum, and WIF firmly holds the $2.52 level. Previously a resistance, this $2.52 mark supports the token’s uptrend.

WIF holding above the $2.5 level

For WIF bulls to build further momentum, the price must push past the $2.7 mark, potentially paving the way for a run to local highs around $3. Breaking through these levels could attract renewed buying interest, especially as the market anticipates broader upward movements in leading assets. 

However, should WIF fail to maintain its position above the $2.5 mark, it may face a pullback, with support likely in a lower demand zone around $2.41.

This consolidation period and test of new support levels could ultimately strengthen the foundation for a sustained uptrend. For now, the $2.5 support remains critical as bulls look to gather strength for a possible push higher. 

Featured image from Dall-E, chart from TradingView

WIF Price Approaches $2.89 Resistance As Bulls Regain Control

Dogwifhat (WIF) has resumed its upward trajectory, with the price approaching the key $2.89 level as bulls take back control. After a period of consolidation, renewed buying pressure has fueled the meme coin’s rise, signaling that momentum is once again favoring the bulls. With increased buying pressure and positive market sentiment, WIF is showing signs of an impending uptrend. 

As WIF edges closer to this significant resistance level, this article will assess its recent price action, highlighting the bulls’ regained strength. Through an analysis of key technical indicators and market dynamics, this piece seeks to evaluate whether the current bullish momentum is strong enough to push WIF past the $2.89 resistance, signaling the potential for further upward movement.

Market Sentiment Shifts: Bulls Take Charge As Buying Pressure Increases

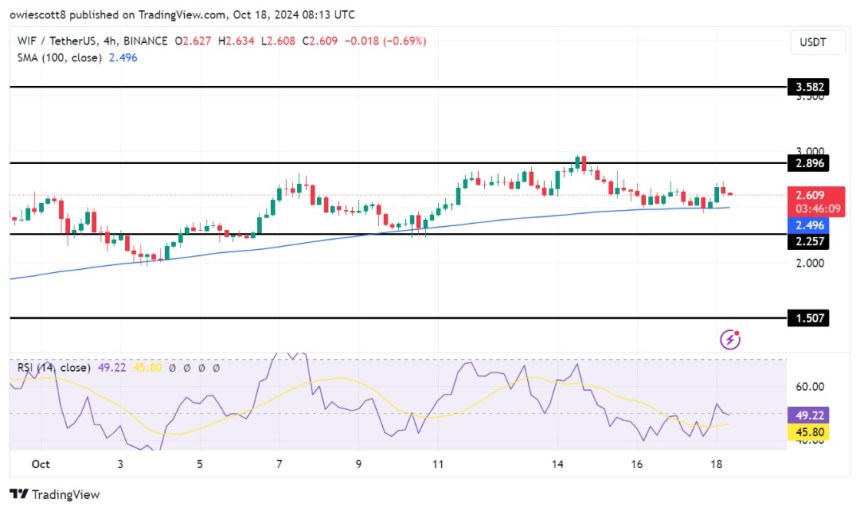
WIF has consistently held its position above the 100-day Simple Moving Average (SMA) on the 4-hour chart, signaling upside movement. Recently, the asset experienced a rebound from the $2.45 support level, further enhancing positive market sentiment.

WIF

If the price remains above the SMA, it could establish a solid foundation for another upward movement toward the $2.89 resistance level. This combination of support and bullish arrows suggests that WIF is well-positioned for more gains in the near term.

An analysis of the 4-hour Relative Strength Index (RSI) indicates renewed upside potential, with the RSI climbing to 49% after previously dipping to 41% suggesting that buying momentum is gaining strength as the market shifts from a bearish phase toward a more neutral stance.

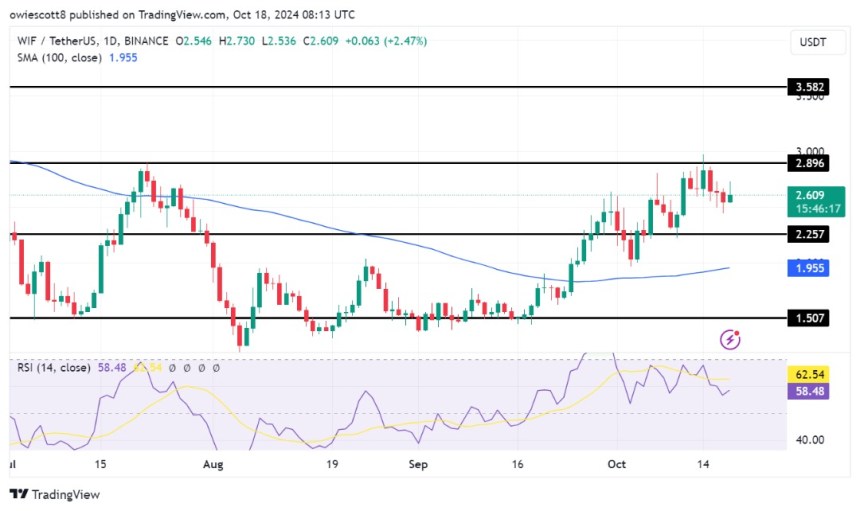
Additionally, the daily chart shows that WIF is facing significant upward pressure, as evidenced by attempts to form bullish candlesticks. This positive trend is further supported by the asset’s position above the critical $2.20 support level and the 100-day SMA. As WIF continues on this path, it strengthens the optimistic sentiment in the market, paving the way for additional gains as it nears the $2.89 mark.

WIF

Lastly, the RSI on the daily chart is currently at 58%, having recently recovered from a dip to the 56% threshold. Should the RSI continue to climb, it could signal further strength in WIF’s price action. Furthermore, a sustained move above the 60% mark could enhance the likelihood of continued upbeat momentum and potential breakouts, reinforcing the positive outlook for the asset.

Key Resistance At $2.89: Can WIF Break Through?

WIF’s price could reach the $2.89 resistance level if it demonstrates sustained bullish pressure, bolstered by strong buying volume and positive market sentiment. A successful breakout above $2.89 may pave the way for further gains, possibly leading to new highs and increasing investor interest.

Conversely, if WIF fails to break through this level, it could lead to a pullback, causing the price to drop toward the $2.25 support level. Should it fall below this mark, the meme coin may continue its decline, potentially targeting the $1.50 level and beyond.

WIF

Solana’s Dogwifhat Meme Coin Flashes Buy Signal At $2.5, Is It Time To Jump In?

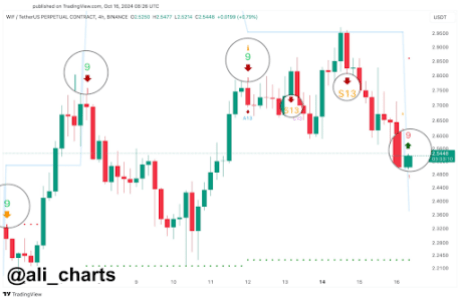
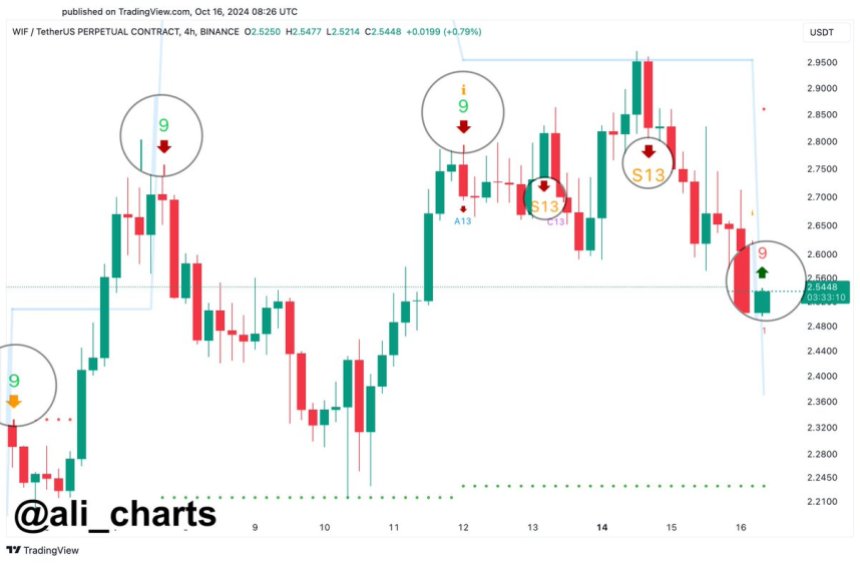
According to a technical indicator, Solana-based meme coin Dogwifhat is gearing up for an upside move. Top analyst Ali Martinez recently shared a bullish perspective for Dogwifhat on social media platform X, with the TD Sequential indicator indicating a buy signal.

TD Sequential Flashes Buy Signal At $2.5

As Ali Martinez noted, the TD Sequential has been highly spot on with predicting trends in the price of Dogwifhat for a while now. The TD Sequential indicator consists of two phases: a setup phase, which generates a count from 1 to 9 based on a specific price, and a countdown phase, which also counts down based on previous price action. 

Martinez shared insights from the WIF/Tether US 4-hour candlestick price chart, illustrating that the TD Sequential indicator has consistently delivered accurate buy and sell signals for Dogwifhat since the beginning of October. As it stands, the indicator is now pointing toward a buy signal. For a buy setup on the TD Sequential, the current candle’s close must be lower than the close of the previous four candles.

At the time of writing, Dogwifhat has experienced a correction of approximately 14% over the past three days, having peaked at $2.958 on October 14. However, the TD Sequential on the 4-hour candlestick chart is now pointing towards the continuation of a larger upward trend for the rest of the month.

Dogwifhat

What’s Next For The Dogwifhat Price?

Dogwifhat’s popularity kicked off in early 2024 when the meme coin community enthusiastically dubbed it the “Shiba Inu Killer.” Dogwifhat, which started the year around $0.15, was shot into the spotlight in March and April during a frenzy surrounding Solana-based meme coins in the first half of 2024. 

This surge in interest caused Dogwifhat to go on a price rally, culminating in an all-time high of $4.83. Following this all-time high, the meme coin experienced a substantial correction and is now characterized by smaller rallies and corrections. However, it still remains the largest Solana-based meme coin with a market cap of $2.56 billion.

Even with the recent price decline over the past three days, Dogwifhat has managed to maintain impressive gains of around 68% over the past 30 days. Now that the TD Sequential indicator is printing a buy signal, this price increase is expected to continue for the rest of what looks like a bullish October. At the time of writing, the Solana-based meme coin is trading at $2.57, with a bullish price target of $4 before October comes to a close.

Solana, on the other hand, hasn’t been able to keep up with Dogwifhat gains in the past 30 days. At the time of writing, Solana is trading at $153, up by 15% in the same 30-day timeframe.
Dogwifhat price chart from Tradingview.com (Solana meme coin)


Strong Buy Signal For DogWifHat (WIF) – Key Indicator Hints At Rally To $4

DogWifHat (WIF) is emerging as one of the top meme coins in the market, currently testing a critical liquidity level that could propel the price to new highs. 

As the broader crypto market navigates a period of volatility and uncertainty, traders eagerly search for confirmation of a potential rally. WIF, which has gained significant traction in recent months, is now at a crucial point where the next move could define its short-term future.

Prominent analyst and investor Ali Martinez has shared insightful data suggesting a bullish outlook for DogWifHat. Metrics point toward a rise in price action, which could lead to a breakout, with WIF potentially surging to the $4 mark if momentum continues to build. 

However, the coming days will be key in determining whether a bull trend can be confirmed as market participants await signs of sustained upward movement. All eyes are on WIF to see if it can capitalize on this moment and rally to new heights.

DogWifHat Turning Point 

DogWifHat (WIF) is at a critical turning point, with its price hovering just above the $2.5 mark, a crucial psychological level for confirming an ongoing uptrend. Investors and traders are closely watching this level, as its ability to hold will determine whether WIF pushes to new highs or retraces to lower demand zones.

Top analyst Ali Martinez recently shared a technical analysis on X, revealing that a buy signal has appeared for WIF on a key indicator, the TD Sequential. 

DogWifHat TD Sequential indicator showing a buy signal

The TD Sequential, known for accurately predicting trend reversals in the crypto market, has previously been spot-on for DogWifHat. According to Martinez, this new buy signal could be the catalyst that sends WIF into a bullish phase, fueling optimism among investors.

The overall sentiment in the market is also leaning toward a potential surge as volatility continues to rise and other major cryptocurrencies show signs of life. Martinez’s analysis supports the growing belief that WIF could be on the verge of a breakout, especially if it holds the $2.5 level. 

However, if the price fails to maintain this support, investors expect a drop to lower demand levels. In the coming weeks, WIF’s price movement will be pivotal in determining whether the meme coin continues its upward trajectory or faces further corrections.

WIF Technical Analysis 

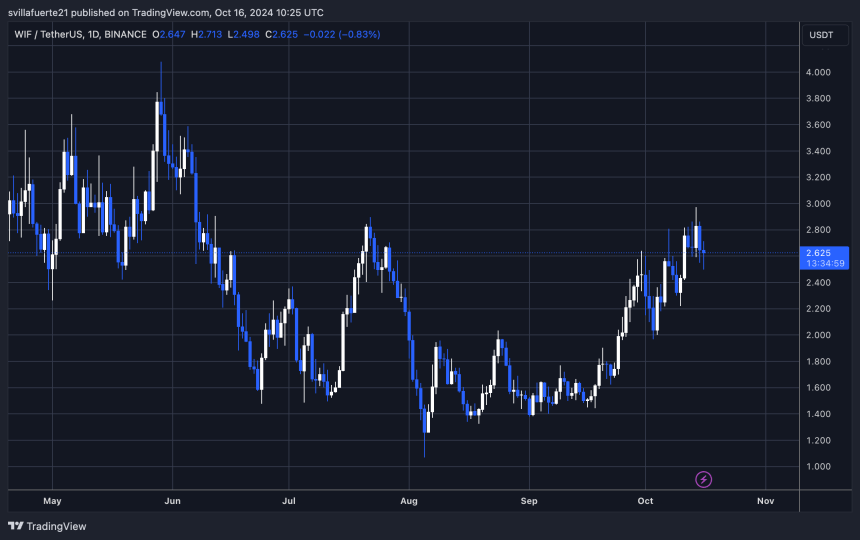
WIF is currently trading at $2.62 after experiencing a few days of volatile price action within a sustained uptrend. On Monday, the price set a new high at $2.97 but has since retraced slightly and is now testing crucial demand at a previous resistance level of around $2.5. 

WIF is testing a crucial support around $2.5

This level is key for bulls, as holding above $2.5 would maintain the upward momentum and set WIF up to target the $3 mark, in line with the broader market’s continued push upward.

However, should WIF fail to hold the $2.5 level and close below it, this could indicate a shift in the price structure and signal the start of a correction. 

Traders are keeping a close eye on these levels, as a drop below $2.5 would suggest weakening bullish momentum and the potential for a pullback to lower support areas. The next few days will determine whether WIF continues its uptrend or faces a short-term retracement.

Featured image from Dall-E, chart from TradingView

WIF Bulls Charge Toward $2.89 As Key Resistance Test Looms

Recent trading activity reveals that WIF is gaining bullish momentum, with its price surging toward the critical $2.89 resistance level. After a brief pullback, buyers are stepping in, driving the asset higher and setting the stage for a potential breakout. A successful break could open the door to new gains, further reinforcing the positive sentiment in the market.

As the price approaches this crucial level, the goal of this analysis is to determine whether WIF can sustain its upward strength and break through the $2.89 resistance. By evaluating key technical indicators, price trends, and market sentiment, this review will delve into the possible outcomes of this pivotal test, assessing the likelihood of either a continued rally or a possible pullback.

Current Price Momentum: WIF Push Toward $2.89

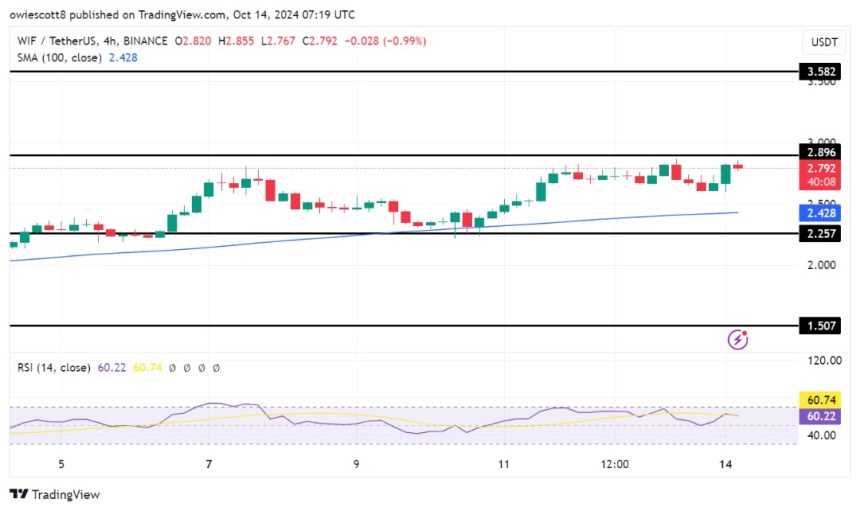
WIF is exhibiting strong bullish momentum following a recovery from the $2.6 support level. By consistently trading above the 100-day Simple Moving Average (SMA), the cryptocurrency indicates that buyers are firmly in control, reflecting a strengthening trend. Maintaining this position could enhance optimistic sentiment and generate the push necessary to challenge higher resistance levels, particularly the $2.89 mark.

WIF

An analysis of the 4-hour Relative Strength Index (RSI) indicates a renewed upbeat potential, with the RSI climbing back to 62% after dipping to 50%. If the RSI continues to rise, it could point to further gains for WIF, as the asset regains strength and attracts more bullish traders aiming to push the price toward key resistance zones.

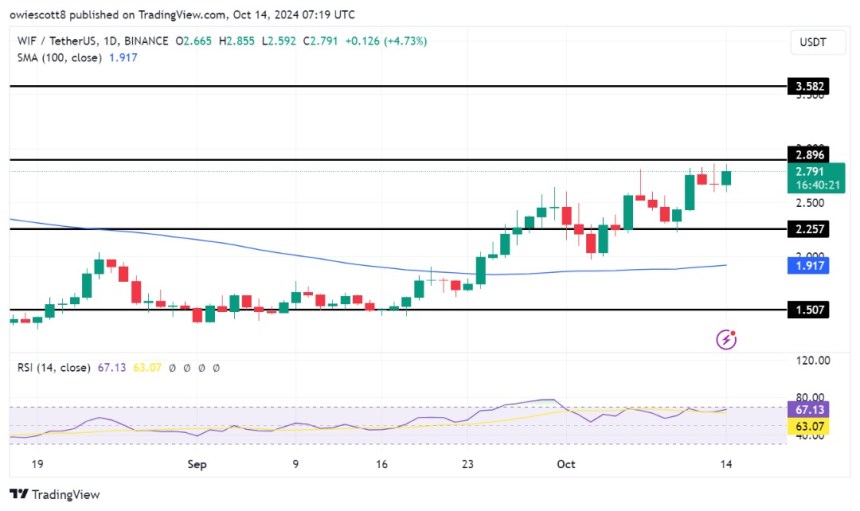
Furthermore, the daily chart indicates that WIF is under significant upward pressure, marked by a bullish candlestick formation after rebounding from $2.6 and trading above the 100-day SMA. This suggests strong buyer activity, positioning the meme coin to challenge the critical resistance level of $2.89. 

WIF

Also, the RSI on the daily chart currently stands at 66%, comfortably above the 50% threshold, indicating a positive shift in momentum for WIF.  A sustained position above 50% generally signifies that buyers are in control. If this pressure continues, it could lead to more price appreciation as traders remain optimistic about the asset’s potential to break through key resistance levels.

Potential Outcomes: Rally Continuation Or Pullback?

A continuation of the current rally could see WIF breaking above the $2.89 resistance, paving the way for further gains and possibly reaching new highs. This scenario is supported by the positive momentum indicated by the RSI and the price’s position above the 100-day Simple Moving Average.

Should WIF fail to break through the $2.89 resistance, it could face a pullback toward the $2.2 support level. A drop below this support would raise doubts about the sustainability of the current upward movement, potentially triggering a more significant decline toward the $1.5 support level.

WIF

WIF Bulls In Control As RSI Signals Strong Upside Potential

WIF is showing impressive strength as bullish momentum takes control, with the Relative Strength Index (RSI) pointing to even greater upside potential. The current RSI reading suggests that buying pressure remains strong, fueling optimism for continued gains. While bulls hold their ground, they are increasingly confident that WIF could be poised for a significant breakout toward the $2.8 mark. 

As market sentiment shifts favorably, this article aims to explore the bullish dominance in WIF, with a focus on how the RSI signals promising upside potential. By analyzing key technical indicators and market trends, the objective is to assess whether WIF can maintain its upward momentum and successfully break through upcoming resistance levels.

Bullish Sentiment Strengthens: Will WIF Break $2.6?

On the 4-hour chart, WIF has displayed robust bullish momentum after successfully breaking above the $2.2 mark. This upward surge has pushed the price closer to the $2.8 resistance level, setting the stage for a potential breakout. 

As the bulls continue to assert control, this resistance level becomes a critical hurdle. A decisive move above $2.8 could open the door for further gains, attracting more buying interest and potentially leading to new highs.

WIF

An analysis of the 4-hour Relative Strength Index (RSI) indicates a renewed potential for upward movement, with the RSI climbing back to the 68% level after previously dipping to 62%. If the RSI continues to rise, WIF may push higher, possibly breaking through key resistance levels.

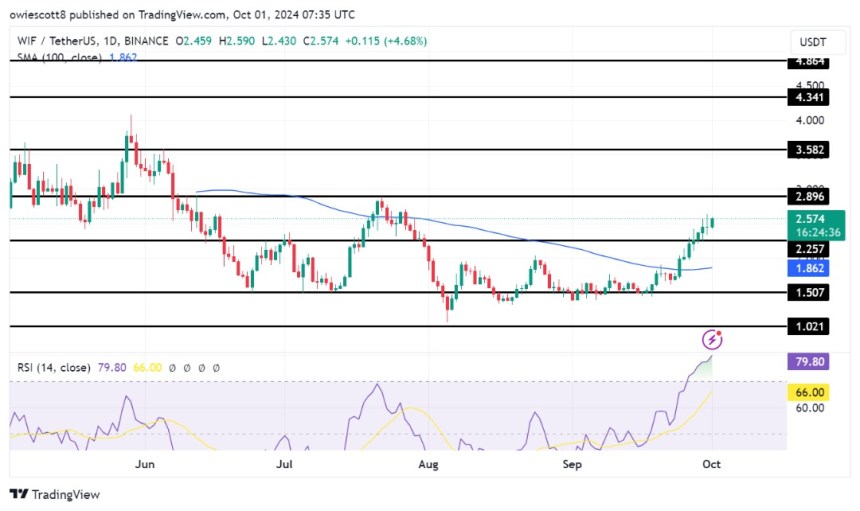
Furthermore, WIF has decisively surpassed the 100-day Simple Moving Average (SMA) and the $2.2 level on the daily chart, marking a notable shift in its price momentum. By holding above these key levels, the asset demonstrates its strength and reinforces a bullish outlook. This optimistic trajectory is not simply a temporary fluctuation. Rather, it reflects robust buying interest and heightened market confidence, suggesting that WIF is ready for additional gains soon.

WIF

The Relative Strength Index (RSI) on the daily chart is currently at 79%, showing no signs of declining in the near term. An elevated RSI level implies that WIF is in overbought territory, signifying strong buying pressure and heightened market enthusiasm. Although high readings can point to potential exhaustion in upward movement, the absence of immediate signals for a pullback suggests that bullish sentiment is still prevalent.

What To Expect In The Short-Term For The Meme Coin

Presently, WIF is demonstrating strong positive motion, prompting traders and investors to monitor key levels for potential price movements. Maintaining its position above the 100-day Simple Moving Average (SMA) and the $2.2 mark could lead to more gains, with the $2.6 resistance level on the horizon. A successful breakout above $2.6 may unlock additional price growth and enhance traders’ optimism, signaling a more sustained upward trend.

However, with the Relative Strength Index indicating overbought conditions at 79%, a price correction could occur if buying pressure wanes, causing WIF’s price to start dropping toward the $2.2 mark for a retest.

WIF

Bitcoin To $80,000, Dogwifhat To $7, And Fantom To $1? Analyst Shares ‘Realistic Targets’

Crypto analyst Wisdom Matic has shared realistic price targets for Bitcoin (BTC), Dogwifhat (WIF), and Fantom (FTM). The analyst suggested that these coins would reach these price levels in this bull run, although he didn’t state when exactly it would happen. 

Bitcoin, Dogwifhat, And Fantom To Reach These Price Targets

Wisdom Matic predicted in an X post that Bitcoin would reach $80,000, Dogwifhat would reach $7, and Fantom would reach $2. He claimed these were realistic targets compared to other predictions, providing a more bullish outlook for these coins. However, the analyst failed to state whether these price targets represented the market top for these coins or were prices he expected these coins to reach soon enough. 

However, based on market experts’ predictions, Wisdom Matic’s predictions will likely be short-term targets. Experts like Standard Chartered and Bernstein have predicted that Bitcoin could at least reach $100,000 in this bull run. Interestingly, Standard Chartered predicted that BTC could reach this price level even before the US elections on November 5. Meanwhile, they added that Bitcoin could reach $150,000 by year-end if Donald Trump wins the election. 

Bernstein analysts predicted that Bitcoin could rise to as high as $90,000 if Trump wins, although they still see the flagship rising above $100,000 before the market peaks. Meanwhile, in a recent market update, 10x Research founder Markus Thielen predicted that Bitcoin could rise to $75,000 by late October as it breaks its current all-time high (ATH) of $73,000. 

Bitcoin’s rise to a new ATH this month is also supported by the fact that the flagship crypto usually records double-digit gains in October. Therefore, a repeat of these double-digit gains would easily send the BTC price above $70,000 and on its way to a new ATH. 

The Altcoins Also Boast Bullish Outlooks

Dogwifhat and Fantom can undoubtedly reach Wisdom Matic’s price targets, as they both boast bullish outlooks. As the foremost meme coin in the Solana ecosystem, Dogwifhat moves alongside SOL and is bound to rise as SOL surges. 

Solana’s fundamentals are currently bullish, which supports the price rise. Some of these bullish fundamentals include the plan to launch the Solana Seeker mobile next year. Meanwhile, institutions like Franklin Templeton and Citibank want to adopt the Solana network for their tokenized offerings. Wisdom Matic predicted that SOL will reach $350, representing a new ATH for the coin. 

Fantom’s outlook is also bullish because of its fundamentals. Fantom is set to transition to Sonic sometime in November or December of this year. Sonic will be EVM-compatible, ensuring that decentralized applications (dApps) on other EVM chains can be integrated onto the network. Andre Cronje, Sonic’s co-founder has also hinted at potential decentralized finance (DeFi) plans for the Sonic ecosystem, which is also bullish for the FTM price as it could aid the coin’s adoption among DeFi users. 

Bitcoin price chart from Tradingview.com (Fantom Dogwifhat)

Dogwifhat Rally Far From Over As Analysts Predicts 1,600% Jump

Shiba Inu Killer Dogwifhat (WIF) has rallied substantially since the middle of September. Notably, the meme coin has rallied by about 32% in the past seven days, allowing it to outperform many cryptocurrencies and meme coins. Notably, this rally has prompted many bullish forecasts for the cryptocurrency. 

Dogwifhat Back In The Spotlight

Dogwifhat’s rise to prominence began in early 2024, as the meme coin community embraced it as a “Shiba Inu Killer.” Dogwifhat, which started the year around $0.15, was shot into the spotlight in March and April as part of the craze surrounding Solana-based meme coins in the first half of 2024. This saw the meme coin surging by over 3,100% to peak at $4.84. Although the meme coin’s price has corrected since then, it continues to be popular among meme coin investors and is supported by a strong online community.

Dogwifhat has posted incredible gains in September and is currently up by 9.5% in the past 24 hours. Renowned crypto analyst Rekt Capital suggests that Dogwifhat’s recent breakout of its multi-month downtrend is just the beginning. According to him, this move is one of the first signals of a broader altcoin rally, which he forecasted in a previous analysis. Furthermore, the analyst noted that WIF is on the cusp of beginning a new macro uptrend.

Adding to the positive sentiment, another crypto expert, Gumshoe, highlighted a key development in WIF’s market activity. According to him, $35 million worth of Dogwifhat has been transferred from crypto exchange Binance into self-custody wallets in the past seven days. Such withdrawal transfers suggest growing investor confidence in holding WIF long-term.

According to a WIFUSDT chart posted on social media platform X by another crypto trader going by the name Sito, WIF’s breakout has seen the crypto flipping the 4-hour 200-moving average. The last time this technical move occurred was back in February, and it led to a staggering 1,600% gain over 48 days. Sito speculated that if history were to repeat itself, Dogwifhat could once again experience a massive price surge, potentially reaching $25 in the coming weeks.

What’s Next For Dogwifhat?

At the time of writing, Dogwifhat (WIF) is trading at $2.4. Replicating a 1,600% jump might be more challenging this time around. Given the current price levels, it would require a much larger influx of capital to achieve such a dramatic increase in value compared to earlier this year.

However, this doesn’t take away the fact that the meme coin is at the cusp of a continued momentum to the upside. The first step is breaking above a July order block around $2.665. A successful break above this would set the stage for additional price gains up until its recent all-time high of $4.84.

Dogwifhat WIF price chart from Tradingview.com

DogWifHat Whale Doubling Down, Buys More WIF: All-Time High Incoming?

Meme coins are bouncing higher, looking at CoinMarketCap data as of September 27. Dogecoin, the world’s largest meme coin by market cap, is up 16% over the last trading week. Shiba Inu and Pepe rallied in the same period, adding 37% and 27%, respectively.

The expansion of meme coin prices has also been a boom to DogWifHat (WIF). Solana’s largest meme coin by market cap is up 14% on the last day, pushing weekly gains to over 31%. At the current valuation, WIF is the fourth most valuable coin, trailing Dogecoin, Shiba Inu, and Pepe.

DogWifHat Whale Accumulating, Meme Coin Soaring

Lookonchain data reveals that a meme coin whale accumulates as WIF prices tick higher. Tracking the address’ movements, the largest WIF holder, data shows, appears to be steadily accumulating.  

By buying as prices begin to recover from their August and September lows, the move is an endorsement of the meme coin’s potential in the coming months.

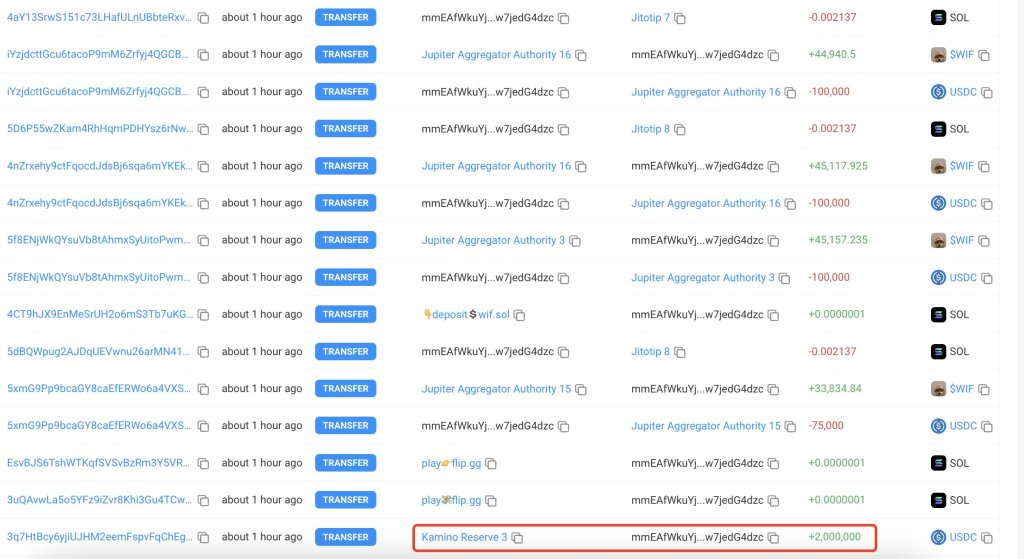
On September 26, the whale borrowed 2 million USDC and bought 894,854 WIF at $2.24. Adding to his stash, the address now controls over 32 million WIF. This holding, Lookonchain analysts estimate, pushes the whale’s profits to over $86 million.

DogWifHat whale accumulating | Source: @lookonchain via X

However, the whale’s borrowing of USDC and purchase of WIF is not the first time. Mid this week, the same address borrowed 4.5 million USDC from Kamino and bought 2.55M WIF at $1.76.

Looking at this trend, it is evident that the whale expects prices to continue printing higher highs. The daily chart shows that the meme coin is picking up steam.

DogWifHat prices trending upward on the daily chart | Source: WIFUSDT on Binance, TradingView

After sinking to March 2024 lows, the meme coin has recovered, doubling to spot rates. If WIF prices soar above $2.8 and July highs, there could be more room for growth.

Ultimately, the medium-term target would be $4.8, a level last printed in March. However, for this to happen, WIF prices must more than double from spot rates.

Will WIF Follow Popcat And Register Fresh Highs?

The likelihood of WIF printing new all-time highs in the coming weeks or months cannot be discounted. Popcat, another meme coin on Solana, recently broke higher, registering new all-time highs above $1. At spot rates, the token is up nearly 120% in Q3 2024, attracting interest from whales.

After exiting for a loss, losing $611,000, Lookonchain data shows that the whale re-entered the Popcat market, spending $1.29 million worth of SOL to buy 1.3 million POPCAT at around $1. From the daily chart, a close above $1 will be crucial in sustaining the upside momentum.

WIF Bulls Push Hard Toward $2.1 Resistance Amid Market Optimism

Dogwifhat (WIF) is on the verge of a major breakout, with bulls targeting the $2.1 level as upward momentum continues to build. After a strong period of gains, all eyes are on whether this momentum can trigger the price past this critical resistance. A successful push could ignite a broader rally, further solidifying WIF’s bullish outlook.

As the market heats up, this article seeks to analyze WIF’s price action as it approaches the critical $2.1 resistance level, focusing on the bullish strength that has driven recent gains. By examining technical indicators, market sentiment, and potential key levels, the goal is to assess whether the bulls can sustain their push and trigger a breakout, or if bearish pressure may halt the rally.

WIF, with a market capitalization surpassing $2.1 billion and a trading volume of over $528 million, was trading at around $2, indicating an 8.15% increase at the time of writing. In the last 24 hours, its market cap rose by 8.14%, while trading volume saw a decrease of 27.81%.

Bulls Push Gains Steam: Can WIF Surpass The $2.1 Barrier?

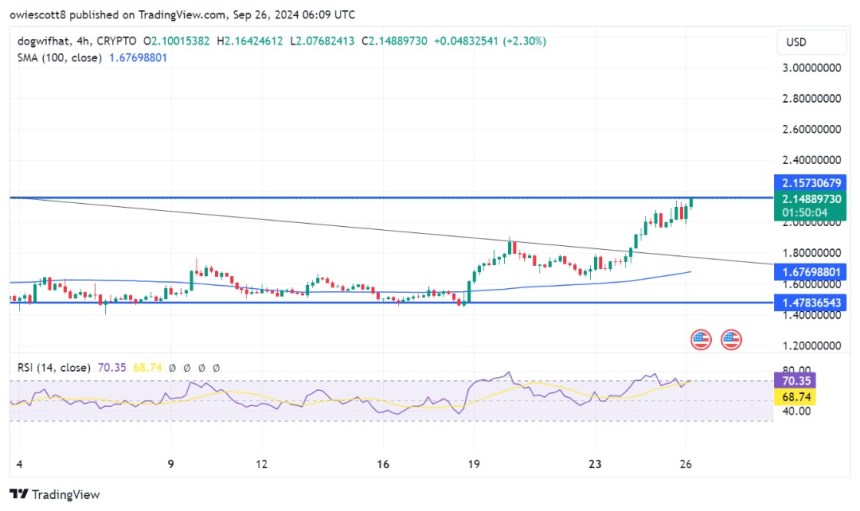
Following the recent trendline break, WIF’s price on the 4-hour chart has continued to gain momentum as it reaches $2.1, with the purpose of breaking past it. WIF is also trading above the 100-day Simple Moving Average (SMA), suggesting a positive upward trend that could lead to a potential breakout.

WIF

An analysis of the 4-hour Relative Strength Index (RSI) suggests a potential for further upward movement. The RSI has risen again to the 70% threshold after previously dropping to 63%, indicating that positive movement is gaining strength.

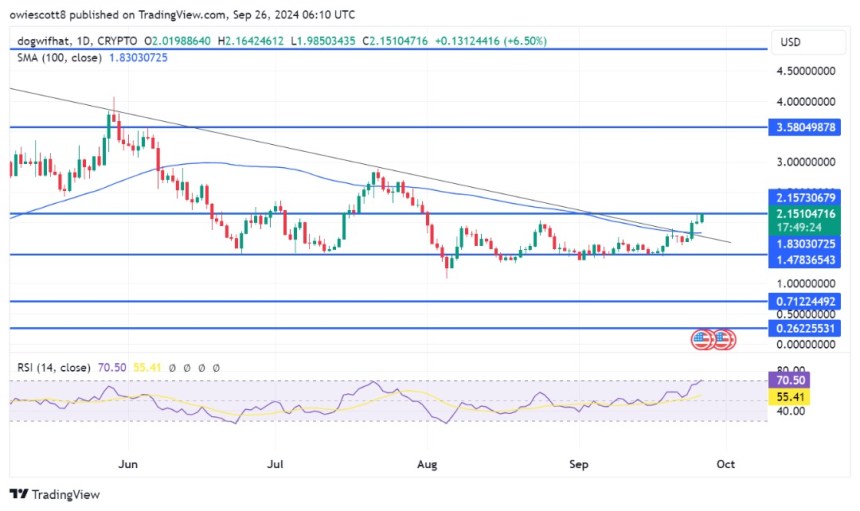
On the daily chart, WIF shows strong upside movement, reflected in multiple bullish candlesticks following a successful move above the 100-day SMA. This rising strength suggests that bulls are actively in control and may push the cryptocurrency higher, aiming to surpass the $2.1 mark.

WIF

Finally, on the 1-day chart, a detailed examination of the RSI formation indicates that WIF may maintain its optimistic trajectory as the indicator’s signal line has risen above the 50% threshold and is currently positioned at 70%, displaying a sustained bullish outlook.

How High Can The Meme Coin Go Post-Breakout

If the upbeat momentum continues and WIF successfully breaks through the $2.1 resistance level, it could target the next resistance level at $3.5. A decisive move above this level might pave the way for additional gains, possibly reaching its all-time high of $4.8 and beyond.

Conversely, if the breakout leads to profit-taking or bearish sentiment, WIF may retrace to the previous support level of $1.47. When this level is breached, it could result in deeper declines, potentially dropping toward $0.7122 and other lower ranges.

WIF

Is DogWifHat (WIF) The “Most Bearish” Of All Major Meme Coins?

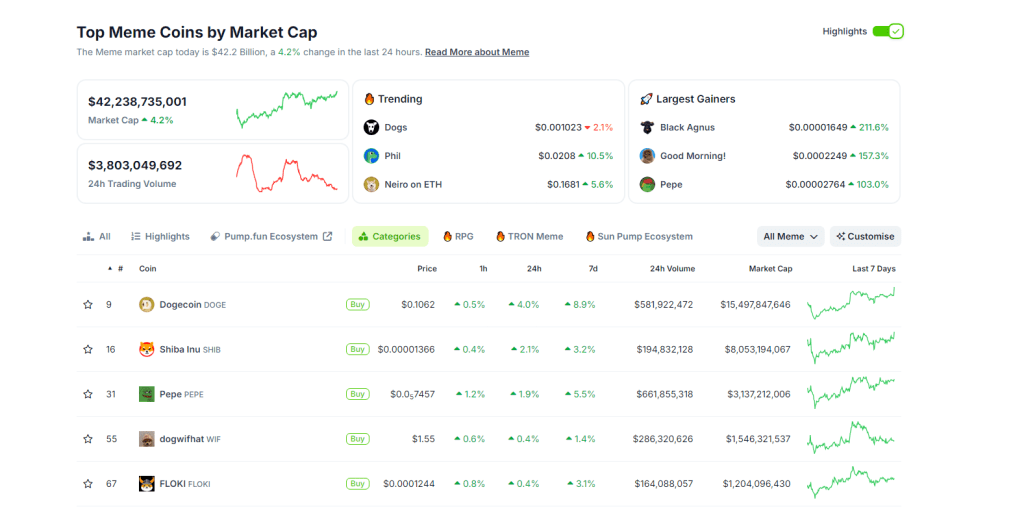
Meme coins have been sliding in recent weeks. According to Coingecko, all meme coins’ total market cap is around $42 billion.

Dogecoin remains the most valuable, with a market cap of over $15.4 billion, followed by Shiba Inu, which has a market cap of around $8 billion. It has been a turbulent few trading months for meme coins, whose valuation is down from over $65 billion in Q2 204.

Meme coins total market cap | Source: Coingecko

WIF Struggling, Is This The “Most Bearish Meme Coin”?

Though Bitcoin is turning the corner, a development that can yank top altcoins like Solana and meme coins higher, one analyst is bearish on DogWifHat (WIF). According to Coingecko, WIF is one of the top meme coins on Solana, commanding a market cap of over $1.5 billion and a slot in the top 5.  

While WIF might be up over 98,000% after dropping to all-time lows of $0.00155 in December 2023, the token is down 68% from recent all-time highs. WIF prices exploded, riding on Solana expansion and the meme coin fever that swept across the industry in the first half of the year.

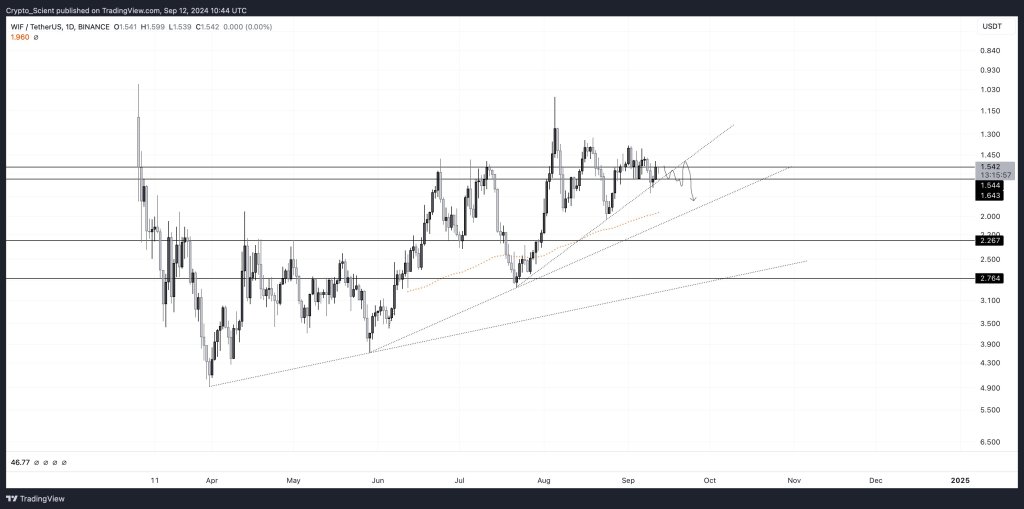
The analyst now thinks WIF will likely dump in the coming sessions. Driving this outlook is the state of the chart pattern, which points to weakness all through. From how the WIFUSDT chart is aligned, the token, the analyst claims, could be the “most bearish of all major meme coins.”

WIF is bearish | Source: @Crypto_Scient via X

Bulls Have A Chance If Bitcoin Recovers, DogWifHat Finds Resistance At $2

While there is optimism that WIF could bounce and benefit from the market-wide recovery, the current bearish structure damps optimism. From the analyst’s assessment, buying the meme coin at spot prices is risky. The only time traders can consider loading WIF is once it breaks out from the descending wedge, as is evident in the daily chart.

In summary, WIF is down nearly 50% from July highs. Although prices recovered after the bounce in early August, buyers didn’t build sufficient momentum to reverse losses. The immediate resistance is $1.99, while support is $1.30.

WIF price trending downward on the daily chart | Source: WIFUSDT on Binance, TradingView

For the uptrend to take shape, WIF bulls must break above $2, ideally with rising trading volume. In turn, this may set the momentum for another leg up that could see the token expand to as high as $3–or July highs in a bull bar continuation formation.

Dogwifhat (WIF) Leads Memecoins Recovery With 12% Jump, Is $2.2 The Next Stop?

This cycle’s dog-themed sensation, Dogwifhat (WIF), has become the leading memecoin amid the market’s recovery. The token saw a 12% surge in the early hours of Tuesday, propelling the price above the $1.6 mark. As the memecoin tries to reclaim key support levels, some crypto analysts forecasted WIF’s next targets.

Dogwifhat Leads The Memecoin Recovery

Dogwifhat (WIF) became the market sensation in Q1 after leading the memecoin frenzy. The token surged to its all-time high (ATH) of $4.83 at the end of March, pushed by the market sentiment and its growing community.

During its 2,000% growth phase, WIF saw many crypto investors put their hats on, which prompted a massive fundraising campaign to display the memecoin in the Las Vegas Sphere. However, the market fluctuations have driven the token’s price to a decline of over 66% from its ATH.

The August retraces made WIF’s price drop 28% to a 6-month low of $1.1 before starting its recovery. Since then, it has reclaimed its early August levels, registering a 1% increase from its price one month ago.

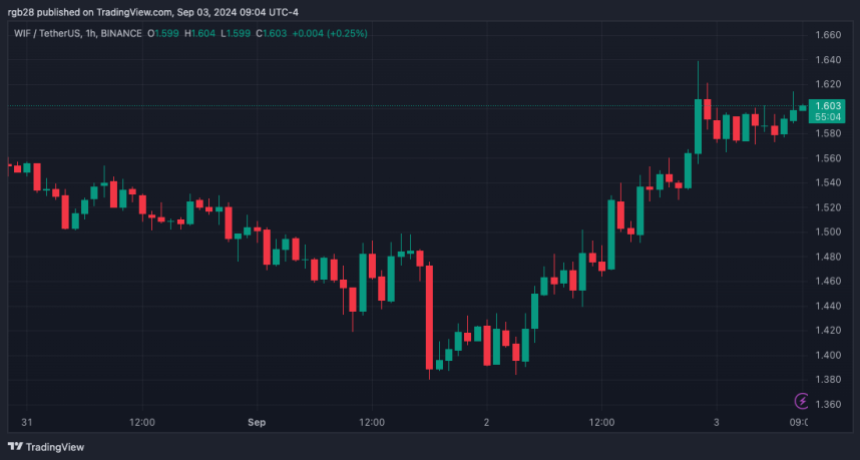
Following the weekend retrace, Dogwifhat saw a price surge of over 12%, reclaiming the $1.5 support zone again. This performance crowned the memecoin as the third largest gainer in the top 100 cryptocurrencies by market capitalization.

Moreover, WIF became the top 10 memecoin with the largest gains in the last 24 hours, followed by Popcat (POPCAT) and Floki (FLOKI)’s 9.2% and 7.6% jump.

WIF Price Targets $2.2

As Dogwifhat’s price began to surge on Monday, several market watchers noted that reclaiming the $1.51 support level could push the token’s price to higher levels. To Ameba, a successful breakout above the downtrend line would drive WIF’s price to a retest of the next key area of $1.84.

The analysts suggested the push could also propel the price to the $2.2 price range. Similarly, The Cryptonomist concurred that a strong breakout above $1.5 could see a reclaim of the same resistance level.

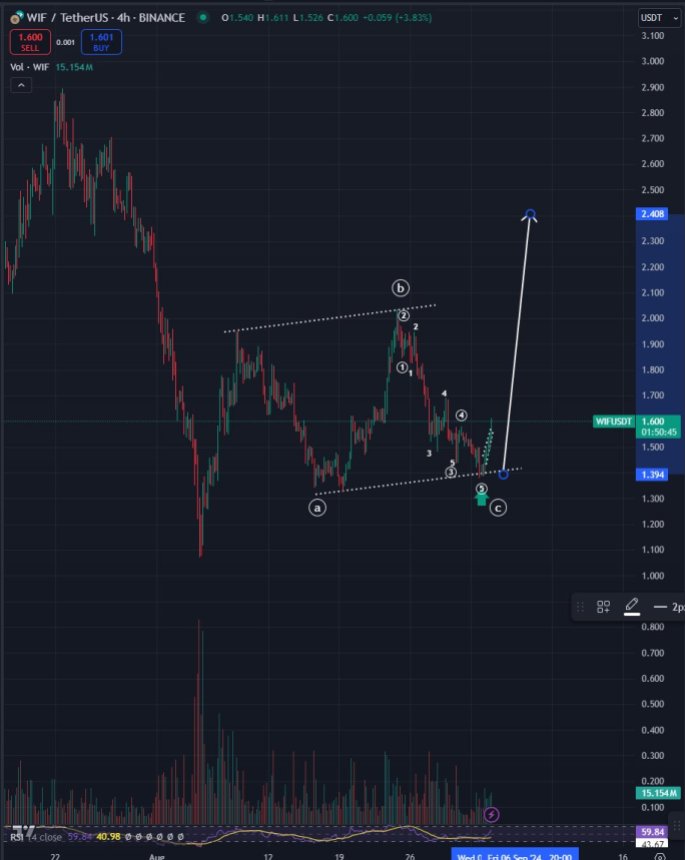
Crypto trader Bluntz emphasized Dogwifhat’s performance as the token retested the $1.6 resistance level on Monday night. To the trader, the cryptocurrency did a “perfect channel retest.”

WIF

Bluntz highlighted the a,b,c zig-zag pattern in the token’s chart, suggesting that the price could jump to $2.4 as it bounces from the c wave levels. Previously, the trader predicted that WIF’s chart suggested a retrace to the $1 support zone before its next leg up.

At the time, the memecoin sensation displayed a macro five-wave impulse followed by the formation of an a,b,c zig-zag pattern, with the c wave aiming for the $1-$2 price range. Following its most recent performance, the trader considers that investors are not “ready for the V reversal that’s about to happen.”

Nonetheless, crypto analyst Altcoin Sherpa warned investors about WIF’s short-term price action. To the analyst, the token won’t hit ATH anytime soon despite displaying a “decent” performance in the support region.

Ultimately, Sherpa considers that WIF’s price will “still see more chop and consolidation” around the $1.44-$1.95 area and advised the community to be patient while the rally resumes. As of this writing, the token is trading at $1.53, a 5.5% surge in the last 24 hours.

WIF, dogwifhat, WIFUSDT

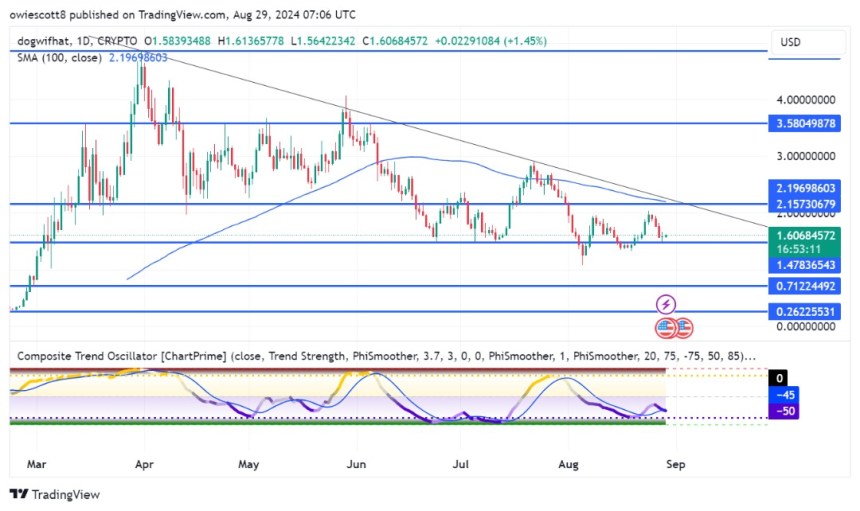
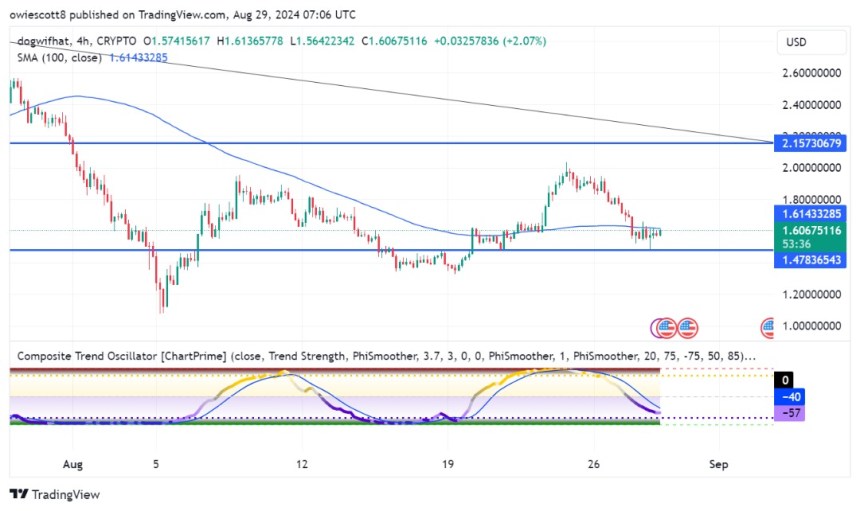
Dogwifhat On The Edge: Can WIF Hold Above $1.47 As Bears Close In?

Dogwifhat (WIF) is at a critical juncture as the price hovers around the $1.47 support level, with bearish pressure mounting. After a period of relative stability, the cryptocurrency is now under threat from renewed selling momentum that could push it below this key threshold. A break below this critical level could open the floodgates for further downside, while a successful defense might signal a potential reversal.

With Dogwifhat’s price teetering at the critical $1.47 support level, this article aims to analyze its precarious position and evaluate whether the intensifying bearish pressure could push the price lower. We’ll delve into key technical indicators, market sentiment, and potential scenarios to give traders and investors a clear outlook on WIF’s next possible moves.

Is A Breakdown Below $1.47 Inevitable For Dogwifhat?

WIF’s price is currently consolidating just below the 100-day Simple Moving Average (SMA) on the 4-hour chart. As long as Dogwifhat stays under this key indicator, bearish pressure could intensify, driving the price below the $1.47 support mark.

Dogwifhat

Additionally, on the 4-hour chart, both the signal line and the SMA of the Composite Trend Oscillator have fallen below the zero mark, now approaching the oversold zone. This current positioning indicates that bearish pressure remains strong in the market, suggesting the potential for further price declines.

On the daily chart, Dogwifhat has shown significant negative movement below the 100-day SMA by printing three bearish momentum candlesticks. This bearish surge reflects strong selling pressure and negative market sentiment, increasing the likelihood of WIF breaking below the $1.47 mark.

Dogwifhat

Finally, the 1-day composite trend oscillator reveals persistent bearish pressure for WIF. The signal line is attempting a move below the SMA of the indicator, with both components trending below the zero line. This positioning underscores the ongoing downward momentum and suggests that negative sentiment could continue to dominate.

Scenarios For Bulls And Bears At $1.47

Exploring WIF’s future outlook reveals that if the price reaches $1,47 and breaks below, the price will continue to move downward toward the $0.7 support mark. When the price reaches this level and breaks below, it may move lower to test the $0.2 support mark and probably move on to test other lower support marks. 

However, if Dogwifhat manages to hold at the $1.47 support level and the bulls initiate a rebound, the price could start to climb toward the $2.10 resistance mark. Should it break through this resistance, WIF may continue to ascend, with the next significant target being the $3.50 resistance level and potentially higher levels beyond.

In the past 24 hours, Dogwifhat was trading near $1.61, attracting a 1.77% increase. The cryptocurrency’s market capitalization has climbed above $1.6 billion, while trading volume exceeded $399 million. During this period, the market cap saw a 1.76% boost, whereas trading volume declined by 9.38%.

Dogwifhat