Stellar (XLM) Price Could Surge To $0.38 — Analyst Explains How

After a turbulent start to the week, the Stellar price seems to be finding some stability, briefly climbing above the $0.28 level this weekend. This growing momentum has sparked interest from market enthusiasts, with prominent crypto analyst Ali Martinez projecting the XLM token to soon experience a sustained price rise.

XLM Primed For 40% Price Gain 

In an X post on March 15, Martinez shared an intriguing projection for Stellar price after rebounding off a crucial level. Martinez noted that the altcoin could be on its way to a new local high over the coming weeks.

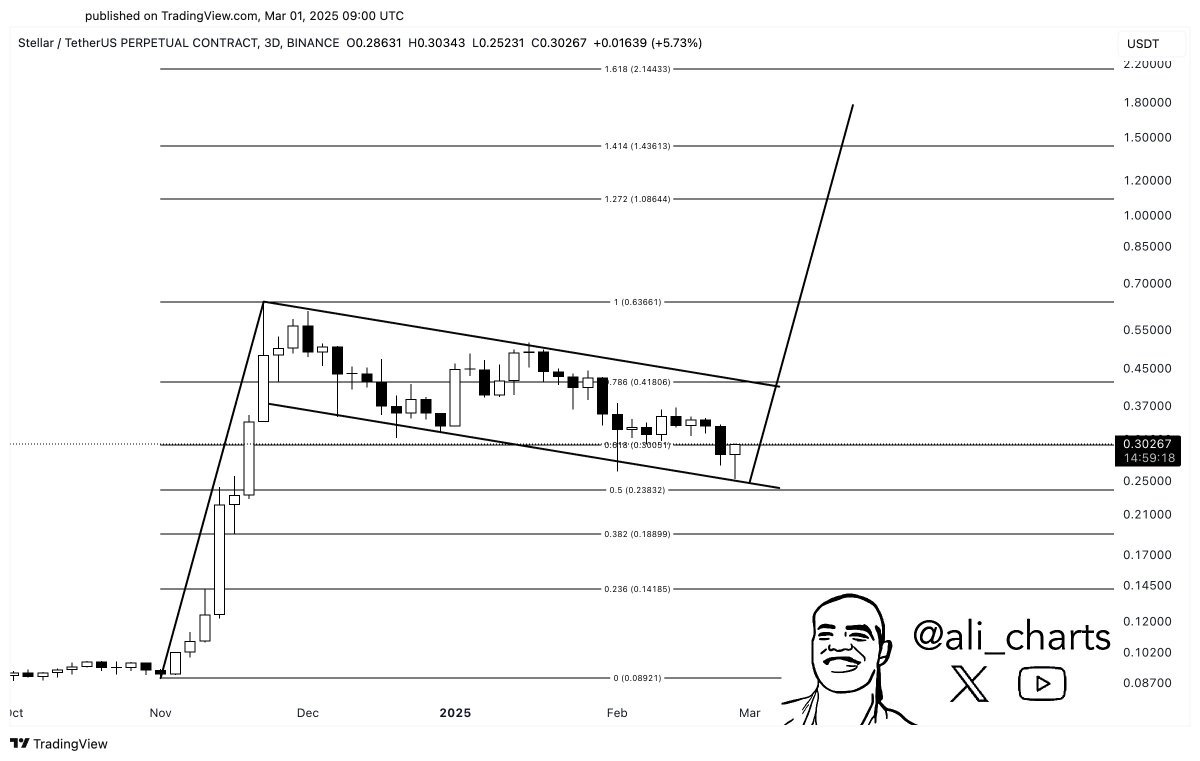
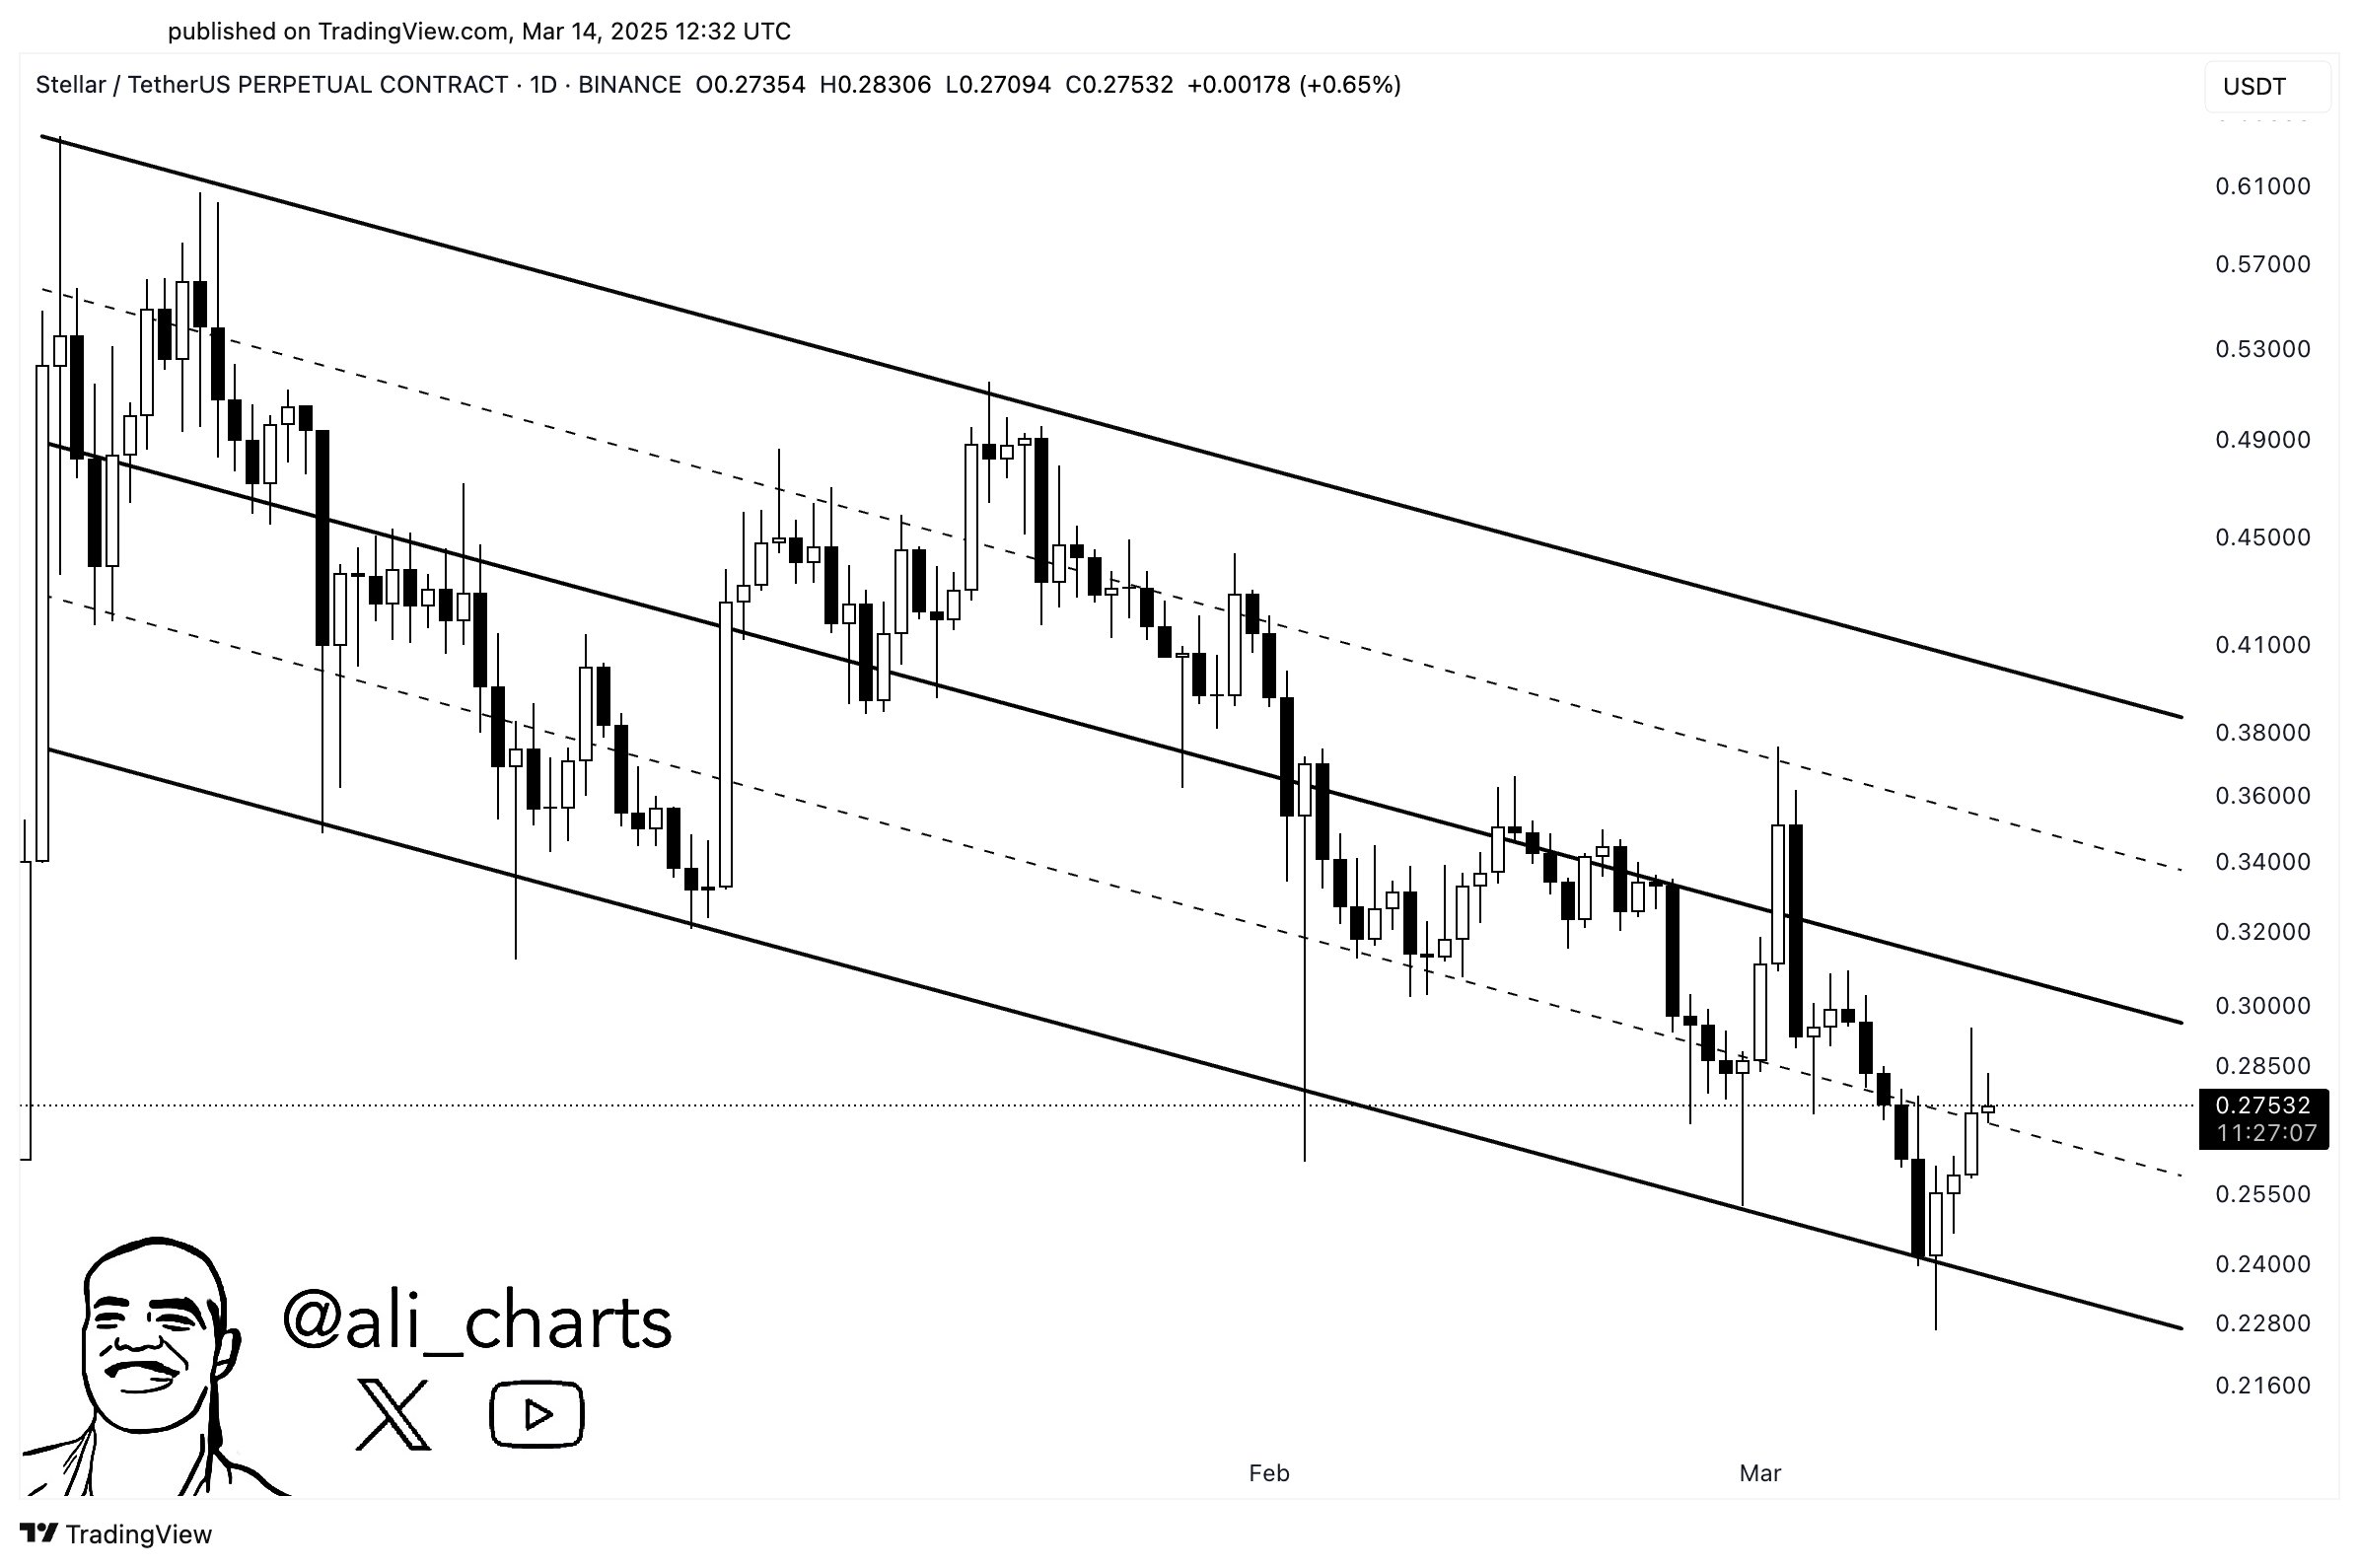
This bullish projection is based on the formation of a descending channel pattern on the XLM daily chart.  For context, a descending channel is a common pattern in technical analysis characterized by two major (downward-sloping) trendlines. The upper boundary line connects a series of lower highs and the lower channel line connects the lower lows.

The asset’s price typically persists within the channel; with the upper boundary line acting as resistance and the lower channel line considered a support floor. The descending channel formation is usually a bearish pattern, indicating the persistence of a downward trend.

Stellar

When the price breaks down the lower channel line, it signals the continuation of the downtrend. Conversely, a break out of the descending channel can be used to identify trend reversal points — usually from a bearish trend to an upward trend. 

XLM’s price has been in this descending channel since November 2024, recently bouncing back from the lower boundary line. As observed in the chart above, the altcoin fell to support around the $0.23 level in early March, but it has since turned around toward the channel’s midline.

According to Martinez, the next price target for XLM is $0.30 at the channel’s midline. However, the analyst believes Stellar could make a play for as high as $0.38 at the upper boundary line i.e. representing a potential 40% surge from the current market price. The last time the Stellar traded around the $0.38 region was in early February and has since plummeted as low as $0.23 since then. 

Stellar Price Overview

As of this writing, the XLM token is valued at around $0.27, reflecting a 0.83% gain in the past 24 hours. According to data from CoinMarketCap, the Stellar price is down by 0.76% in the last seven days despite the woeful start to the week. Meanwhile, the altcoin’s value has declined by 17.25% in the past month.

Stellar

Related Reading: XRP Price To $110? Bollinger Bands Creator Reveals Why It Will Become A Market Leader

Stellar (XLM) Chart Signals Major Rally —Is A 330% Surge Coming?

The Stellar (XLM) market has registered a price boost in the past day gaining by 10.77% according to data from CoinMarketCap. This price bounce comes after a rather bearish week marked by significant losses across the general crypto market. Interestingly, as these digital assets show some minor recovery, renowned market analyst Ali Martinez has postulated that XLM may be preparing for a major bullish swing.

XLM’s Bullish Flag Could Propel Prices To $1.20 – Analyst

In an X post on March 1, Martinez shared an interesting technical analysis of the XLM market.  According to the market expert, there is a bullish flag formation on the XLM/USDT 3-day trading chart signaling an incoming price surge.

For context, the bullish flag pattern occurs when an asset experiences a steep rise in price representing the flagpole followed by a consolidation period with a declining price movement representing the flag. On the XLM/USDT chart, the bullish flag is formed following a price rally in November 2024 which is trailed by a price correction phase to date.

XLM

However, while the bullish flag might signal a potential upward momentum ready to explode, Stellar must break beyond the upper boundary of the flag currently at $0.41 to confirm any price surge. Looking beyond this level, the altcoin will also face significant resistance to its upward movement at $1.00, $1.21, and $1.41 price levels respectively.

However, in the presence of sufficient buying pressure, XLM could surge by at least 330% upon confirmation of bullish intent suggesting a minimum price of around $1.20. This projected rise of Stellar stems from historical data from which a bullish flag is expected to produce market gains similar to the length of its flagpole.

Interestingly, the Relative Strength Index (RSI) on the XLM/USDT daily chart also supports the bullish potential of the altcoin. According to data from Tradingview, this RSI is currently at 4.59 headed in the upward direction, signaling more room for XLM price gains following its recent recovery.

XLM Price Overview

At the time of writing, XLM trades at $0.3141 after its 10% price increase in the last 24 hours as earlier stated. Meanwhile, there is a slight reduction in market engagement as indicated by a 1.12% decline in daily trading volume.

It is worth noting that XLM still remains in the red zone on its weekly and monthly timeframes with losses of 5.94% and 27.28%, respectively suggesting larger bearish market control in recent times. For a bullish flag breakout to materialize, XLM traders must increase the current buying pressure and induce a higher trading volume.

XLM

XLM Price (Stellar) Surges Along XRP, Can Bulls Push It To $0.12?

Stellar (XLM) started a strong increase above the $0.0950 resistance against the US Dollar. XLM price is gaining pace and might aim for $0.120.

  • There was a steady increase in Stellar’s token price above $0.0950 against the US dollar.
  • It is now trading above $0.100 and the 100 hourly simple moving average.
  • There is a major bullish trend line forming with support near $0.0980 on the hourly chart of the XLM/USD pair (data source from Kraken).
  • The pair is likely to continue higher towards $0.1150 and $0.1200 in the near term.

Stellar Price Rallies Over 10%

After forming a strong support base above $0.0750, Stellar (XLM) saw a strong increase above $0.0850 against the US Dollar, following XRP surge. It gained over 10% beating Bitcoin in the short term.

There was a clear move above the $0.0950 and $0.100 resistance levels. The price tested the $0.1050 zone. A high was formed at $0.1043 and the price is now consolidating gains. There was a minor decline below the $0.10 level. The price tested the 23.6% Fib retracement level of the recent increase from the $0.0757 low to the $0.1043 high.

XLM price is now trading above the $0.10 resistance and the 100 hourly simple moving average. There is also a major bullish trend line forming with support near $0.0980 on the hourly chart of the XLM/USD pair.

Stellar Price

On the upside, an immediate resistance is near the $0.1050 level. The next major resistance is near the $0.1120 level, above which the price could test $0.1150. A close above the $0.1150 level might start a steady increase toward the $0.1200 and $0.1250 levels. The next major stop could be $0.1300 or even $0.1320.

Are Dips Supported in XLM?

If XLM price struggles to continue higher, it could start a downside correction. Immediate support on the downside is near the $0.0980 level or the trend line.

The next major support is near the $0.090 level or the 100 hourly SMA. A clear break below the $0.0900 support zone could spark a fresh decline. The next major support on the downside is near the $0.0800 level.

Technical Indicators

Hourly MACD – The MACD for XLM/USD is gaining pace in the bullish zone.

Hourly RSI (Relative Strength Index) – The RSI for XLM/USD is currently well above the 50 level.

Major Support Levels – $0.0980 and $0.0900.

Major Resistance Levels – $0.1050 and $0.1200.

XRP And XLM Price Correlation Persists, Ripple CTO Explains Why

XRP and Stellar (XLM) are two cryptocurrencies that have been constantly compared in terms of price growth and development. Both digital assets are dedicated to facilitating cross-border transactions

Given their considerable similarities, the Chief Technology Officer (CTO) of Ripple, David Schwartz has attempted to uncover the factors contributing to the persistent price correlations between the cryptocurrencies. 

Ripple CTO Explores XRP And XLM Price Trends

Schwartz has recently taken to X (formerly Twitter) to share a chart illustrating a strong correlation in the price movements and patterns between XRP and XLM tokens. In response to an X user who expressed curiosity regarding the similar price trends between the two cryptocurrencies, Schwartz explained the distinct reasons behind XRP and XLM’s unique price movements. 

The Ripple CTO acknowledged that he lacked an accurate explanation for the price correlations between XRP and XLM. However, he provided two major factors that could be influencing the price trends. 

Schwartz revealed that comparable market forces that regulate various cryptocurrencies also control XRP and XLM. He further stated that most investors and crypto enthusiasts often place XRP and XLM within the same category due to the cryptocurrencies’ historical connection.

 As a result, a significant number of people simultaneously engage in buying and selling XRP and XLM causing the cryptocurrencies to have similar price movements. 

Concluding his analysis, Schwartz stated that he believed there were no market manipulations or external “evil forces” making these cryptocurrencies display similar price trends. 

XRP price chart from Tradingview.com (XLM Ripple CTO)

Latest Developments For Both Assets

XRP and XLM are one of the major cryptocurrencies that have gained significant attention, often seen as the leading contenders for cross-border payments and mainstream adoption. 

While these two cryptocurrencies tend to display similar price tracks, they have been experiencing vastly different developments in their respective markets and ecosystems. 

XRP recently gained regulatory clarity after successfully gaining a victory in its ongoing legal battle with the United States Securities and Exchange Commission (SEC). Despite speculations suggesting that XLM might be the SEC’s next target due to its striking similarities with XRP, the cryptocurrency has not encountered similar legal issues in the US as Ripple. 

Following XRP’s partial legal success, the price of XRP surged considerably. While XLM followed behind increasing by almost 90% but retraced some of the accumulated gains later. 

In terms of expansion, XRP has achieved multiple milestones and has gained approvals in several regions including Dubai. The cryptocurrency is positioned to gain from Ripple’s potential integration into trillion-dollar markets and industries.

On the other hand, Stellar (XLM) is improving its ecosystem by integrating a new testnet upgrade, Protocol 20. The cryptocurrency is also actively seeking new partnerships with banks to expand its reach and utility.

Stunning Correlation Emerges Between XRP And XLM, What’s Going On?

On Monday, news quickly spread after a BlackRock XRP ETF filing popped up on the Delaware Corp. Commission website. The filing has since been claimed to be false. But the damage was already done as the token’s price surged quickly before reversing.

One interesting development from this event though was a curious correlation that emerged between the XRP price and the XLM price at the time. While the news was localized to XRP, XLM had surged just as much, emerging with a stunning correlation between the two.

XRP And XLM Correlation Balloons

In the wake of the rumored BlackRock XRP ETF filing pumping the token’s price, one enthusiast has noticed a significant correlation between XRP and XLM. Crypto analyst and educator Blockchain Backer took to X (formerly Twitter) to reveal what he terms as one of the “most bizarre” moves.

The chart clearly shows the XLM price surging just as the BlackRock news broke with a straight green candle. Likewise, when the news was debunked and the XRP price began to fall, so did the XLM price, in an eerily similar fashion.

In another post, Blockchain Backer revealed that XLM had followed XRP’s move in the 2-second timeframe. A chart shared with this post showed XRP’s movement and XLM’s movement on the same chart and the moves happened at almost the same time, as shown below:

XRP XLM BlackRock

“The fake news was literally XRP specific, and would impact XRP only, not XLM. If anything, you’d expect XLM sell off like the rest of the market. Instead, it mirrors. Why?” the analyst wondered.

XLM price chart from Tradingview.com (XRP)

Running A Similar Race

XRP and XLM have always seemed to run in the same circles and the correlation in their price movements has been a testament to that. One X user, in response to Blockchain Backer’s post, reasoned that the correlation was because both digital assets actually “share the same holders.”

One crypto analyst who has also closely tied the performance of XLM to that of XRP is Crypto Bilbuwoo. One of their long-running analysis includes both digital assets which the analyst expects to move toward new all-time highs in the same fashion.

In an October 15 post, Crypto Bilbuwoo posited that “The chart shows that 1.618 Fibonacci ratio(XLM: 6.5$, XRP: 26~33$) will be completed at the end of December.” The last time this happened was back in 2017 and the analyst expects a repeat of that trend, saying there would be a 6,500% surge for both assets.

Despite this correlation, Blockchain Backer still finds Monday’s simultaneous pump strange as he believes “those same holders would have dumped XLM for XRP. Not fomo bought XLM on that news story.”

However, as another X user explains, “Not if they believe XLM and XRP are brother and sister. There are some influencers peddling this for years. Doesn’t make logical sense but does with that narrative. XLM would be next!”

Stellar (XLM) Holds Past Week Gains As Bear Taking Control Of The Market

All eyes are on Stellar (XLM) as it breaches the $0.12 resistance despite the massive onslaught in the crypto market. The token managed to hold its past week’s gains while Bitcoin and other top coins maintained consistent bearish momentum. 

Stellar’s current price reflects the growing demand and interest in its payment solution, which is a plausible reason behind its strength. Moreover, excitement is high among XLM investors as the Stellar network prepares for a game-chaining announcement on Tuesday. 

XLM Soars Amid Heightened Speculation In The Stellar Ecosystem

XLM has been bullish since September 2 following Stellar.org’s announcement that “something cool is coming” to the network in 10 days. Following this announcement, XLM’s price increased by 10%, climbing from $0.1135 to $0.126.

Related Reading: Solana (SOL) Price Plunges On FTX Rumors, Buy Or Sell Now?

It maintained the momentum, though with a few dips, reaching $0.134 on September 10. This price move marked a nearly 20% increase from the month low of $0.1117 recorded on August 17.

Furthermore, Stellar Network continued to tease the community with the countdown to the mysterious announcement, as a September 7 tweet also teased that change is underway as the upcoming brand will introduce Stellar to the real world.

The Stellar community is abuzz with anticipation as enthusiasts await the unraveling of the mystery. Some community members speculate that the upcoming announcement could be related to a partnership with Apple. 

In a recent report, Stellar dominated all layer-1 networks in tokenized treasuries by market cap, surpassing Ethereum and Polygon. The August 23 tweet shows that Stellar recorded a tokenized treasury market cap of $304 million. Ethereum, on the other hand, recorded a Treasury market cap of $291 million, while Polygon followed with $24 million.

This report presents Stellar as a leading real-world asset tokenization network, a plausible reason behind XLM’s price increase. 

XLMUSD price chart

Price Outlook: XLM Slips Off $0.13. Will It Rebound?

Over the past 30 days, Stellar’s XLM embodied the resilience lacking in the broader crypto market. While most coins surrendered all past gains, XLM held on, bucking negative market sentiments and soaring new highs.

However, the rally has stalled, and the token currently holds over 3% price decline in the last 24 hours. But it still retains 1.78% gains in the last seven days. 

Stellar has slipped off the newfound support at $0.134 and now trades at $0.1272. This downslide suggests two things. Firstly, the hype around the mysterious announcement must have dwindled. Secondly, XLM could have succumbed to the bearish pressure present in the broader crypto market.

Nonetheless, XLM is in a critical conjecture, as the outcome of the next 24 hours will determine its price trajectory. If the announcement is bullish enough, XLM could witness a positive momentum shift with a massive upswing above the $1.3 price.

Stellar Price Moves To A Lower Level, Can The Bulls Defeat This Resistance Mark?

Stellar price has continued to travel south over the last 24 hours. On the last day, XLM lost more than 6% of its market value.

Stellar has recorded positive price sentiment recently, owing to an update that spread optimism across the XLM community.

In the latest update, Stellar users can now transfer USDC and Stellar Lumens via email. Despite the update, technical indicators have sided with the bears on the one-day chart.

The buying power has fallen considerably, even though the number of buyers is greater compared to the number of sellers.

In the last week, Stellar price went up close to 7%. However, at press time, the bulls look exhausted. The present support zone for XLM stands between $0.111 and $0.106, respectively.

A fall from the $0.106 mark will lead the Stellar price to touch the $0.99 price mark.

Broader market support will be necessary for most altcoins to recover. If buyers don’t pick up momentum and XLM doesn’t topple above the 20-SMA, then the altcoin is in for a further drop in price.

Stellar Price Analysis: One Day Chart
Stellar was priced at $0.112 on the one-day chart | Source: XLMUSD on TradingView

XLM was trading at $0.112 at the time of writing. The coin could not hold onto its weekly gains and fell on its chart as a result of declining buying strength.

It is important for the bulls to defend Stellar at the $0.111 level, else Stellar price could drop down to $0.106. Once the coin touches the $0.106 mark, it could also fall near the $0.99 level.

Overhead resistance for the coin stood at $ 0.116. A move above that level could push the coin to $0.119. The amount of Stellar traded in the past trading session declined, indicating a fall in buying strength.

Technical Analysis
Stellar registered a decline in buying power on the one-day chart | Source: XLMUSD on TradingView

XLM was still not in the excess selling territory, but if buyers continue to decline, sellers will soon take over.

Stellar has had a good past week, but the bulls failed to move past the $0.116 resistance mark, causing the coin to depreciate in price.

The Relative Strength Index was right on the half-line, and that is an indication of an even number of buyers and sellers.

A fall in demand will immediately push the price of Stellar below the 20-SMA line. This would mean that the sellers were driving the price momentum in the market.

Stellar indicated buy signal on the one-day chart | Source: XLMUSD on TradingView

There could be a chance for Stellar to redeem its price given that XLM continued to display a buy signal on the one-day chart.

The Moving Average Convergence Divergence measures the price momentum and the overall price direction of the altcoin.

The MACD continued to form green signal bars that correlate with the buy signal for the coin. Although the green histograms were declining on the chart as a sign of increased selling strength, sellers had not taken over yet.

The Parabolic SAR displays the price action of the altcoin. The dotted lines below the price candlestick mean that XLM could rise on its chart again with sustained demand.

Featured image from Personal Financial, Chart: TradingView.com

XLM Depicts Buying Resurgence, Where’s It Headed Next?

XLM price picked up momentum after the coin retraced on its chart over the past week. Over the last 24 hours however, XLM appreciated by 3.6% and was successful in toppling over its immediate resistance mark. The bulls were back in charge and the technical outlook of XLM also portrayed the same sentiment.

Currently, XLM price has become steady on the $0.121 level. Over the past few days, XLM has consistently formed higher highs and higher lows which is a sign of bullishness in the market. If the altcoin is able to hold onto its price momentum, then the coin could eye the $0.130 price ceiling over the upcoming trading sessions. Buying strength for Stellar remains crucial for the coin.

XLM price last hovered around this price mark multiple weeks back, around the end of June. A crash from the present price level could bring XLM price to $0.114. Previously when XLM price traded at $0.124, it was met with bearish pressure resulting in Stellar falling to $0.114.

XLM Price Analysis: Four Hour Chart
Stellar was priced at $0.126 on the four hour chart | Source: XLMUSD on TradingView

The altcoin was priced at $0.126 at the time of writing. The bulls resurfaced along with buyers in the market, this made XLM flip its immediate resistance mark into its support line. Overhead resistance for XLM now was at $0.127 and then at $0.129.

On the other hand, local support for XLM price stood at $0.119. Inability to sustain its price over the aforementioned support line, can bring the altcoin down to $0.114.

Stellar has made considerable recovery given the altcoin had touched a 20-month low price level in the middle of July, this year.

Trading volume of Stellar dipped on the four hour chart, this is an indication of falling selling strength in the market.

Technical Analysis
Stellar was overbought on the four-hour chart | Source: XLMUSD on TradingView

Technical outlook has painted an extreme bullish picture for XLM price on the four-hour chart. There has been a sharp spike in the number of buyers on XLM’s chart.

The Relative Strength Index was parked into the overbought zone which meant that the asset was overvalued.

Buying strength had overpowered selling strength heavily at press time. XLM price was way above the 20-SMA line.

This reading points towards the buyers driving the price momentum in the market. The price of the altcoin was also above the 50-SMA and 200-SMA which signified that demand for the altcoin had substantially increased.

Stellar depicted buy signal on the four-hour chart | Source: XLMUSD on TradingView

Stellar captured buy signal on its chart in accordance with the other indicators on the chart. The Moving Average Convergence Divergence depicts the price momentum and reversal in same. MACD had pictured green signal bars over the half-line after it experienced a bullish crossover.

The green signal bars were tied to buy signal for XLM. Directional Movement Index is responsible for portraying the current price trend and the strength of the trend in the market. DMI was positive because the +DI line was above the -DI line.

Average Directional Index (Red) was seen moving towards the 40-mark, this signified strength in the present price direction indicating that XLM price will continue to register an upward movement over the upcoming trading sessions.

Related Reading: Market Sentiment Holds Steady As Bitcoin Aims For $24,000


Featured image from StormGain, Charts from TradingView.com

Stellar (XLM) Broke Down From The Descending Triangle, Fresh Lows On Chart?

Stellar (XLM) picked up pace on the daily chart as the coin registered some upward movement. The coin has been trading within a descending channel. Although the coin was moving sideways, if bulls reclaim the chart XLM can break above the channel.

Technical outlook for the coin remained bearish. Buying strength also remained considerably low. Recent sell off in the market has caused the coin to lose its $0.107 support line. If the coin does not rise above the resistance mark of $0.107 then the altcoin is set to lose some of its value again.

Buying strength has to recover in the market for the altcoin to break over the descending trendline. For bearish thesis to be invalidated, it is important for Stellar to trade above the $0.113. For Stellar to maintain its recovery, buying strength needs to immediately re-enter the market. The global cryptocurrency market cap today is $968 Billion with a 2.0% positive change in the last 24 hours.

Stellar Price Analysis: Four Hour Chart
Stellar was priced at $0.106 on the four hour chart | Source: XLMUSD on TradingView

XLM was trading for $0.106 at the time of writing. The coin tried to rise above the descending line but fall in buying strength have dragged price below the $0.107 mark. If the coin manages to trade above the $0.107 mark, then it could revisit $0.113.

Trading above the $0.113 level will help the bearish thesis to be invalidated. If XLM loses its current price level, it could fall to $0.099. The amount of Stellar traded fell on the chart signifying less buying strength. If buying strength continues to remain low then the coin can plunge through the $0.099 level.

Technical Analysis
Stellar displayed fall in buying strength on the four hour chart | Source: XLMUSD on TradingView

The altcoin flashed fall in buying strength as seen from the technical indicators. Relative Strength Index was trading close to the half-line after noting a downtick. This downtick meant buyers exited the market. If buying pressure continues in this momentum, RSI will soon fall below the zero-line.

Price of Stellar was slightly above the 20-SMA which pointed towards buyers driving the price momentum in the market. Although buyers are still more in number compared to sellers, it isn’t enough for the coin to register increased price over the upcoming trading sessions.

Related Reading | Short Liquidations Climb As Bitcoin Recovers Above $20,000

Stellar flashed buy signal on the four hour chart | Source: XLMUSD on TradingView

XLM’s buying strength has remained low on the chart. In consonance with the same, Chaikin Money Flow which depicts capital outflow and inflows displayed a downtick. Although CMF was positive, capital inflows have remained low.

Awesome Oscillator points towards price direction and momentum. AO turned positive and displayed green histograms. These green histograms reflected change in price direction and also a buy signal. Despite a buy signal, if buyers don’t act on it then Stellar’s upward movement will be stalled.

Related Reading | Bitcoin Funding Rate Turns Highly Positive, Long Squeeze In The Making?

Featured image from VOI.ID, chart from TradingView.com