Off The Grid may be the ‘catalyst’ for new crypto gaming bull run: Web3 Gamer

Off the Grid has topped the download charts and may spark a Web3 gaming bull run say analysts, with VCs getting bullish again. Web3 Gamer.
Bitcoin Jumps to Just Shy of $68K, Highest Since Late July
Digital assets are finally beginning to pay attention to not just the growing chance of a Trump victory in November, but also a GOP sweep, said Standard Chartered’s Geoff Kendrick.
Scammers promote fake Uniswap L2 on Google amid Unichain hype

Google mistakenly promoted a fake version of the Unichain website that spammed users with requests to drain their wallets.
EU’s MiCA bill set to shape global stablecoin regulations — Binance

While MiCA is seen as a net positive for stablecoin regulation, it introduces consolidation concerns, especially among small crypto firms.
Brace For Impact: XRP Primed For Massive ‘Explosion,’ Analyst Says After Key Break
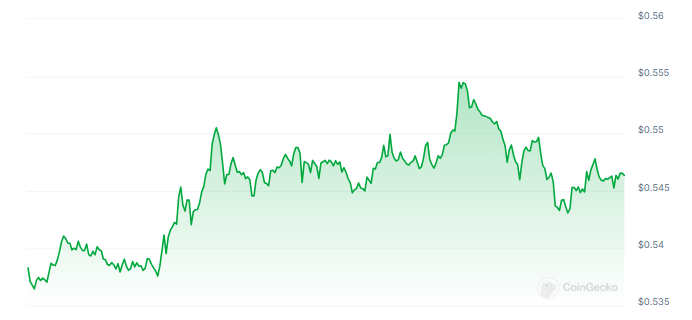
Price movement of XRP has been slow recently; it stays about $0.53 and shows a 7% drop over the previous month. Many investors are becoming frustrated as they see the altcoin stagnating after a bit of an increase recently.
Despite the weak performance, technical analysts are starting to see possible signals of a major change despite the negative vibe; if XRP effectively crosses an important Fibonacci retracing level, they project a strong recovery.
Market analyst “Random Crypto Pal” thinks XRP is about to break out in an “explosive” manner. On social media, he shares his observation and emphasized the significance of the 0.236 Fibonacci level, which XRP has not yet hit but is approaching. Should this level give way, he expects a price explosion similar to the one it observed in 2017.
Once #XRP breaks above 0.236 fib the 2017 #XRP EXPLOSION is coming
Only PURE FACTS
Like
repost
FOLLOW
pic.twitter.com/AOz255KQ0y
— Random Crypto Pal (@RandomCryptoPal) October 13, 2024


The Trajectory Of XRP Towards $0.80
The Fibonacci level of 0.236 analysts have on their radar would see a price that is slightly above $0.80. XRP is currently trading at $0.548, so an approximate gain of 45% would be needed to be achieved in order to bring about a price for that. When it reaches this threshold of $0.80, the huge returns may appear rather quickly for the coin.
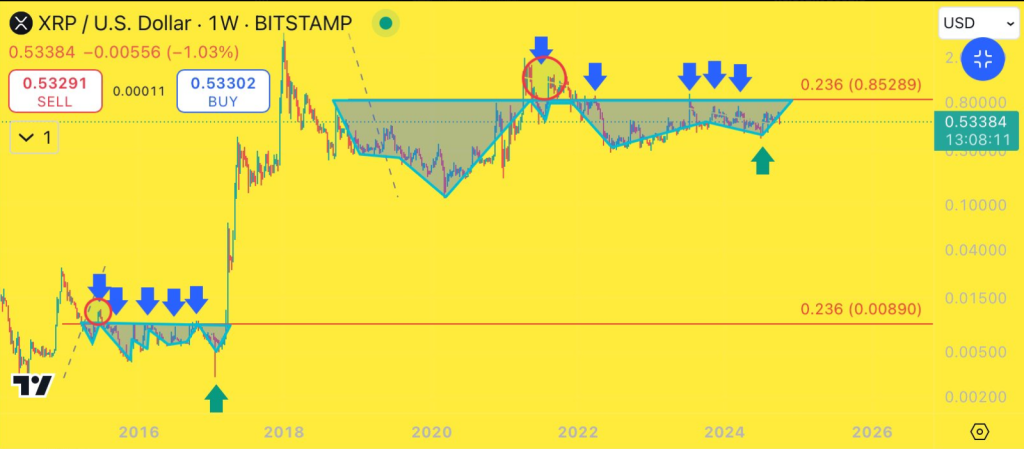
In 2017, XRP broke above the resistance of 0.236 Fibonacci and continued on a long rising trajectory that topped at an all-time high in January of 2018. The historic parallel gives analysts hope that history may repeat, but unless XRP is able to break this resistance level it is not really possible to predict whether or when the rally might occur, nor the magnitude of the price increase.
Ripple’s Legal Dispute
A primary obstacle that may mitigate this confidence is XRP’s protracted legal dispute with the US Securities and Exchange Commission (SEC). The ambiguity over this litigation persists in affecting investor sentiment. The SEC has classified the majority of altcoins as investment contracts; nonetheless, XRP has endured the most intense scrutiny, rendering it one of the most legally complicated digital currencies available.
The decision of the court that XRP is not a security constituted a major victory for Ripple Labs, but it has almost been challenged by an appeal from the SEC. The ongoing lawsuit between Ripple and the SEC gives uncertainty over how long the cryptocurrency would face this uncertainty.
Anticipation Of A Promising Future?
XRP could, therefore, present the avenue of survival through institutional investment despite the judicial ambiguity. Bitwise and Canary Capital appear to believe in the coin by pushing for a US-based XRP ETF. This tool would definitely make XRP’s position better and may attract more investment. Furthermore, advancements on the XRP Ledger are fostering optimistic feeling among the community.
The potential for XRP to surpass $0.80 and initiate a new surge is yet to be determined. Nonetheless, due to the influence of technical, legal, and institutional considerations, investors are closely monitoring forthcoming developments.
Featured image from iStock/Getty Images Plus, chart from TradingView
Waves founder unveils Units protocol for layer-2 interoperability

Waves founder Sasha Ivanov believes the industry cannot move forward if blockchain interoperability remains unresolved.
These 5 Bitcoin price metrics hint at a new all-time high in 2024

Bitcoin open interest is rising and bulls are eyeing new all-time highs above $75,000 as “Uptober” begins to take shape.
CoinDesk 20 Performance Update: ICP Drops 3.5% as Index Inches Lower From Monday
Uniswap joined Internet Computer as one of the weakest performers, falling 3.2%
Trump leads Harris, but POTUS won’t matter for Bitcoin: BlackRock’s Fink

As Trump extends his lead over Harris in the prediction markets, BlackRock CEO Larry Fink said it doesn’t matter to Bitcoin who occupies the White House.
Is the election the end for PolitiFi memecoins — Or just the start?

PolitiFi memecoins are surging as they near the US elections, which could mark their final act unless they find new life serving the community’s interest.
Trump Family’s World Liberty Finance Token Sale Appears to Go Live, Selling 220M WLFI in Minutes
Blockchain data shows the token has bagged over 1,700 holders in the first 15 minutes after going live.
a16z-backed onchain messaging platform Towns officially launches

The same team behind Towns also created River Protocol, which enables transparency, security and decentralization in the new messaging app.
Paxos debuts new stablecoin payment platform with Stripe

Paxos’ goal is to support assets and chains based on customers’ interests and its own end-user preferences, the company said.
Blockstream Raises $210M in Convertible Note Financing Round
The money raised will be used to advance adoption and development of Blockstream’s layer 2 technologies, to grow the company’s mining operations, and expand its bitcoin treasury.
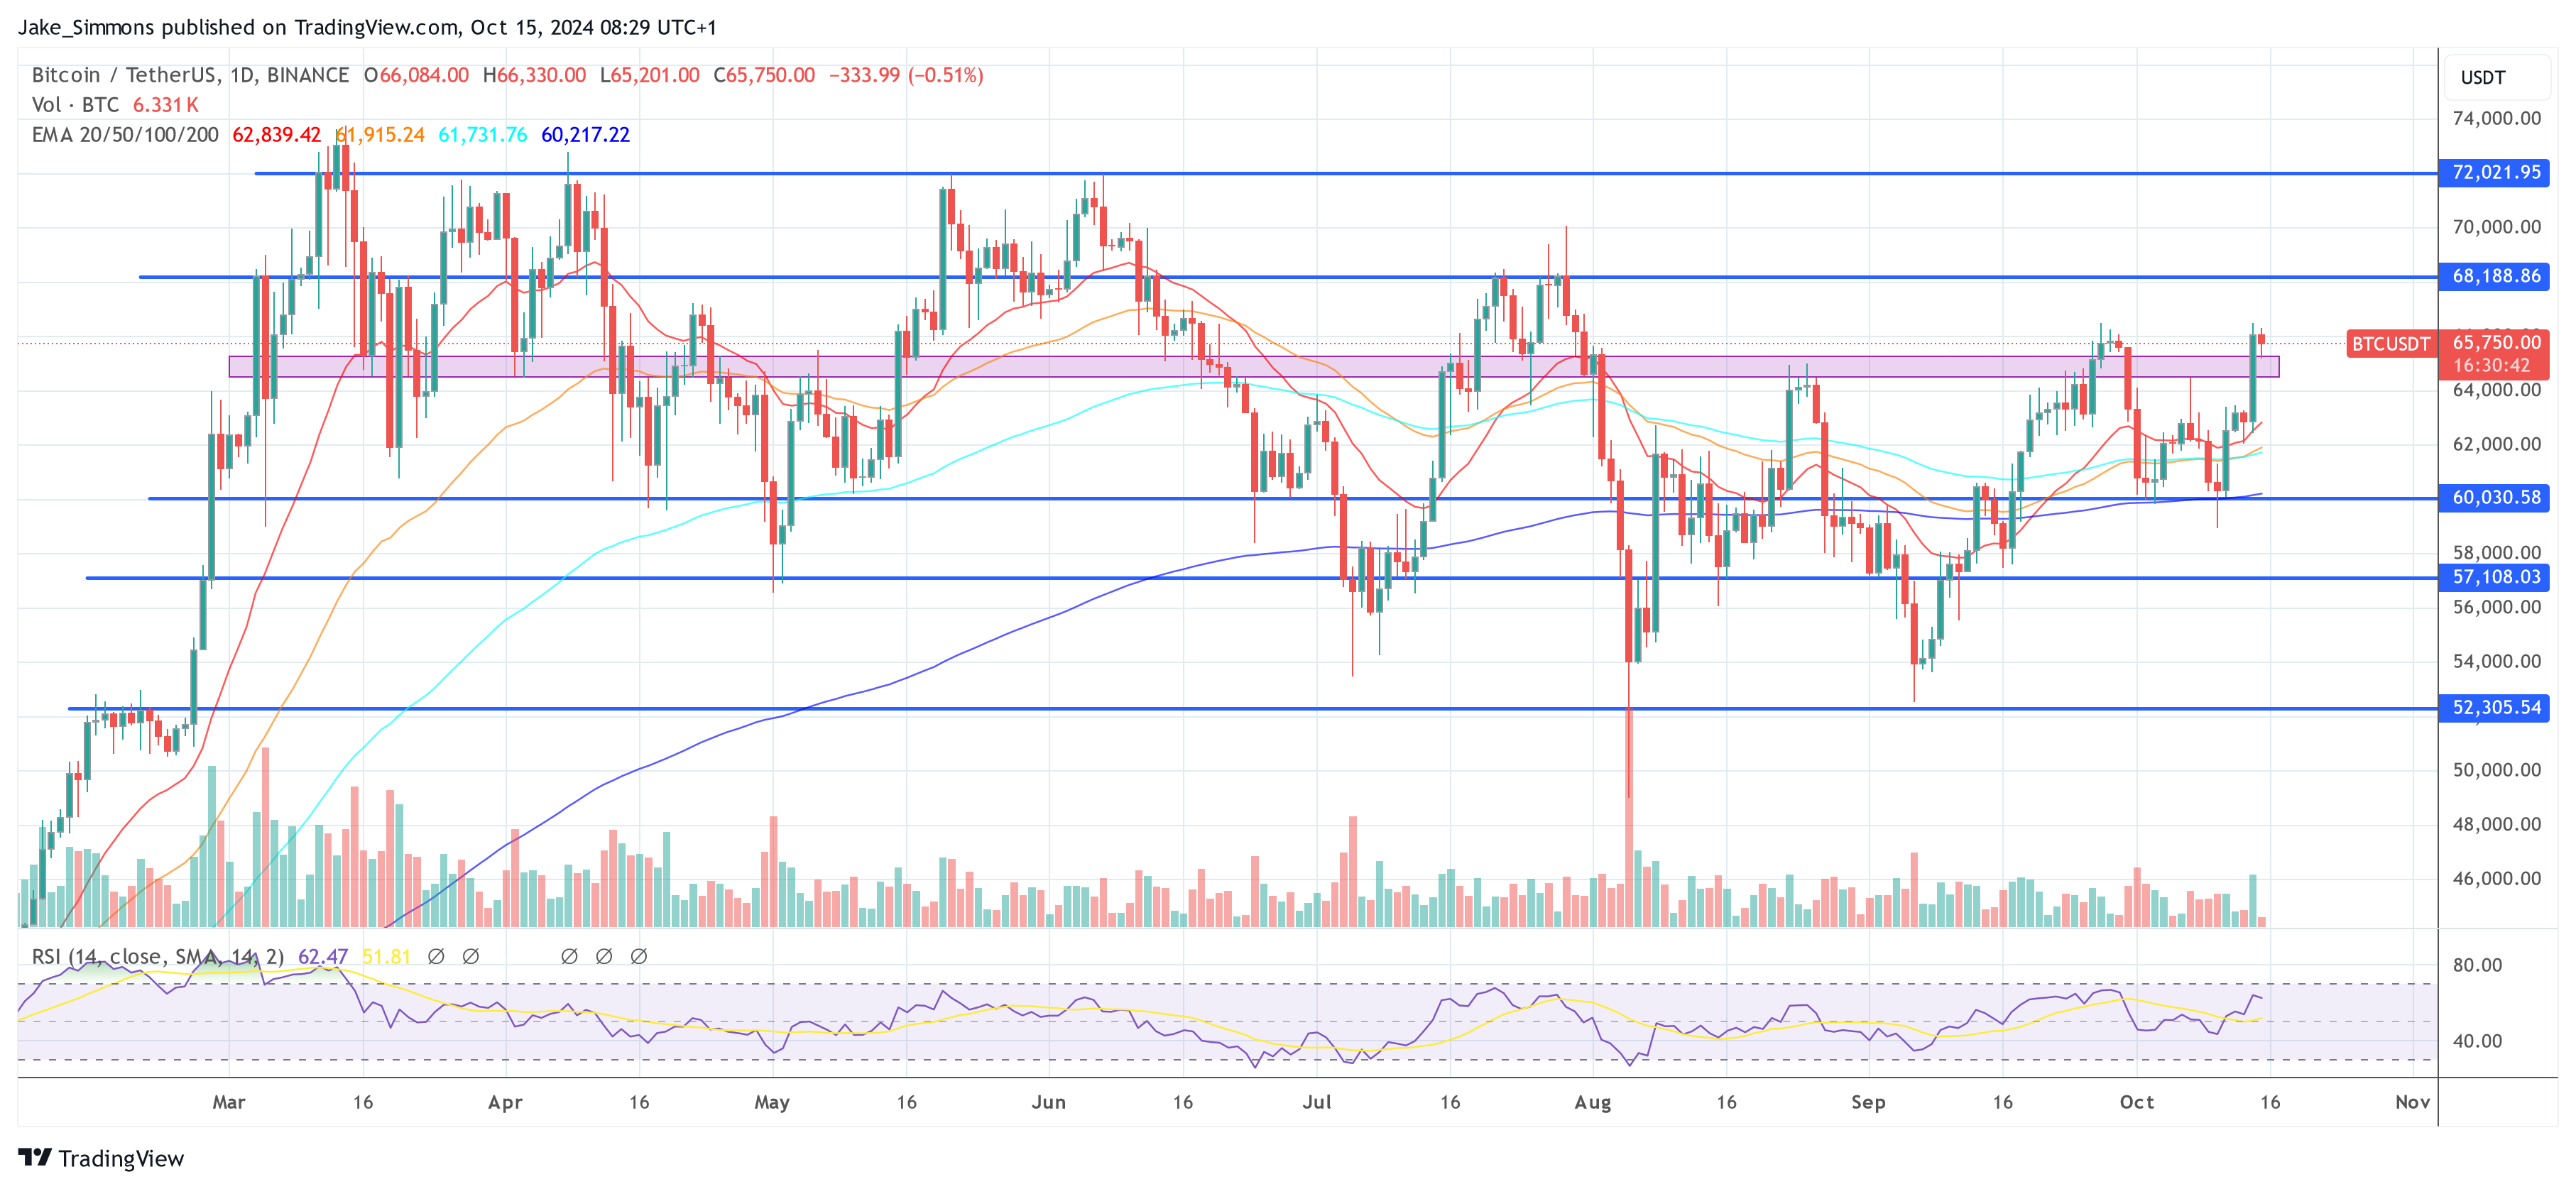
Why Bitcoin Price Blasted Past $66,500: Key Reasons Revealed
Bitcoin experienced a significant surge, climbing from a low of $62,050 on Sunday to a peak of $66,500 late Monday. As of Tuesday, the BTC price is slightly correcting below this key resistance level, but hovering above $65,000. Several critical factors have contributed to the rally, including a short squeeze coinciding with the upcoming US elections, strong demand in the spot Bitcoin market, and substantial inflows into US spot Bitcoin Exchange Traded Funds (ETFs).
#1 Short Squeeze And US Election Influence
Yesterday’s price surge can be partly attributed to the liquidation of leveraged short positions. Singapore-based trading firm QCP Capital writes in their latest investor note that nearly $80 million worth of Bitcoin and Ethereum leveraged shorts were liquidated, applying upward pressure on the market. While some speculate that the postponement of Mt. Gox’s repayment deadline to October 2025 played a role, this news was already published on Friday, suggesting other factors were at play during Monday’s rally.
“Although there could be many factors that could explain today’s move, it is quite an interesting time if we look at historical price action. We are in the middle of October and just three weeks away from the US elections,” QCP Capital notes. In both 2016 and 2020, Bitcoin remained in a tight trading range for months before initiating a significant rally approximately three weeks before the US Election Day. In 2016, Bitcoin doubled in price from $600 by the first week of January following the election. Similarly, in 2020, it surged from $11,000 to a high of $42,000 by January.
This year, October—often referred to as “Uptober” due to its historically strong performance—has been underwhelming, with Bitcoin up just 1.2% compared to an average of 21%. The current rally, occurring three weeks before the US elections, suggests that history might be repeating itself, potentially leading to further price appreciation as investor optimism builds.
#2 Strong Demand For Bitcoin
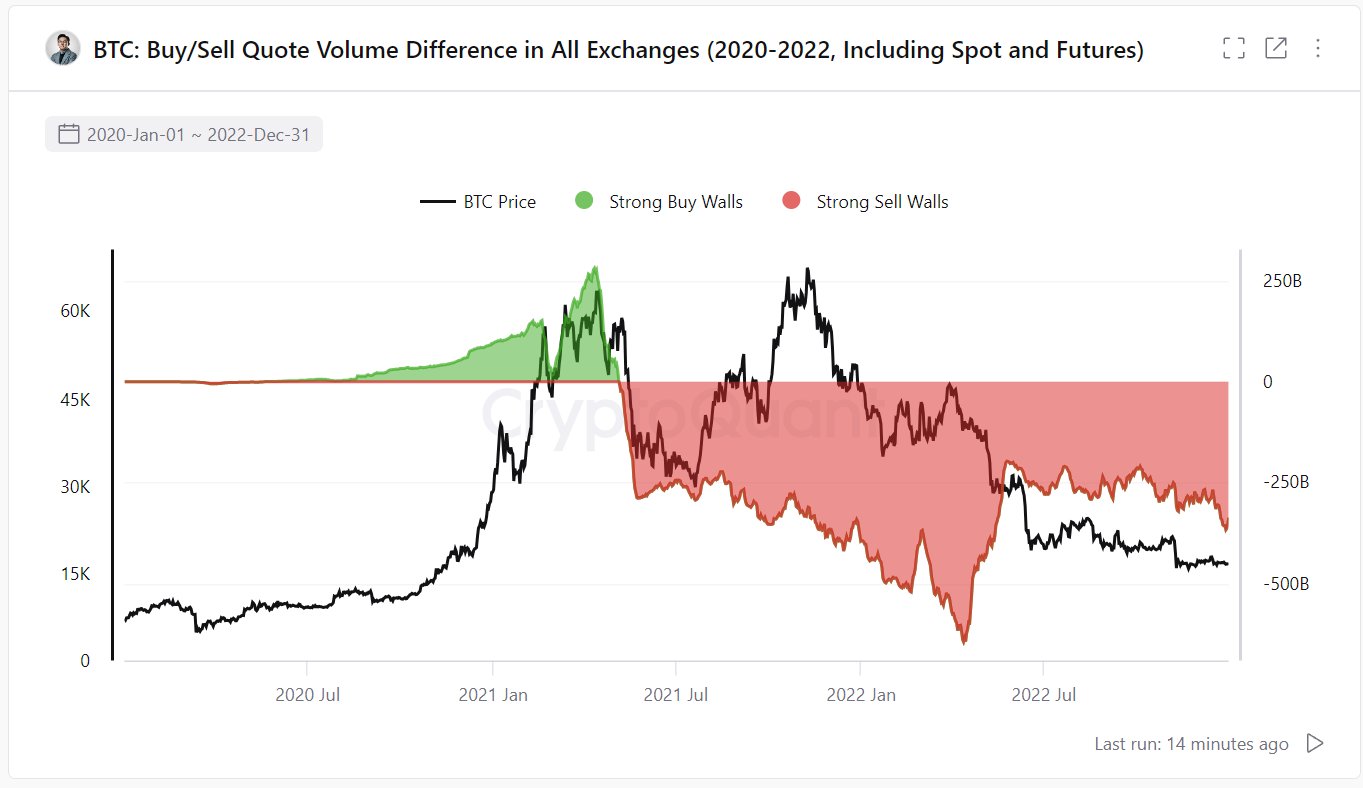
For the first time since mid-2023, Bitcoin’s buy orders are matching sell orders in spot market order books across exchanges. Ki Young Ju, Founder and CEO of CryptoQuant, highlighted this development via X: “Bitcoin buy walls on all exchanges are now strong enough to neutralize sell walls.”

This shift marks a significant change from the trend observed since May 2021. “Data from the last cycle (2020-2022). It’s the accumulated difference between quoted buy and sell volumes. Since May 2021, sell walls had been consistently thicker than buy walls until the end of the cycle,” Young Ju shared.
#3 Surge In Spot Bitcoin ETF Inflows
Monday witnessed one of the highest Bitcoin ETF inflows on record, totaling $555.9 million—the largest net inflow day since June 3. This substantial capital influx was spread among several major asset managers. BlackRock received $79.5 million, Fidelity attracted $239.3 million, Bitwise accumulated $100.2 million, Ark Invest saw inflows of $69.8 million and the Grayscale Bitcoin Trust (GBTC) experienced inflows of $37.8 million.
Nate Geraci, President of The ETF Store and host of the ETF Prime podcast, commented on these inflows via X: “Monster day for spot btc ETFs… $550mil inflows. Now approaching *$20bil* net inflows in 10mos. Simply ridiculous & blows away every pre-launch demand estimate. This is NOT “degen retail” $$$ IMO. It’s advisors & institutional investors continuing to slowly adopt.”
At press time, BTC traded at $65,750.
Ripple announces exchange partners for RLUSD stablecoin

More regulatory-compliant stablecoins like RLUSD could benefit mainstream crypto adoption worldwide.
First Mover Americas: Bitcoin Takes Bull Breather
The latest price moves in bitcoin (BTC) and crypto markets in context for Oct. 15, 2024. First Mover is CoinDesk’s daily newsletter that contextualizes the latest actions in the crypto markets.
Ripple Names Exchange Partners for Stablecoin RLUSD, Awaits NYDFS Approval
Ripple’s upcoming stablecoin will leverage its established position for payments and be a key bridge for real-world asset tokenization, Ripple Labs President Monica Long told CoinDesk in an interview.
Cash-Margined Bitcoin Futures are More Popular Than Ever as Open Interest Reaches New Highs
Cash-Margin denominated in bitcoin hits all-time high of 384k BTC ($25.5B)


