OpenAI said its new “Preparedness Framework” aims to help protect against “catastrophic risks” when developing high-level AI systems.
Cryptocurrency Financial News
OpenAI said its new “Preparedness Framework” aims to help protect against “catastrophic risks” when developing high-level AI systems.

New updates to BlackRock’s spot Bitcoin ETF filing come as BTC price strength narrowly retains $40,000 as support.
ARK Invest offloaded $13M worth of GBTC shares last week.
Driven by heightened futures trading volumes and leverage, the price of Injective (INJ) has soared to unprecedented levels of around $38.49, marking a remarkable 2,700% surge year-to-date.
Notably, within a single day, the native token of the decentralized finance (DeFi) platform Injective, exhibited resilience and potential, demonstrating a noteworthy increase of 24% in its value.
In the context of the cryptocurrency market’s ever-changing dynamics, INJ has emerged as a standout performer, positioning itself as one of the top gainers amidst the series of surges and corrections experienced by leading tokens.
Analysts have identified a number of major factors that have contributed to this startling rally, including the surge in trading volumes for INJ perpetual futures contracts, which exceeded $25.5 billion in a single day, the incentives offered by centralized exchanges to create volatility, and the acceleration of short-term traders who are seeking leverage.
The weekly timeframe’s technical analysis reveals that the price of INJ has risen sharply since the year’s beginning. As of this writing, the altcoin has experienced a strong seven-day gain of 45%.
The price increase for INJs reached a new peak of $34.60 last week, representing an increase of 2,700% in 2023.
Based on a mix of technical indicators and fundamental factors, cryptocurrency traders and analysts on X are optimistic about the direction of the INJ price trend going forward.
Experts are more confident due to Injective’s decentralized finance (DeFi) platform’s increasing popularity and strong performance in spite of market turbulence.
Meanwhile, here’s what the analysts are saying about INJ’s price performance this week:
Our Crypto Talk is optimistic for basic reasons. The account stated that leverage-driven accumulation, exchange incentives for volatility, and the boom in perpetual futures trading were the three key drivers of the continuous rising trend.
$INJ is making highs after highs and investors are in love with it.
But what has possibly happened in the recent days that ignited this price action?
Let’s check it out
Surge in Perpetual Futures Trading: Injective Protocol’s significant price increase is propelled by a… pic.twitter.com/IUWZPJeiCU
— Our Crypto Talk (@ourcryptotalk) December 14, 2023
Victorious, another cryptocurrency analyst, is upbeat because of a short-term Wyckoff Accumulation pattern.
In financial markets, the Wyckoff Accumulation pattern is a technical analysis idea that is very useful when trading equities or cryptocurrencies.
Would love to long $INJ inside the H1 FVG, clean IRDRI
Or is this an already swept range so price can go either way?
Or is this just a bearish H1 structure so shorts are favored?
Or did we lose the “trendline” so we are going to 0?
This just shows that you can draw whatever… pic.twitter.com/d39486NqvB
— Victorious (@victorious__5) December 17, 2023
It denotes a stage of buying or accumulation by institutional or smart money investors. A sequence of price consolidations, in which the asset’s price fluctuates within a predetermined range, define the pattern.
As a result of its strong and adaptable performance, Injective Protocol has been widely used in the bitcoin market. Proof of this is its latest collaborations with some of the crypto market’s biggest players.
Carbon Browser made a big announcement on X on December 7, 2023, confirming the incorporation of Injective Protocol into their platform.
Big names in the industry including Mark Cuban, Binance, and Pantera have backed Injective Protocol, which is the quickest Layer 1 blockchain for finance.
This strategic integration signifies a pivotal progression in the promotion of a financial ecosystem that is both more inclusive and efficient.
The remarkable trajectory of Injective is proof of the cryptocurrency market’s dynamism as well as the opportunities that arise from savvy alliances and technical breakthroughs.
Featured image from PIxabay

Some suggest EVM inscriptions are the latest way for retail to access low-cap coins, while others argue it’s an over-hyped fad. Whatever it is, it’s clogging up the blockchain.
Solana stayed above the $67.50 support and started a fresh increase. SOL price is gaining pace and might soon attempt a move above $80.
In the past few days, Solana saw a downside correction from the $80.00 zone, like Bitcoin and Ethereum. SOL declined below the $77.50 and $75.00 support levels.
However, the bulls were active above the $67.50 support. A low was formed near $67.25, and the price is now attempting a fresh increase. There was a move above the $70 and $72 resistance levels. The price is up nearly 8% and there was a move above the 50% Fib retracement level of the downward move from the $79.45 swing high to the $67.25 low.
SOL is now trading above $74 and the 100 simple moving average (4 hours). There is also a key bullish trend line forming with support near $70.00 on the 4-hour chart of the SOL/USD pair.
On the upside, immediate resistance is near the $76.50 level. It is near the 76.4% key bullish trend line forming with support near $70.00 on the 4-hour chart of the SOL/USD pair. The first major resistance is near the $80.00 level.
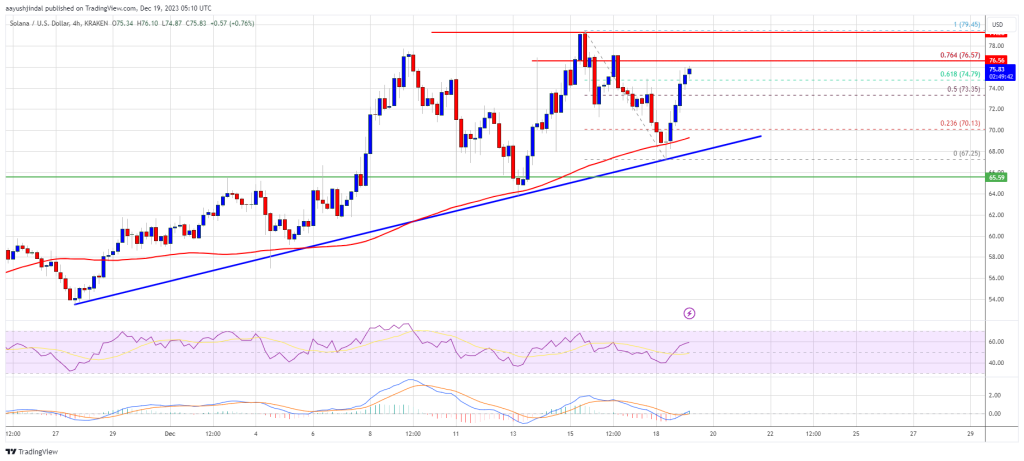
Source: SOLUSD on TradingView.com
The main resistance is now near $82.0. A successful close above the $82.0 resistance could set the pace for another major rally. The next key resistance is near $88.00. Any more gains might send the price toward the $92.00 level.
If SOL fails to rally above the $80.00 resistance, it could start a fresh decline. Initial support on the downside is near the $72.00 level.
The first major support is near the $70.00 level or the trend line, below which the price could test $67.50. If there is a close below the $67.50 support, the price could decline toward the $65.00 support in the near term.
Technical Indicators
4-Hours MACD – The MACD for SOL/USD is gaining pace in the bullish zone.
4-Hours RSI (Relative Strength Index) – The RSI for SOL/USD is above the 50 level.
Major Support Levels – $72.00, and $70.00.
Major Resistance Levels – $76.50, $80.00, and $88.00.

A decision by bloXroute Labs to start censoring OFAC-sanctioned blocks has been seen as a loss for Ethereum censorship resistance.
Ethereum price is recovering losses from the $2,120 support. ETH is up over 3% and the price could gain pace if it clears the $2,250 resistance.
Ethereum price extended its decline below the $2,150 level. ETH remained strong above the $2,120 level. A low was formed near $2,116 and the price started a fresh increase, like Bitcoin.
There was a move above the $2,150 and $2,200 resistance levels. The price climbed above the 50% Fib retracement level of the downward move from the $2,332 swing high to the $2,116 low. There was also a break above a key bearish trend line with resistance near $2,210 on the hourly chart of ETH/USD.
Ethereum is now trading above $2,200 and the 100-hourly Simple Moving Average. On the upside, the price is facing resistance near the $2,250 level. It is close to the 61.8% Fib retracement level of the downward move from the $2,332 swing high to the $2,116 low.
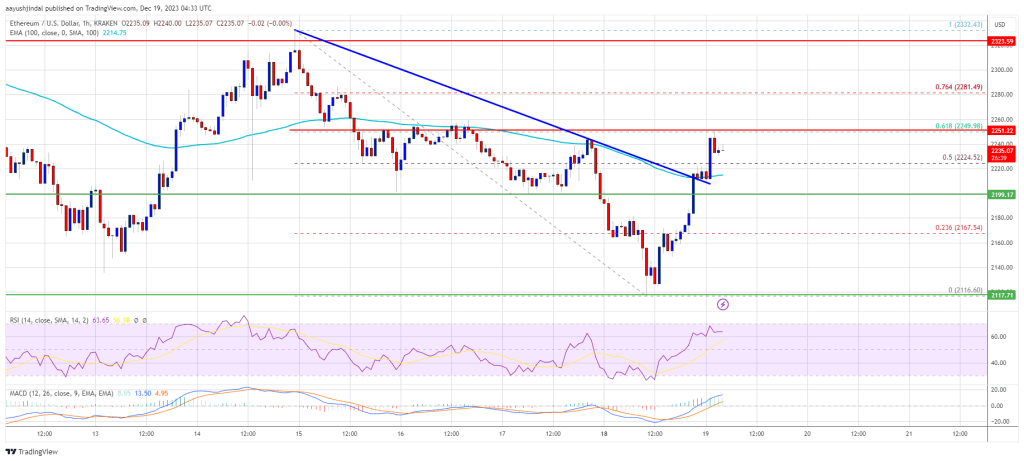
Source: ETHUSD on TradingView.com
The next key resistance is near the $2,280 level. A clear move above the $2,280 zone could send the price toward the $2,330 level. The next resistance sits at $2,400. Any more gains could start a wave toward the $2,550 level, above which Ethereum might rally and test the $2,750 zone.
If Ethereum fails to clear the $2,250 resistance, it could start another decline. Initial support on the downside is near the $2,210 level or the 100 hourly SMA.
The first key support could be the $2,200 zone. A downside break and a close below $2,200 might start another major decline. In the stated case, Ether could revisit the $2,120 support. Any more losses might send the price toward the $2,000 level in the coming days.
Technical Indicators
Hourly MACD – The MACD for ETH/USD is gaining momentum in the bullish zone.
Hourly RSI – The RSI for ETH/USD is now above the 50 level.
Major Support Level – $2,200
Major Resistance Level – $2,250
Black Rock’s ETF proposal now includes cash redemptions, a concession to the SEC that may improve the fund’s approval odds.
Spanish police successfully dismantled a network involved in financing ISIS through crypto transactions, resulting in the arrest of five individuals over the weekend. The operation, part of a two-and-a-half-year investigation, targeted individuals allegedly connected to the terrorist organization known as DAESH or ISIS.
The arrests were made in Valencia (2), Cáceres, Alicante, and Guipúzcoa. Four of the suspects have been remanded in custody by court order.
According to the official statement of the Spanish national police, the operation marks the second phase of “MIYA,” an initiative launched in 2021 by Spain’s National Police General Information Commissariat (CGI).
The investigation received collaboration from intelligence and security services in twelve countries, including the Moroccan Surveillance du Territoire (DGST), the Algerian Direction Générale de la Sécurité Intérieure (DGSI), the Mauritanian Direction Générale de la Sûreté Nationale (DGSN), the US Federal Bureau of Investigation (FBI), Swiss FEDPOL, and EUROPOL.
Within Spain, the CGI worked closely with its Provincial Information Brigades in Valencia, Alicante, Cáceres, and San Sebastián and the National Intelligence Center (CNI). The Central Court of Instruction number 6 and the Prosecutor’s Office of the National Court coordinated the investigation.
The initial phase of the operation, conducted after a year and a half of investigation, uncovered a person of Maghreb origin residing in Spain who was in contact with a jihadist seeking to carry out an attack in France on behalf of DAESH. The Spanish individual offered their collaboration to the radical extremists.
The CGI’s counterterrorism experts located the intended attacker in Switzerland and promptly shared the information with the Swiss FEDPOL. A joint operation was swiftly organized, resulting in the simultaneous arrest of the two individuals in March 2022, along with six others across Europe and the Maghreb.
The detainee in Spain was subsequently sentenced to two years in prison for terrorism-related charges and released in mid-2023.
Following the initial phase, CGI analysts discovered that the two detainees were part of an international network supporting DAESH, spanning multiple continents, including Afghanistan, the Middle East, Sahel, Maghreb, and Europe.
The network allegedly obtained funds through criminal activities in Europe to finance their terrorist operations with crypto. Large sums of money were moved through international transfers and crypto, with authorities seizing nearly 200,000 euros worth of digital assets.
According to the official statement, members of the network also engaged in indoctrination, attempting to recruit new followers to the jihadist cause and providing support to individuals expressing a desire to carry out terrorist attacks.
The investigation uncovered evidence suggesting the network’s involvement in planning at least two attacks, ultimately foiled by security services.
The recent arrests in Spain mark the conclusion of the investigation, with five individuals taken into custody. One of the suspects exhibited signs of radicalization in recent months and had expressed a desire to carry out an attack.
During a search of the individual’s residence, authorities discovered handgun ammunition, an ax, manuals for making explosives, manuals for indoctrinating minors, and jihadist propaganda.
As of the current update, the total market capitalization of the cryptocurrency market is $1.525 trillion, reflecting a decline of over 2% within the past 24 hours.
Featured image from Shutterstock, chart from TradingView.com
Bitcoin price jumped from the $40,500 support zone. BTC is up over 5% but the bears are still defending the $43,500 resistance zone.
Bitcoin price extended its decline below the $41,200 support level. However, BTC remained well-bid above the $40,500 support zone. A low was formed near $40,515 and the price started a fresh increase.
There was a steady increase above the $41,200 and $42,000 levels. There was a break above a major bearish trend line with resistance near $41,850 on the hourly chart of the BTC/USD pair. The pair rallied above the $43,000 resistance zone.
Bitcoin is now struggling to clear the key $43,500 resistance zone. A high is formed near $43,464 and the price is now consolidating gains. It is above the 23.6% Fib retracement level of the upward move from the $40,515 swing low to the $43,464 high.
It is well above $42,000 and the 100 hourly Simple moving average. On the upside, immediate resistance is near the $43,250 level. The first major resistance is forming near $43,500. A close above the $43,500 resistance might start a steady increase.
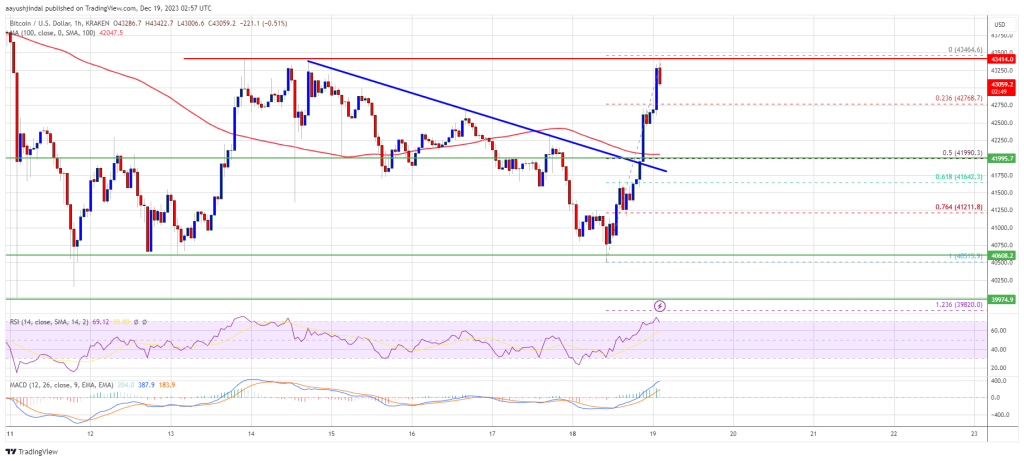
Source: BTCUSD on TradingView.com
The next key resistance could be near $44,200, above which BTC could rise toward the $45,000 level. A clear move above the $45,000 level could set the pace for a test of $46,500.
If Bitcoin fails to rise above the $43,500 resistance zone, it could start a fresh decline. Immediate support on the downside is near the $42,750 level.
The next major support is near $42,000 or the 50% Fib retracement level of the upward move from the $40,515 swing low to the $43,464 high. If there is a move below $42,000, there is a risk of more losses. In the stated case, the price could drop toward the $40,500 support in the near term.
Technical indicators:
Hourly MACD – The MACD is now gaining pace in the bullish zone.
Hourly RSI (Relative Strength Index) – The RSI for BTC/USD is now above the 20 level.
Major Support Levels – $42,750, followed by $42,000.
Major Resistance Levels – $43,200, $43,500, and $45,000.
According to Dan Tapiero, Managing Partner at 10T Holdings, the Bitcoin and crypto market is on the verge of a major transformation, with the world’s most valuable coin likely to soar to over $200,000 by May 2024. Citing data by Raoul Paul, the CEO of Real Vision, Tapiero suggests that traditional money managers must take notice and prepare for a paradigm shift in the financial landscape.
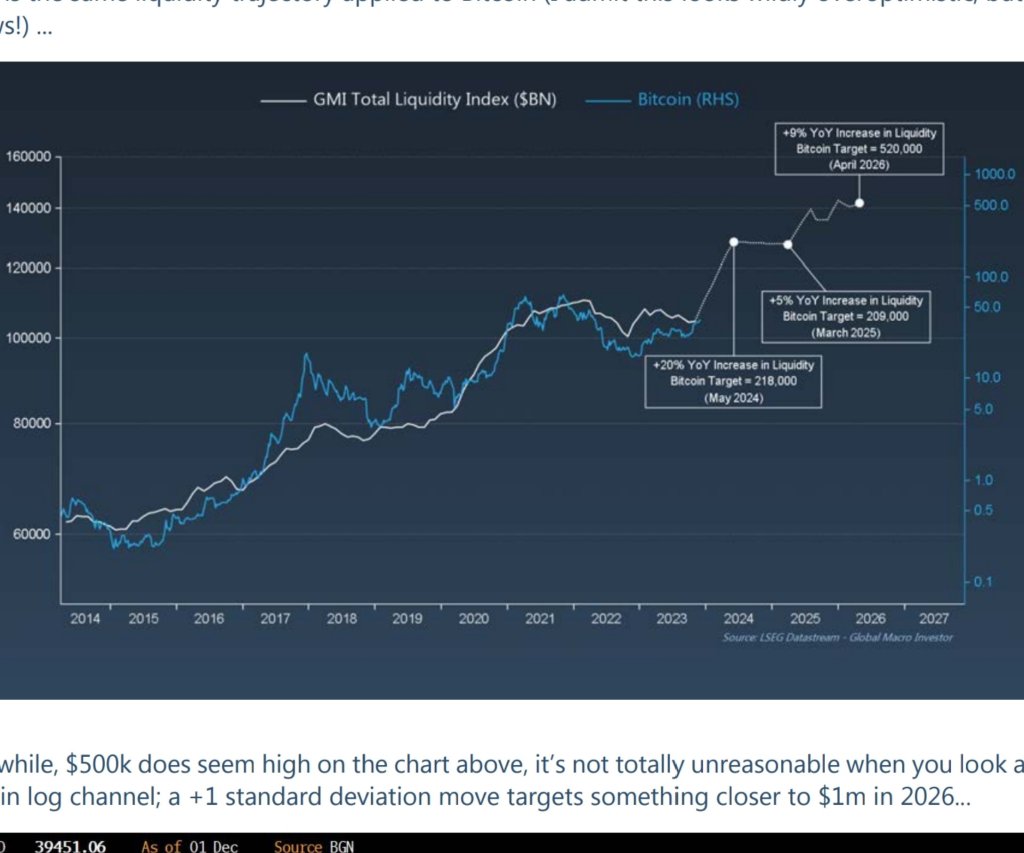
Tapiero bases this bullish forecast on the expected BTC liquidity surge in the coming months. Market participants hope the stringent Securities and Exchange Commission (SEC) will approve the first batch of Bitcoin ETFs in the next few trading weeks.
The Bitcoin ETF, set to be issued by some mainstream players in traditional finance, including BlackRock, will provide regulated vehicles through which institutional investors can get exposure to the coin. Based on Tapiero’s analysis, as more and more institutions adopt Bitcoin, its liquidity will increase, boosting prices.
With a Bitcoin ETF on the table, it would also mean the release of institutional-grade Bitcoin trading platforms. This will cement Bitcoin’s position in the industry and its potential role in reshaping finance.
Paul’s monthly GMI data, which tracks the sentiment of institutional investors, as Tapiero mentions, further reinforces the general bullish sentiment across the board. Looking at the GMI total liquidity index, the trend has been rising, suggesting that institutional interest in Bitcoin has also increased.
This trend also indicates that more funds and asset managers are likely allocating more of their portfolios to Bitcoin, expecting to ride the leg up or be on the safe side.
Looking at Tapiero’s preview, the managing partner thinks rising prices will seriously affect traditional money managers. As such, if Bitcoin rallies to $200,000 on increasing liquidity, in the partner’s assessment, ignoring this asset class could pose a significant career risk.
Notably, Tapeiro opines that managers who fail to embrace the transformative power of Bitcoin may trail. This is because crypto will continue to evolve and find adoption.
As of December 18, Bitcoin is firmly in an uptrend and expanding with rising trading volume. The coin is up 64% from its September 2023 lows. Though there has been a cool-off in the past few trading days, prices are trending above the 20-day moving average.
Accordingly, in the days ahead, how prices pan out will shape the medium term. As it is, the immediate resistance level lies at around $44,500. If buyers take charge, the coin may float to $50,000. Afterward, it may float to the all-time high of $69,000 in the sessions ahead.

The SEC has pushed back its decision on a roster of Ethereum ETFs, with the final date for a potential approval arriving in late May.
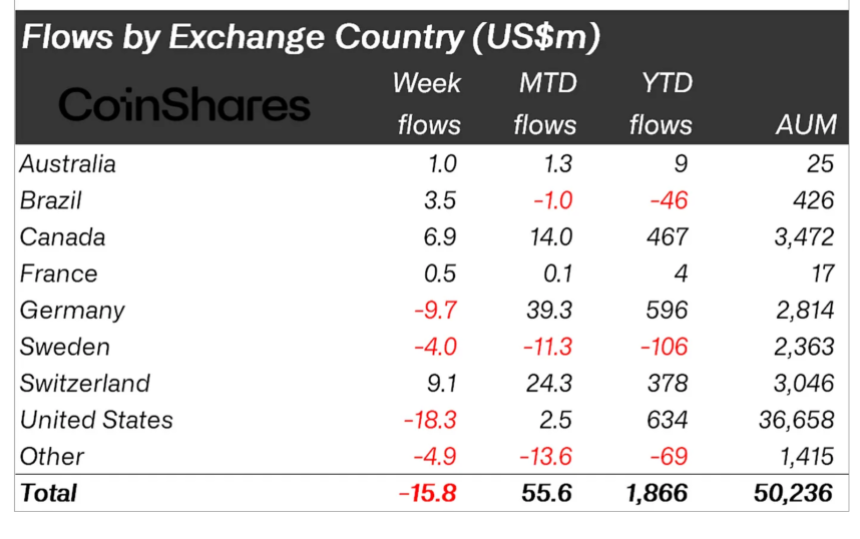
The crypto investment landscape has experienced a notable shift recently, as digital asset investment products saw their first net outflows in 11 weeks. This development was predominantly led by Bitcoin, which had previously enjoyed a consistent inflow into various crypto funds.
In a recent report by CoinShares, a leading digital asset management firm, last week marked a break in an 11-week streak of inflows, with a net outflow of $16 million. This change signals a potential reevaluation among investors regarding their positions in digital assets.
Bitcoin-based funds were at the forefront of this movement, experiencing significant outflows. Last week, these funds experienced a net outflow of $32.8 million, while short Bitcoin investment products also saw a minor outflow of $300,000.
Despite this, trading activity for Bitcoin remained robust, grossing $3.6 billion last week, substantially higher than the $1.6 billion yearly average.
James Butterfill, Head of Research at CoinShares, analyzed the outflows and suggested that the net flows were primarily driven by the US and German markets, which saw outflows of $18.3 million and $9.7 million, respectively.
In contrast, markets such as Switzerland and Canada saw inflows, indicating a mixed regional response that leans more towards profit-taking rather than a wholesale sentiment shift in the asset class, according to Butterfill.
Interestingly, while Bitcoin and other major assets like Ethereum and Avalanche experienced outflows, altcoins such as Solana, Cardano, and XRP bucked the trend. They mainly registered inflows of $10.6 million, $3 million, and $2.7 million, respectively.
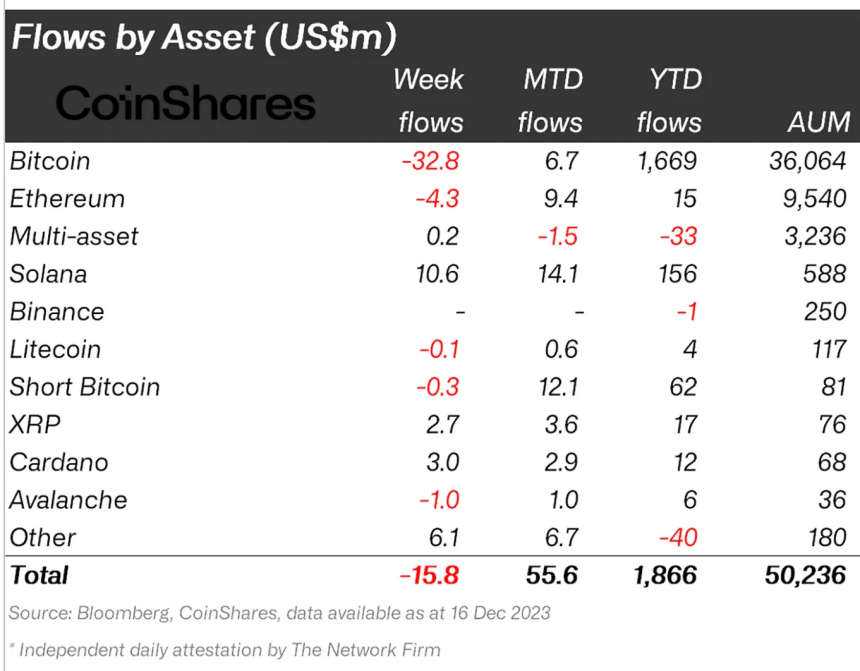
These movements underscore the diversification within the crypto asset class and highlight investor interest in a broader range of digital currencies beyond the dominant Bitcoin and Ethereum.
Blockchain equities also reflected a favourable sentiment, with inflows amounting to $122 million last week. This marks the continuation of a nine-week streak, accumulating $294 million in total — the largest streak to date.
This uptick in blockchain equities underscores the growing investor confidence in the technological infrastructure underpinning cryptocurrencies.
Regarding price performance, the past week saw mixed results among top crypto assets. While Bitcoin recorded a relatively modest decline of 1.8%, XRP and Ethereum saw more significant drops of 4.4% and 3.7%, respectively.
Conversely, altcoins such as Solana, Cardano, and Avalanche showcased appreciable gains. Avalanche led the pack with an increase of over 10% in the past week, followed by Solana and Cardano with gains of 3.1% and 3.6%, respectively.
Featured image from iStock, Chart from TradingView
Data shows Bitcoin is losing a major region of on-chain support with its latest plunge. Here’s the range where the next zone lies for the asset.
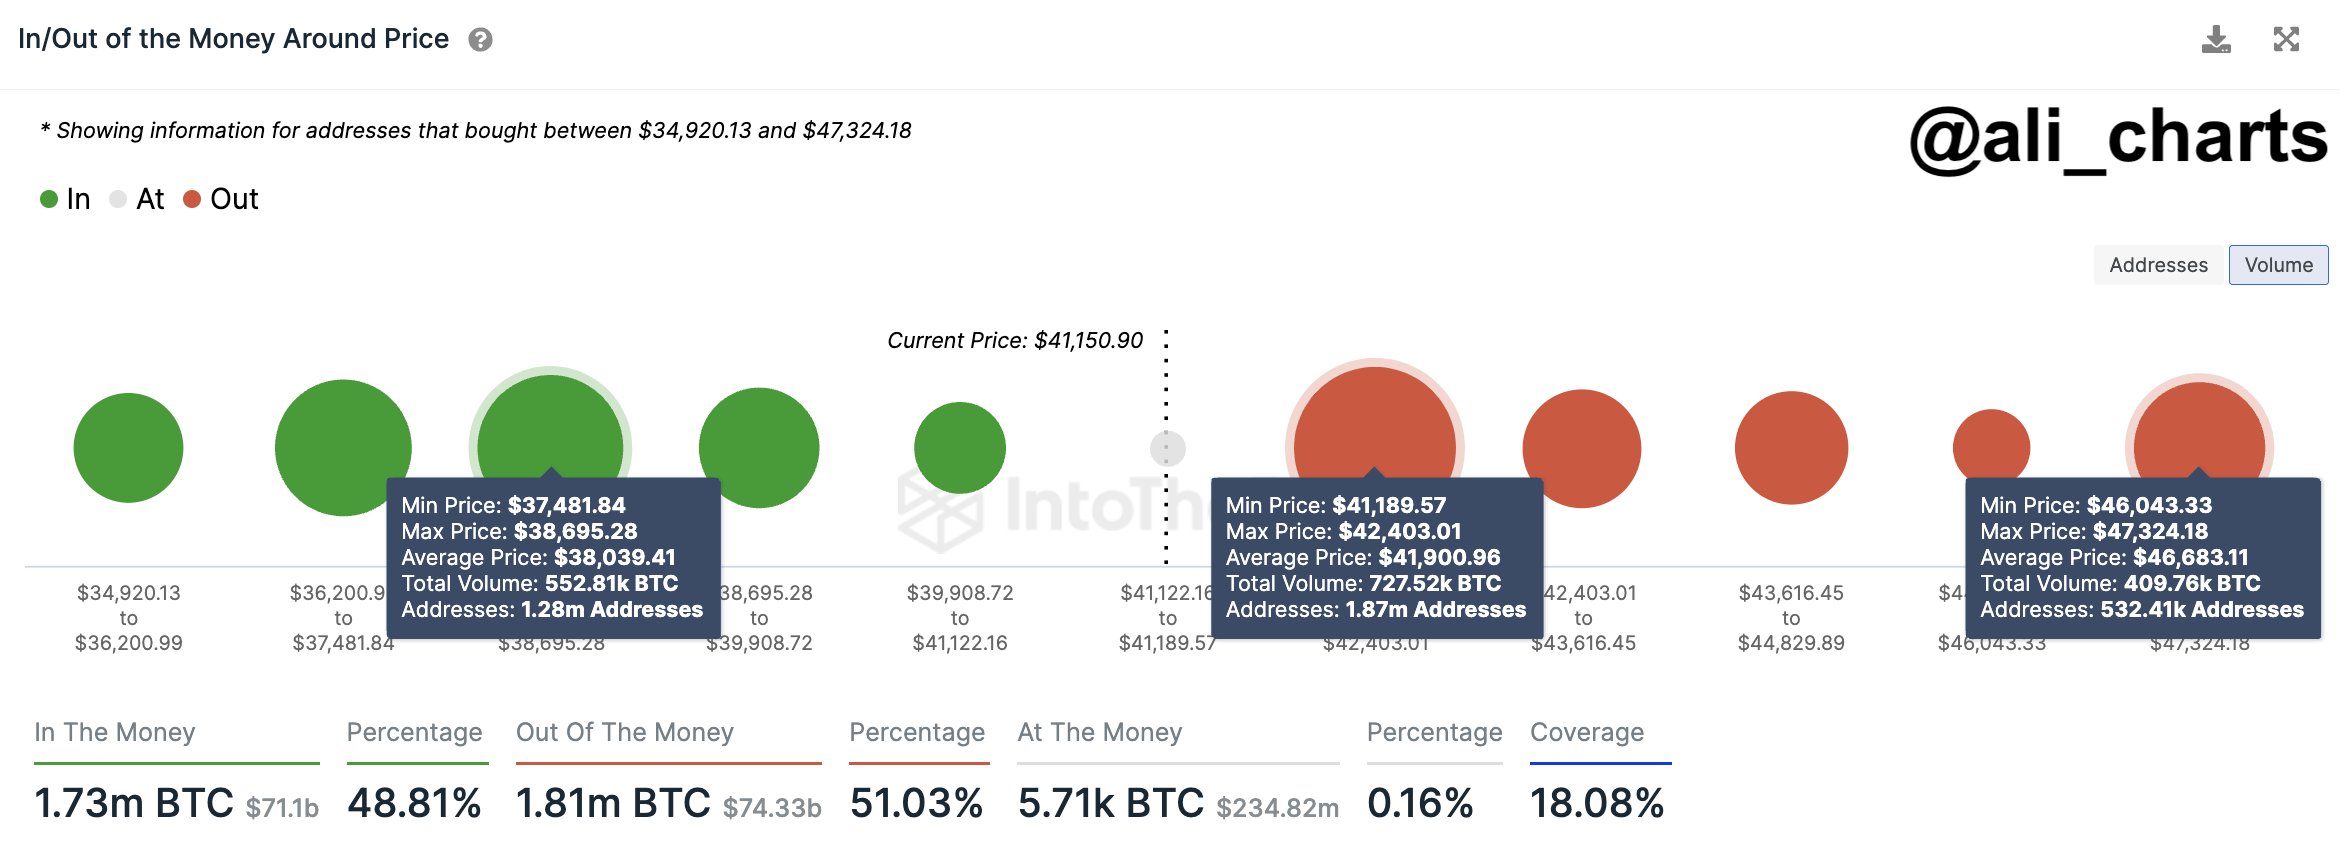
As explained by analyst Ali in a post on X, BTC has slipped under a key on-chain support zone today. An “on-chain support” range refers to a price below the current spot price of the cryptocurrency that hosts the cost basis of many investors.
For any holder, the cost basis, the price at which they bought their coins, is a fundamental level, as a retest of it by the cryptocurrency can change their profit-loss balance.
Investor psychology works such that if this retest of the cost basis happens from above (meaning that the holder had been carrying profits before this), the holder might react by buying more of the asset because they may believe this same price range could turn out to be profitable again in the future.
On the other hand, any investor who had been in a loss earlier could become likely to sell when the price reaches its break-even mark, as they wouldn’t want to miss out on the opportunity to escape without any losses if the asset happens to drop again shortly.
The individual investors’ reactions aren’t generally relevant to the market as a whole. Still, if many holders show this reaction at once, the combined force can cause fluctuations in the price.
Now, here is a chart that shows what the different price ranges look like for Bitcoin in terms of the number of addresses who bought at them:
As displayed in the above graph, the Bitcoin range between $41,200 and $42,400 is quite thick with investors. In total, 1.87 million addresses have bought 727,520 BTC at these levels.
Bitcoin has been moving in and out of this crucial support region the past day, suggesting that the zone may weaken. If the range gets lost, BTC might see an extended drop below towards the next major support zone.
The chart shows that the $37,400 to $38,700 range is where substantial on-chain support could next be available, as 1.28 million addresses have their cost basis.
Thus, Bitcoin may be at risk of declining to as low as $38,000 (the average price of the range) shortly. In the potential scenario of such a drawdown, the current $41,200 to $42,400 range could also become resistance, as these addresses would become loss holders desperate to leave.
Bitcoin slipped toward the $40,500 level during the past day but has since recovered to the $41,600 mark. It would appear that the support may not be entirely lost yet.
Aurory (AURY), a blockchain-based tactical Japanese role-playing game built on Solana (SOL), recently experienced a significant liquidity loss in its Camelot’s AURY-USDC pool.
The incident occurred due to a hack on the SyncSpace bridge, which resulted in the unauthorized withdrawal and subsequent market sale of approximately 600,000 AURY tokens on the Arbitrum (ARB) network.
In an official statement released on December 17, Aurory’s team disclosed the details of the incident. The team detected unusual activity on their marketplace and promptly initiated an investigation, which revealed that a malicious actor had exploited the marketplace’s buy endpoint.
This exploit allowed the attacker to inflate their AURY balance in SyncSpace, enabling them to withdraw around 600,000 tokens to the Arbitrum network. The attacker then liquidated the stolen amount by selling it in the market.
To protect user funds, SyncSpace was promptly disabled for maintenance, temporarily suspending deposits and withdrawals. Importantly, the statement assured that no user funds or non-fungible tokens (NFTs) were lost or at risk during the incident.
The AURY tokens originated from a team wallet, facilitating withdrawals for accounts not previously deposited AURY.
The Aurory statement emphasized that the exploit is no longer ongoing, as SyncSpace remains offline for maintenance. As a result, there is currently no risk of further exploits. Additionally, it was confirmed that the attacker has exhausted their AURY supply and no longer possesses any tokens to sell.
Moreover, SyncSpace will investigate further to determine how the exploit went undetected despite the previous expert audit.
The team also plans to release a comprehensive post-mortem report once the necessary fixes have been implemented and the investigation concludes. They expect SyncSpace to be back online in the coming days.
Since October 30, the price of Aurory’s token, AURY, has experienced a significant upward trend, culminating in a yearly high of $1.9008 on December 12. However, following the recent exploit, the price of AURY has retraced to $1.0868, marking a decline of 23.5% over the past 24 hours and 36.5% over the past seven days.
Despite this setback, AURY still boasts substantial gains of 74% and 70% over the 30-day and one-year periods, respectively.
The market now awaits to see whether the token’s support lines at $0.9681 and $0.9086 will be able to halt the potential continuation of the price drop or if they will succumb to the prevailing downtrend, putting a significant portion of its 2023 gains at risk.
Featured image from Shutterstock, chart from TradingView.com
A small ESG-focused crypto asset manager, 7RCC, is the latest applicant to join the race for a spot-bitcoin exchange traded fund (ETF), a filing with the Securities and Exchange Commission (SEC) shows.

The new CEO, Josh Swihart, has been the vice president at Electric Coin for nearly five years but recently took a four month stint away from the firm.
The machine learning algorithm at CoinCodex has predicted when the Cardano price will reach a new all-time high. The coin which has been performing quite well in the last few weeks is still miles away from its current all-time high of $3.1. However, the machine learning algorithm has revealed when it will cross this level once more.
According to the CoinCodex machine learning algorithm, the Cardano price may be locked into years of performing below its 2021 all-time high prices before finally revisiting It around five years from now. Apparently, while the next few years will see the price jump another 200% from its current price, breaking above $3.1 will remain elusive.
The year 2024 which is expected to be the start of another crypto bull market will reportedly see ADA only rise as high as $2.98, falling just short of its previous all-time high. Then in the years 2025 and 2026, its max performance is pegged even lower with $2.42 in 2025 and $0.8 in 2026.
The year 2027 is expected to follow the same trend as 2026 with a min value of $0.5 and a maximum value of $0.86. However, in 2028, this is expected to completely change to the point where the ADA price will reach a brand-new all-time high.
Cardano’s max price for the year 2028 is said to be $6.52 by the machine learning algorithm with a minimum price of $0.73. Then in the following year of 2029, it expects a minimum value of $1.1 and a max value of $4.99. Finally, the year 2030 is placed at a minimum of $0.65 and a maximum of $1.36.
Contrary to the CoinCodex machine learning algorithm saying that the Cardano price will not reach a new all-time high until the year 2028, crypto analysts have come forward with their own bullish predictions. One analyst Psyclops expects the price to climb to $10 amid the rapid growth that is being recorded in the Cardano ecosystem.
Another crypto analyst known as Crypto Crow says that they expect the price to reach $32. The time frame from this analyst is that they expect this to happen in the next bull market and since the next bull market is expected to take place between 2024 and 2025, it gives it a two-year timeframe.
Finally, crypto analyst Dan Gambardello has predicted that the Cardano price will reach $11. His reasoning lies with the past performance of the digital asset which has performed very well in each bull market. Gambardello expects that if ADA sticks to historical performance, then the market cap of the altcoin will climb to $400 billion by the year 2025.

Unstoppable Domains recently integrated .com domains into its platform. What implications could this move have?