By James Van Straten (All times ET unless indicated otherwise)
Fear is gripping financial markets, triggered largely by President Donald Trump’s tariff announcements, with Hong Kong stocks plunging 14% on Monday, the most since the Asian Financial Crisis in 1997, and Taiwan and Japanese stocks sliding 10%.
European equities didn’t fare much better. The FTSE 100, DAX and CAC 40 are each down more than 5%.
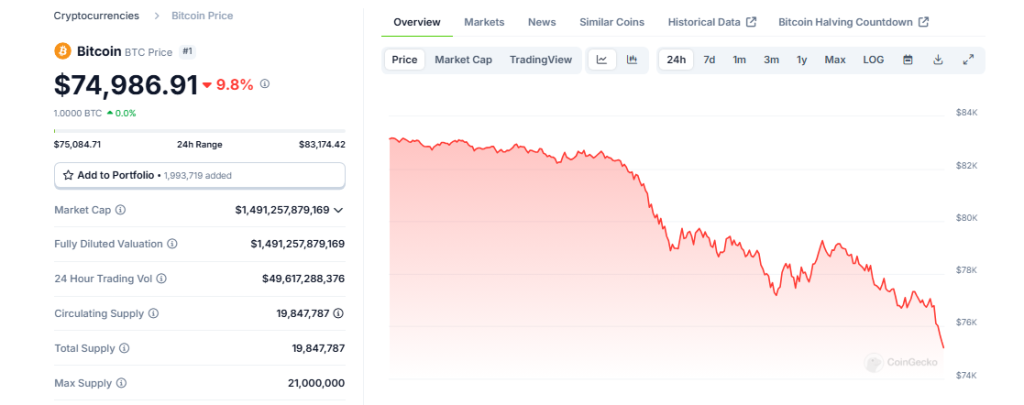
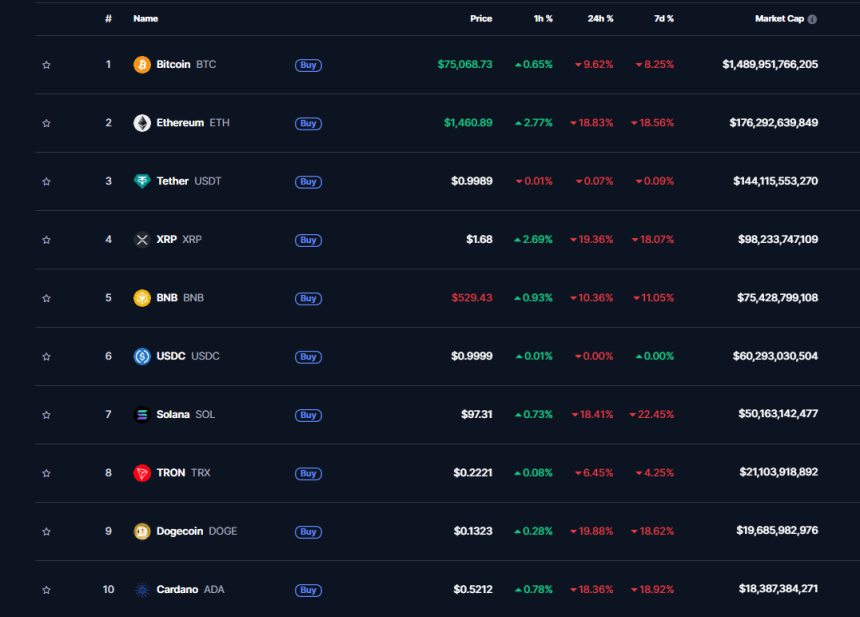
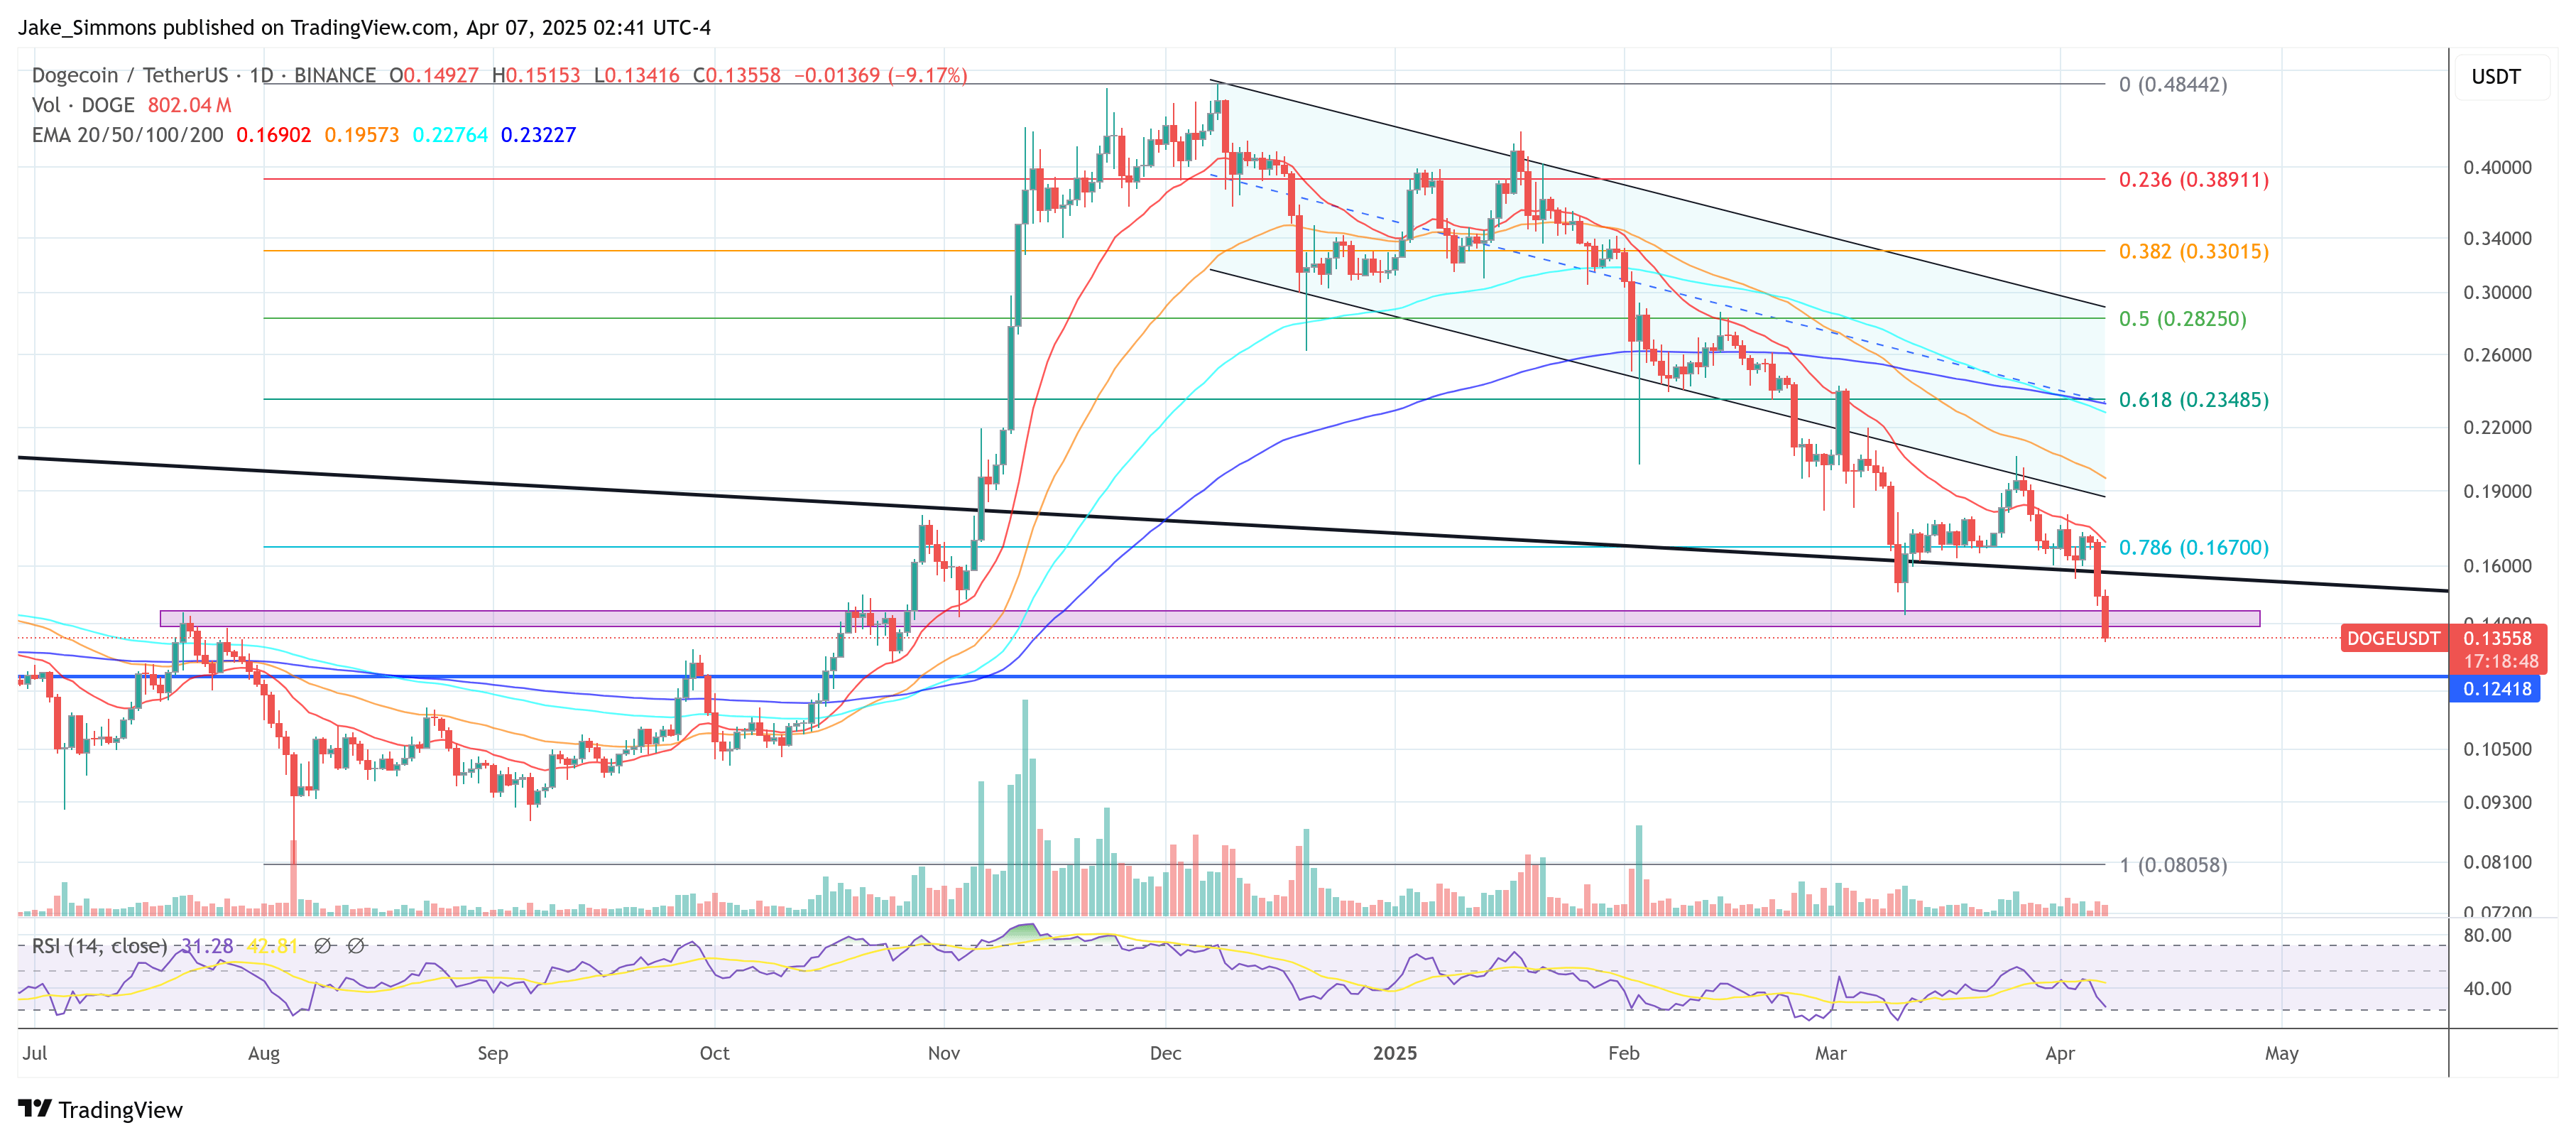
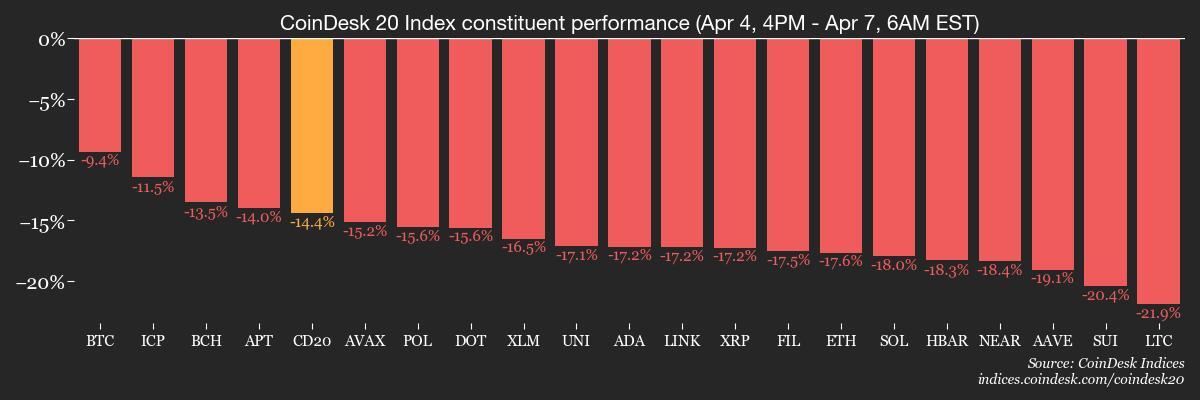
Nor were crypto markets immune. Bitcoin (BTC) fell 10% over 24 hours, dipping below $75,000, and ether (ETH) plunged 22%. XRP and SOL also nosedived more than 20%, while DOGE is down more than 15%. Bitcoin dominance continues to rise, hitting 63%, a level not seen since early 2021. The CoinDesk 20 index, a measure of the broader market, has lost almost 12% in the past day.
As for U.S. equities, the S&P 500 is set to start the week already in bear market territory — down 20% from its all-time high and 5% lower in pre-market trading — and on course for what could be the worst three-day performance in its history.
China, whose stocks fell 7%, is reportedly considering front-loading stimulus measures to soften the blow. On Friday, it announced a reciprocal 34% tariff on all U.S. goods.
“We have massive financial deficits with China, the European Union, and many others,” Trump wrote on Truth Social over the weekend. “The only way this problem can be cured is with tariffs, which are now bringing tens of billions of dollars into the U.S. They are already in effect, and a beautiful thing to behold… We are going to reverse [the deficit], and reverse it quickly. Someday people will realize that tariffs, for the United States of America, are a very beautiful thing!”
So, where can investors seek refuge? For now, it seems to be U.S. bonds. The 10-year note is up 8% year-to-date, while the iShares 20+ Year Treasury Bond ETF (TLT), which tracks the long end of the yield curve, is up 6% as investors pile into government debt, pushing yields lower. This drop in yields is a welcome sign for the U.S. administration.
Seasoned investor Bill Ackman noted that Secretary of Commerce Howard Lutnick doesn’t appear concerned about a potential economic crash, hinting that Lutnick and Cantor Fitzgerald, the financial services firm he used to head, are long bonds. Ackman suggested on X that they could be positioned to profit from a downturn.
What’s next? Watch for countries scrambling to avoid the tariffs. Some, like Argentina, Taiwan and India, are already showing signs of conceding and removing tariffs on U.S. imports. The uncertainty surrounding these negotiations will likely keep markets volatile as the Volatility S&P 500 Index (VIX) hits 60 in pre-market trading. That’s the highest level since August 2024. These are definitely times to stay alert!
What to Watch
Crypto:
April 7, 8:30 p.m.: Syscoin (SYS) activates the Nexus upgrade on its mainnet at block 2,010,345.
April 9: The Mercury network upgrade gets applied to the Neutron (NTRN) mainnet, migrating it “from Cosmos Hub’s Interchain Security to a fully sovereign PoS network.”
April 9, 10 a.m.: U.S. House Financial Services Committee hearing about how U.S. securities laws could be updated to take into account digital assets. Livestream link.
April 10, 10:30 a.m.: Status conference for former Terraform Labs CEO Do Hyeong Kwon at the U.S. District Court for the Southern District of New York.
April 11, 1 p.m.: U.S. SEC Crypto Task Force Roundtable on “Tailoring Regulation for Crypto Trading” in Washington.
Macro
April 9, 12:01 a.m.: The Trump administration’s higher individualized tariffs on imports from top U.S. trade deficit countries take effect.
April 9, 12:01 p.m.: China’s 34% retaliatory tariffs on U.S. imports take effect.
April 14: Salvadoran President Nayib Bukele will join U.S. President Donald Trump at the White House for an official working visit.
Earnings (Estimates based on FactSet data)
No earnings scheduled.
Token Events
Governance votes & calls
Sky DAO is voting on an executive proposal that includes a number of initiatives including initializing ALLOCATOR-BLOOM-A with a 0% stability fee and a 10 million USDS debt ceiling, updating the Smart Burn Engine’s “hop” parameter and extending SparkLend’s liquidity operations. Voting ends May 3.
Uniswap DAO is discussing a proposal to support v4 expansion with the creation of subdomains to track BSL license exemptions and official deployments, granting the Uniswap Foundation a blanket license to deploy v4 on target chains.
April 7, 9 a.m.: OriginTrail to host a “Shaping AI for Good” Zoom talk.
April 7, 11:30 a.m.: Jupiter’s team to discuss DAO processes, working groups, its LFG v2, and more.
April 7, 4 p.m.: Livepeer to host a monthly community call focused on governance, funding, and the strategic direction of its on-chain treasury.
April 10, 10 a.m.: Header to host a community call discussing the HBR Foundation joining ERC3643, the non-profit’s standards, and the Header Asset Tokenization Studio.
Unlocks
April 8: Tensor (TNSR) to unlock 35.96% of its circulating supply worth $13.98 million.
April 9: Movement (MOVE) to unlock 2.04% of its circulating supply worth $15.13 million.
April 12: Aptos (APT) to unlock 1.87% of its circulating supply worth $47.5 million.
April 12: Axie Infinity (AXS) to unlock 5.68% of its circulating supply worth $21.27 million.
April 15: Starknet (STRK) to unlock 4.37% of its circulating supply worth $15.12 million.
April 16: Arbitrum (ARB) to unlock 2.01% of its circulating supply worth $24.49 million.
Token Listings
April 9: IOST airdrop claims portal for a roughly 1.7 billion IOST token airdrop to open.
April 10: Ren (REN), KonPay (KON), and Symbol (XYM) to be delisted from Bybit.
April 22: Hyperlane to airdrop its HYPER tokens.
Conferences
CoinDesk’s Consensus is taking place in Toronto on May 14-16. Use code DAYBOOK and save 15% on passes.
April 7: Liquidity 2025 Institutional Digital Asset Summit (Hong Kong)
April 7: VC Founders Summit (Paris)
April 8: Seine & Crypto Connect (Paris)
April 8-9: Digital Accord Summit 2025 (Paris)
April 8-10: Paris Blockchain Week
April 9: Blockchain & Finance – Evolution or Revolution? (Paris)
April 9: FinTech and Banking Unconference Colombia 2025 (Bogota)
April 9-10: FIBE Fintech Festival Berlin 2025
April 9-10: Mexico Finance & Fintech Summit 2025 (Mexico City)
April 9-10: Middle East Resilient Banking and Payments Symposium 2025 (Abu Dhabi)
April 10: Bitcoin Educators Unconference (Nashville)
April 10: FinXtex Malaysia 2025 (Kuala Lumpur)
April 10: Institutional Crypto Conference (New York)
April 10: SheFi Sumit 2025 (Seoul)
April 10-11: BITE-CON 2025 Conference (Miami)
April 10-11: 2025 Fintech and Financial Institutions Research Conference (Philadelphia)
April 11-12: Strategy’s OPNEXT Conference (Tysons, Va.)
April 12: Ethereum Argentina (Córdoba)
April 12-13: DeSci London 2025
Token Talk
By Shaurya Malwa
Ultimate Fighting Championship (UFC) celebrity Conor McGregor’s crypto token, tied to Real World Gaming DAO (RWG), flopped in its 28-hour presale, raising only $392,315 of its $1,008,000 minimum goal, leading to full refunds of all USDC bids from 668 investors.
RWG blamed “challenging macroeconomic conditions” and the “distracting meme narrative” for the failure, pausing the launch to recalibrate, with refunds processed via Ethereum by 3:53 p.m. on Sunday.
Despite the setback, RWG touted its use of Axis Finance’s sealed-bid auction as a transparent and fair mechanism, though it couldn’t set a clearing price for the REAL token.
McGregor had pitched the token as a “game changer” for crypto, not a celebrity gimmick, while RWG plans a relaunch despite the collapse.
Derivatives Positioning
Total bitcoin futures liquidations hit $58.8M in the past 24 hours, with longs accounting for nearly 75% of the tally. The figures show the positioning was bullish heading into the week, but not out of the ordinary.
Open interest in ether futures is holding near the recent record high of 2.24 million ETH while prices are falling as traders short in a slumping market.
ETH, XRP, BNB, SOL, TRX, DOGE and ADA are seeing negative perpetual funding rates, representing a bias for bearish short positions.
In Deribit’s options market, traders chased short-duration BTC puts at strikes ranging from $78K to $70K. Both BTC and ETH options showed pricier puts out to the June expiry.
Market Movements
BTC is down 8.12% from 4 p.m. ET Friday at $77,310.66 (24hrs: -6.59%)
ETH is down 16.7% at $1,514.40 (24hrs: -15.4%)
CoinDesk 20 is down 13.63% at 2,169.30 (24hrs: -11.83%)
Ether CESR Composite Staking Rate is down 10 bps at 2.92%
BTC funding rate is at 0.0059% (2.1374% annualized) on Binance
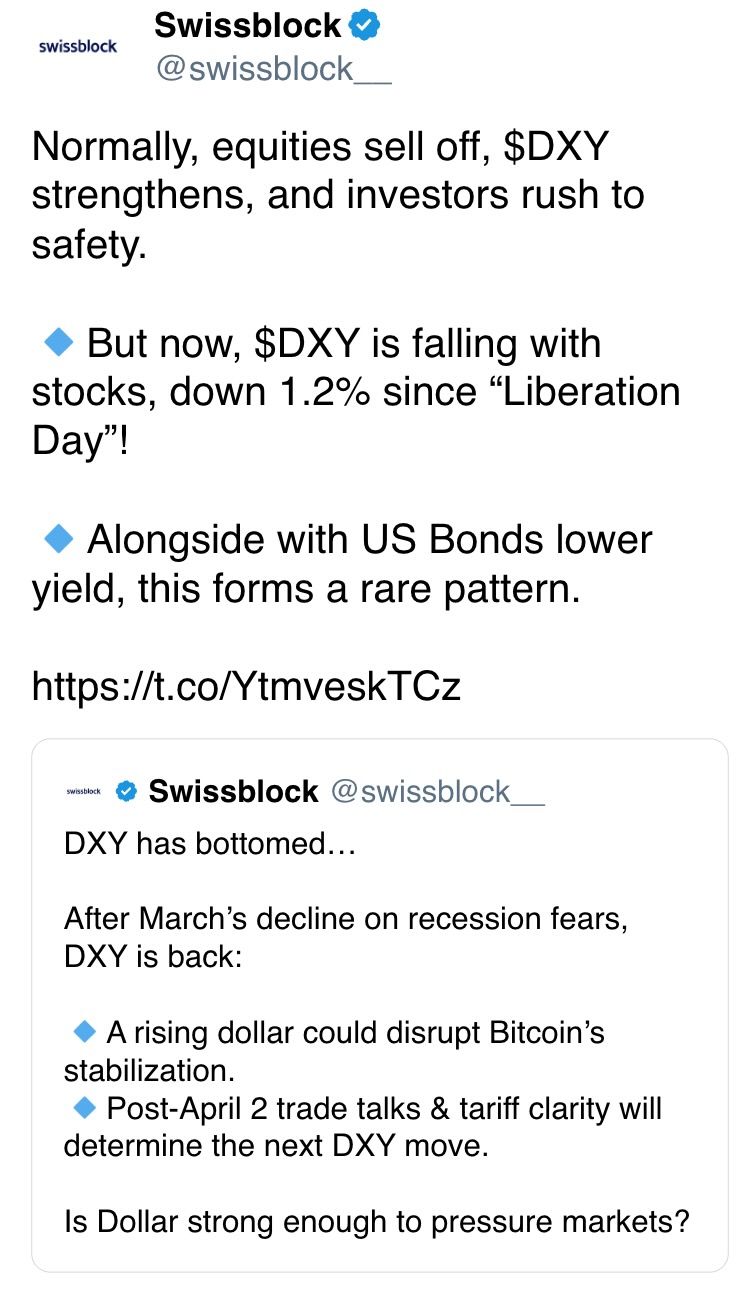
DXY is down 0.11% at 102.91
Gold is up 0.85% at $3,037.6/oz
Silver is up 2.85% at $29.95/oz
Nikkei 225 closed -7.83% at 31,136.58
Hang Seng closed -13.22% at 19,828.30
FTSE is down 4.7% at 7,676.63
Euro Stoxx 50 is down 6.32% at 4,570.18
DJIA closed on Friday -3.98% at 38,314.86
S&P 500 closed -5.97% at 5,074.08
Nasdaq closed -5.82% at 15,587.79
S&P/TSX Composite Index closed -4.69% at 23,193.50
S&P 40 Latin America closed -6.47% at 2,294.60
U.S. 10-year Treasury rate is down 3 bps at 4%
E-mini S&P 500 futures are down 3.98% at 4,906.75
E-mini Nasdaq-100 futures are down 4.3%% at 16,785.50
E-mini Dow Jones Industrial Average Index futures are down 3.82% at 37,057.00
Bitcoin Stats:
BTC Dominance: 63.60 (0.45%)
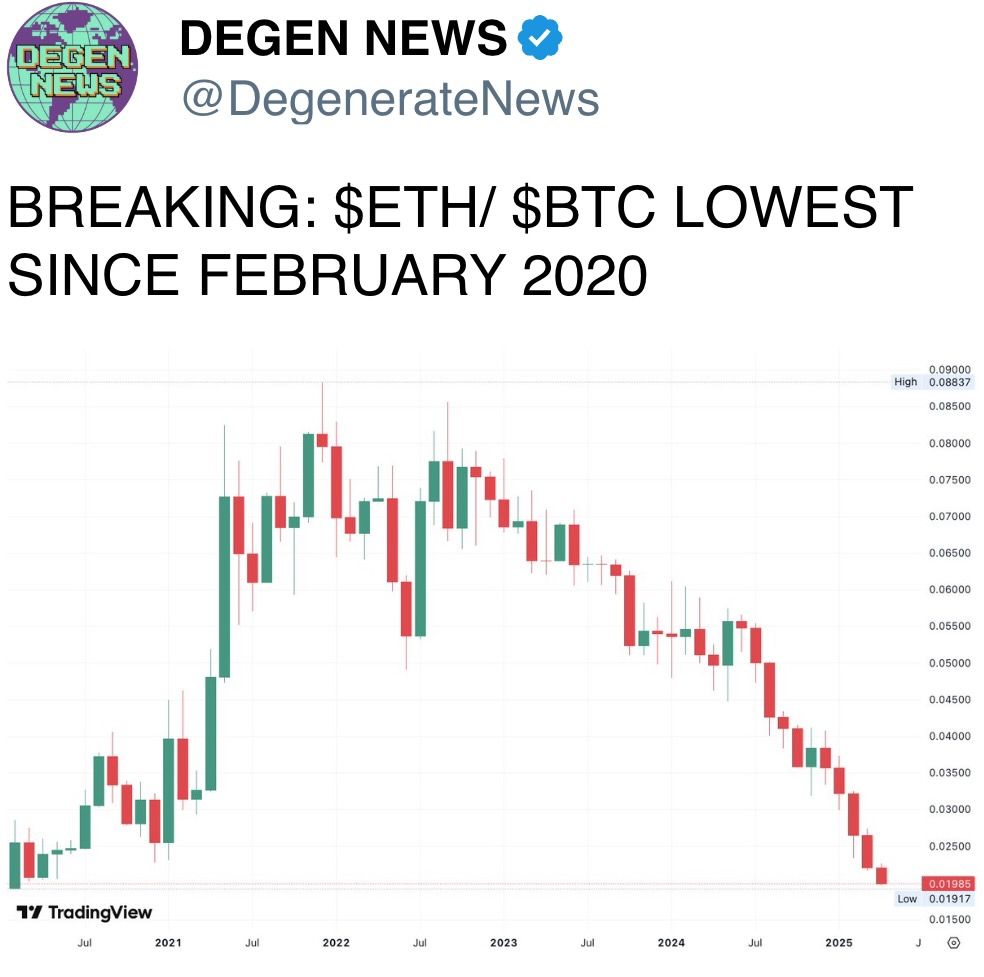
Ethereum to bitcoin ratio: 0.01957 (-2.93%)
Hashrate (seven-day moving average): 897 EH/s
Hashprice (spot): $42.40
Total Fees: 4.31BTC / $354,774
CME Futures Open Interest: 137,695 BTC
BTC priced in gold: 25.1 oz
BTC vs gold market cap: 7.12%
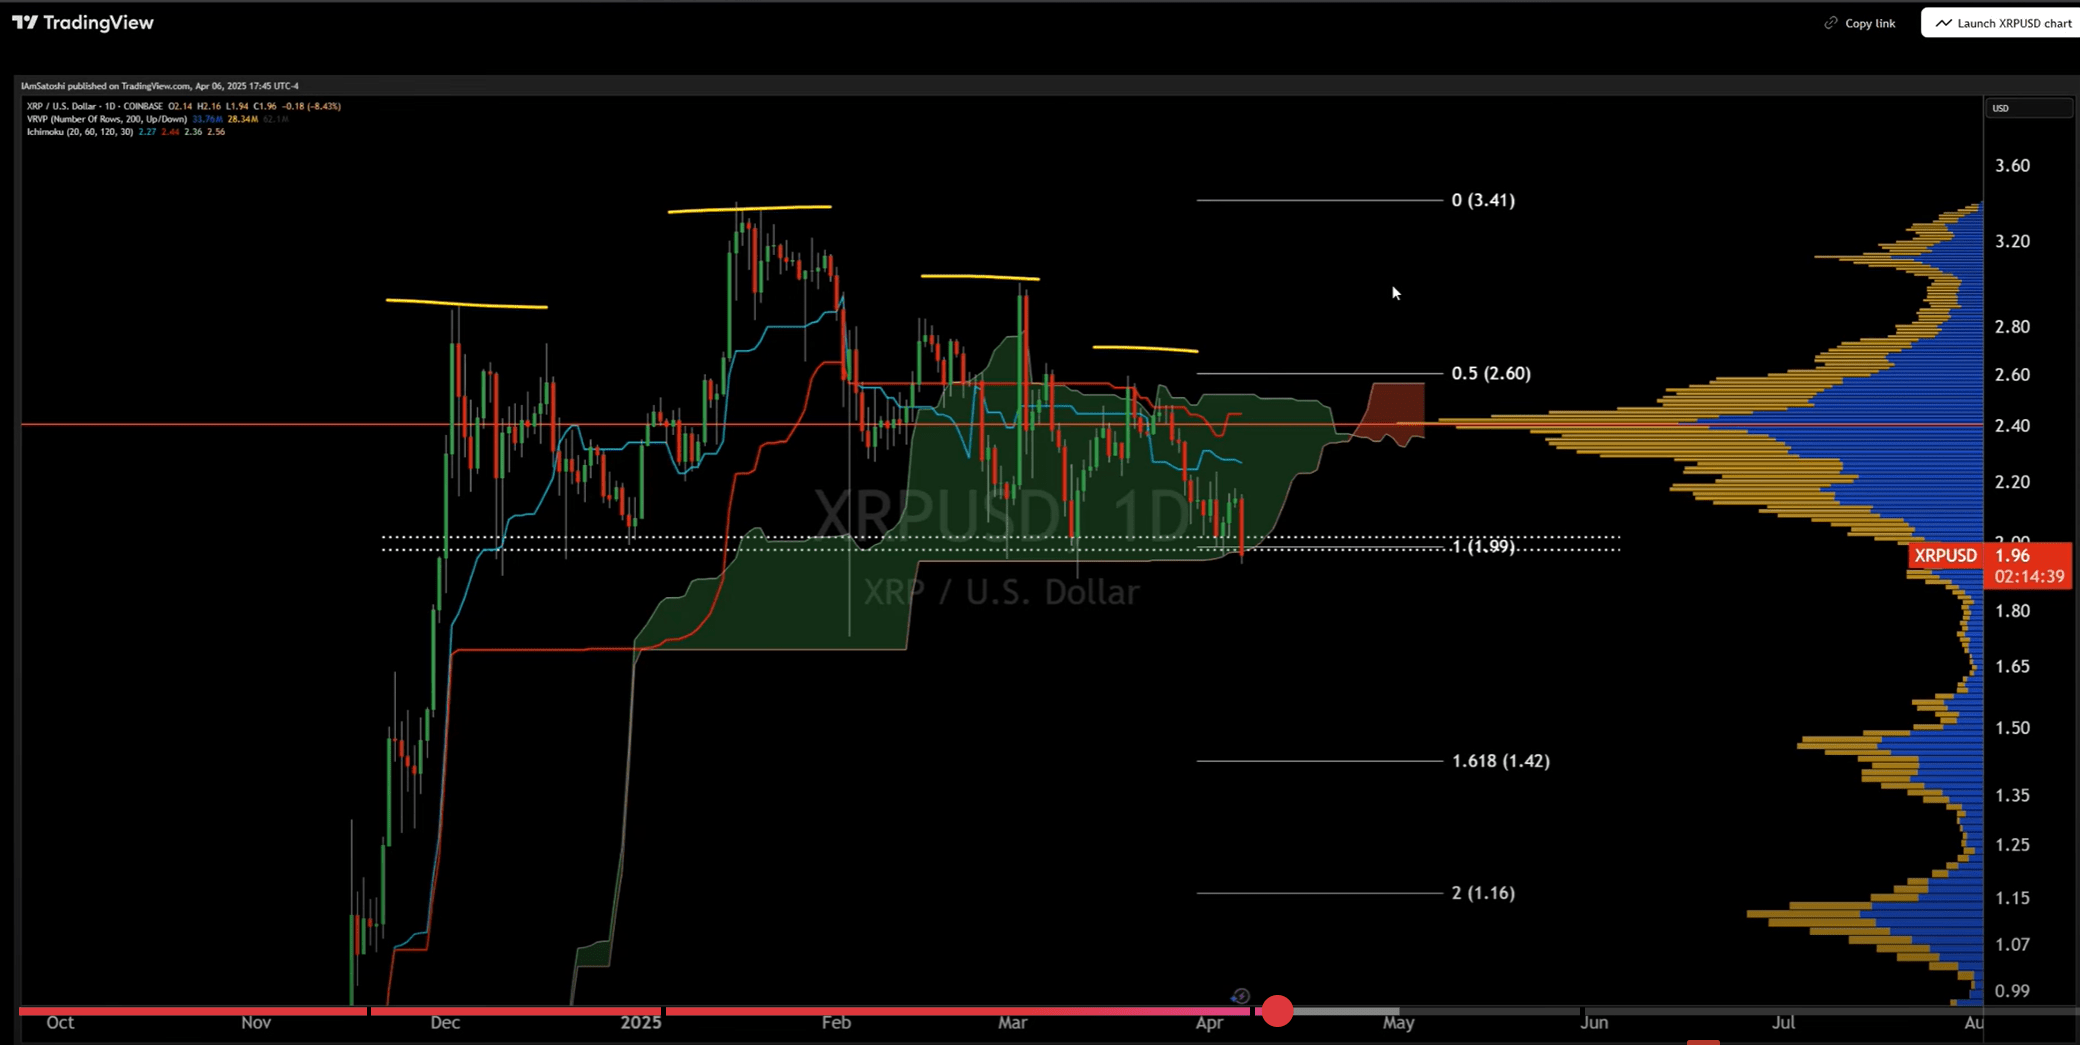
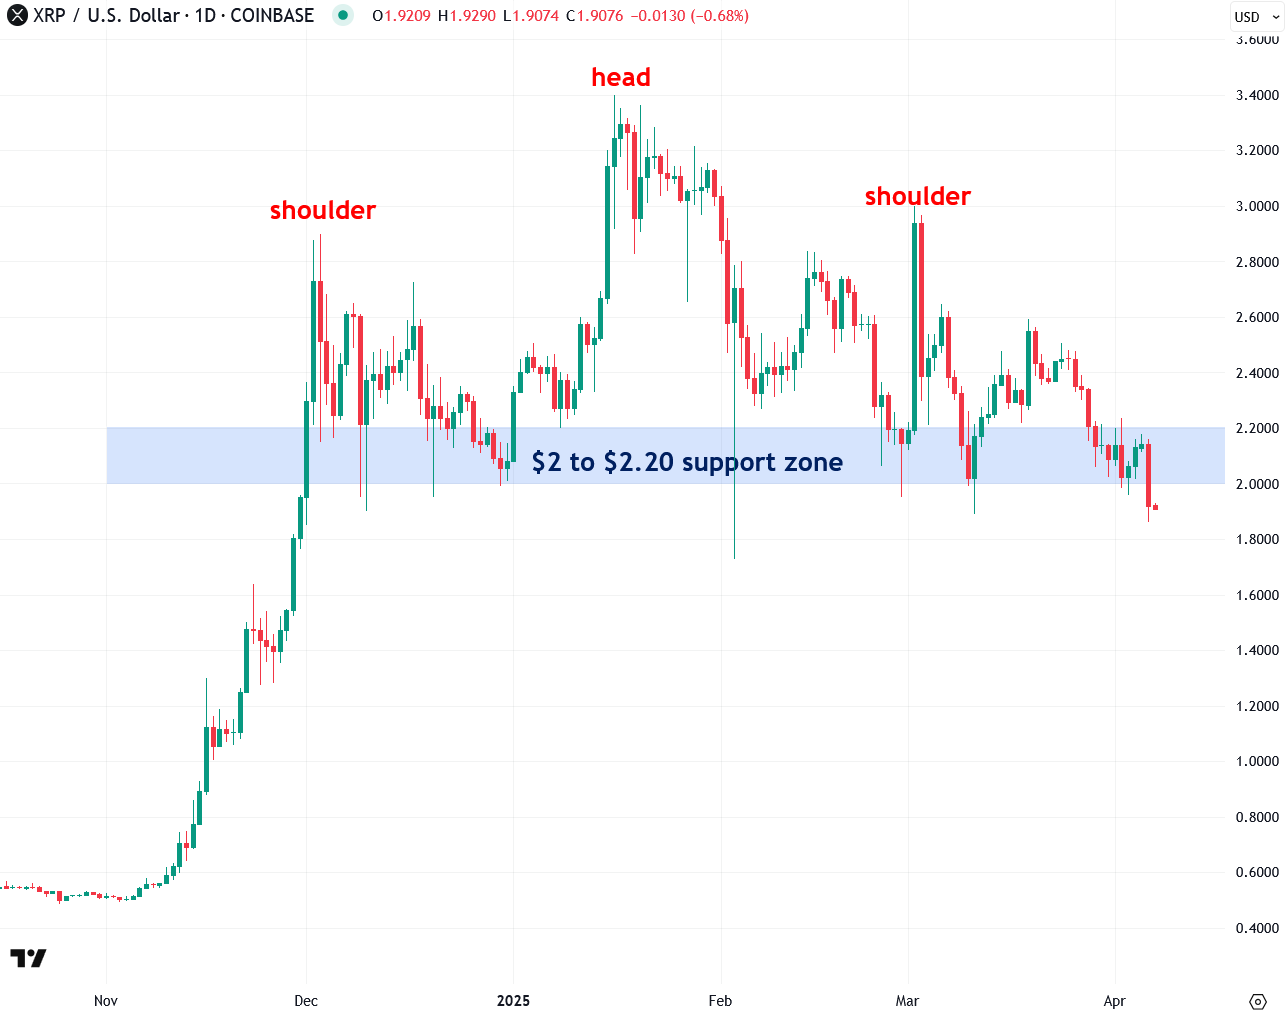
Technical Analysis
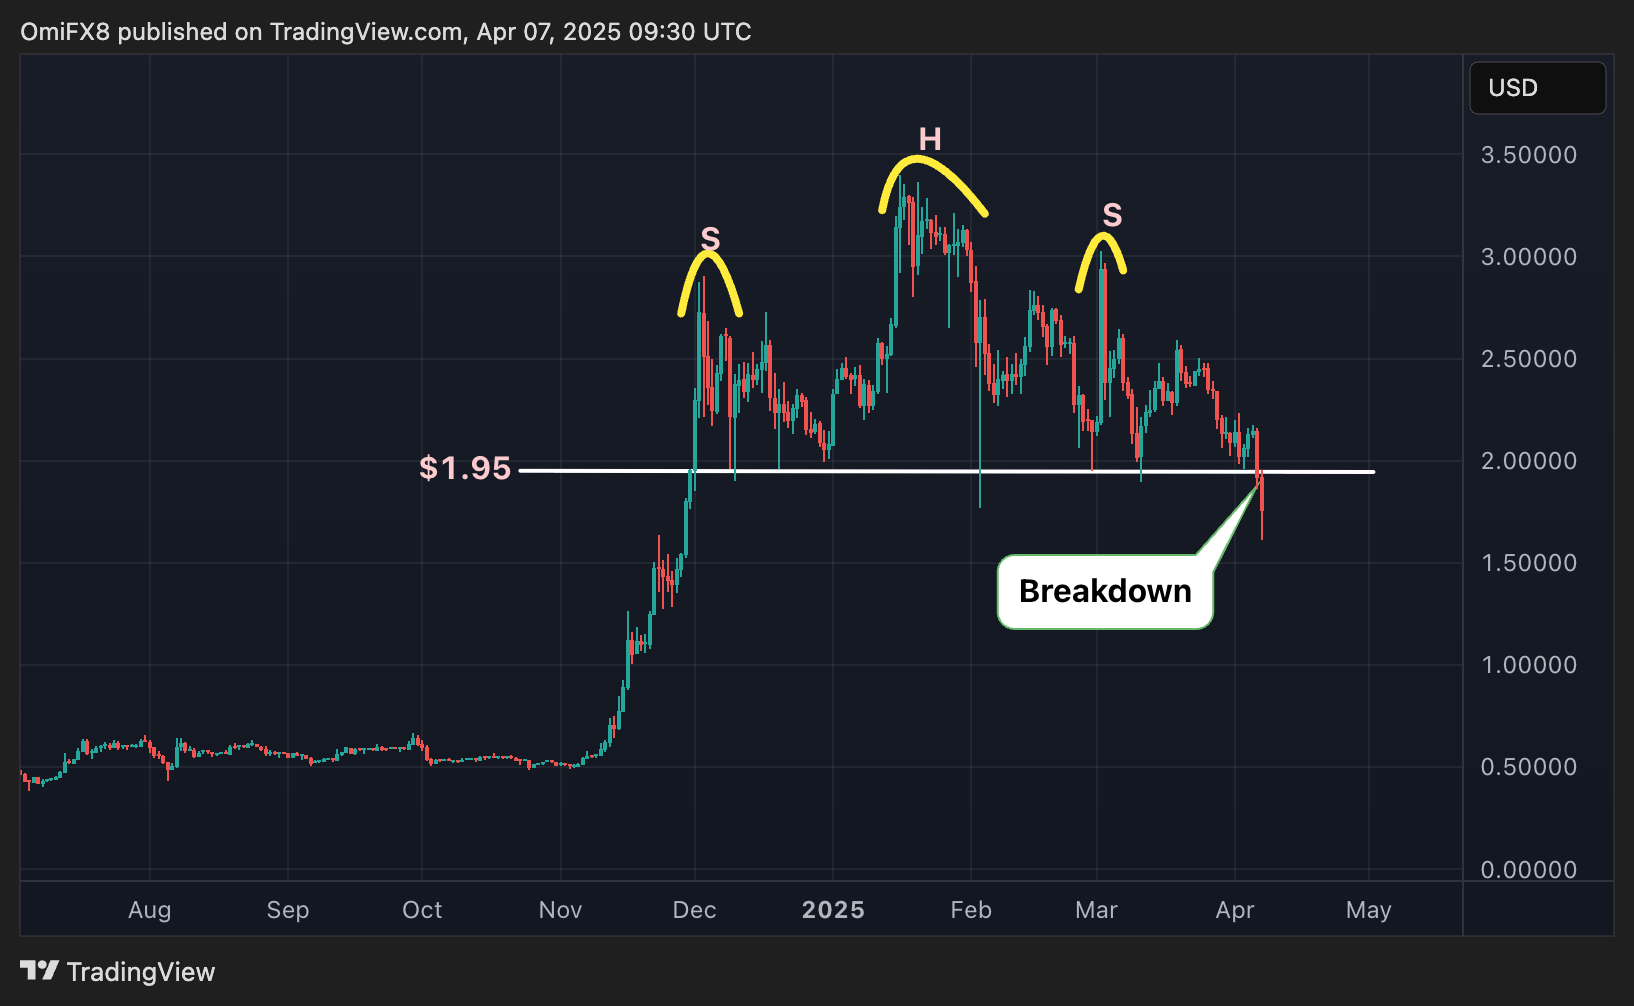
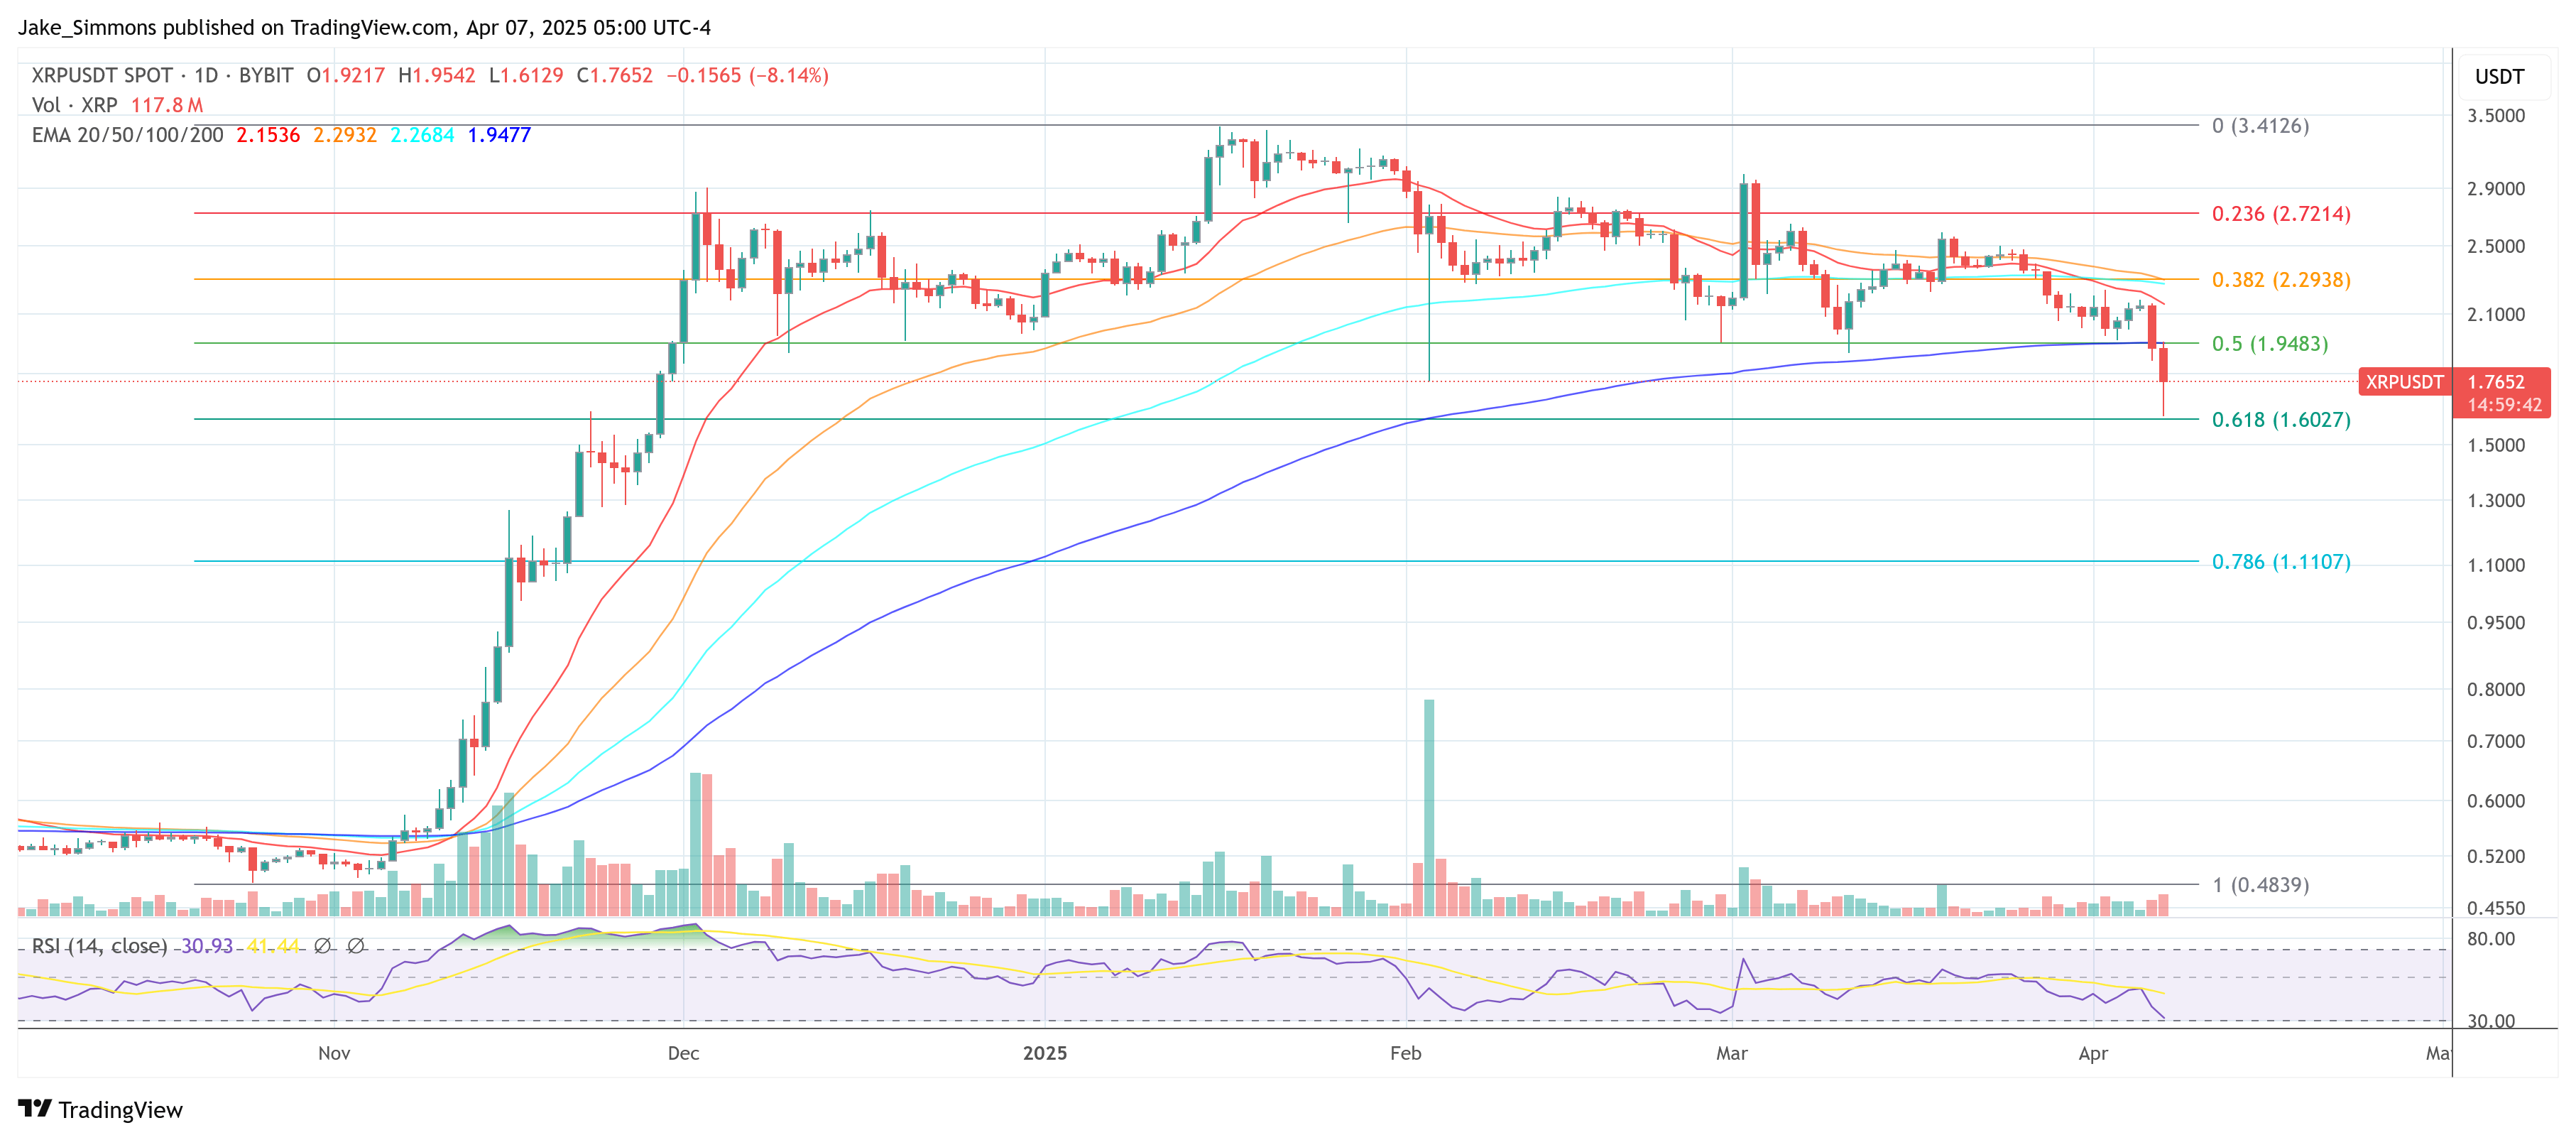
XRP has dived below the horizontal support line at $1.95, confirming a head-and-shoulders bearish reversal pattern.
The breakdown could bring a notable downtrend to $1.07.
Crypto Equities
Strategy (MSTR): closed on Friday at $293.61 (+4.01%), down 8.56% at $268.48 in pre-market
Coinbase Global (COIN): closed at $160.55 (-5.98%), down 7.91% at $147.85
Galaxy Digital Holdings (GLXY): closed at C$13.53 (-10.28%)
MARA Holdings (MARA): closed at $11.30 (+0.62%), down 9.65% at $10.21
Riot Platforms (RIOT): closed at $7.14 (-2.19%), down 6.02% at $6.71
Core Scientific (CORZ): closed at $7.18 (+0.42%), down 6.82% at $6.69
CleanSpark (CLSK): closed at $7.32 (-1.21%), down 8.61% at $6.69
CoinShares Valkyrie Bitcoin Miners ETF (WGMI): closed at $12.32 (-3.37%), down 7.95% at $11.34
Semler Scientific (SMLR): closed at $33.85 (-0.62%), down 12.85% at $29.50
Exodus Movement (EXOD): closed at $44.63 (+4.69%)
ETF Flows
Spot BTC ETFs:
Daily net flow: -$64.9 million
Cumulative net flows: $36.16 billion
Total BTC holdings ~ 1.12 million.
Spot ETH ETFs
Daily net flow: $2.1 million
Cumulative net flows: $2.37 billion
Total ETH holdings ~ 3.38 million.
Source: Farside Investors
Overnight Flows
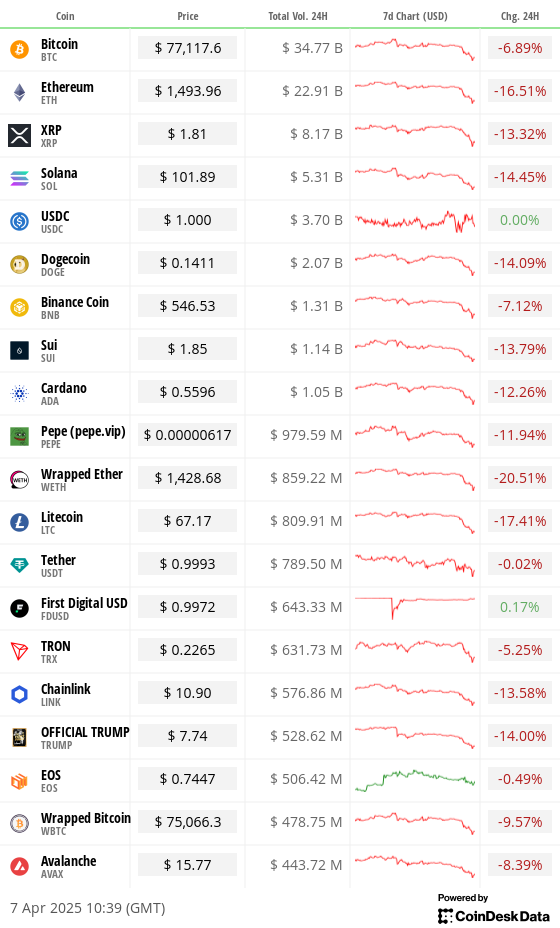
Chart of the Day
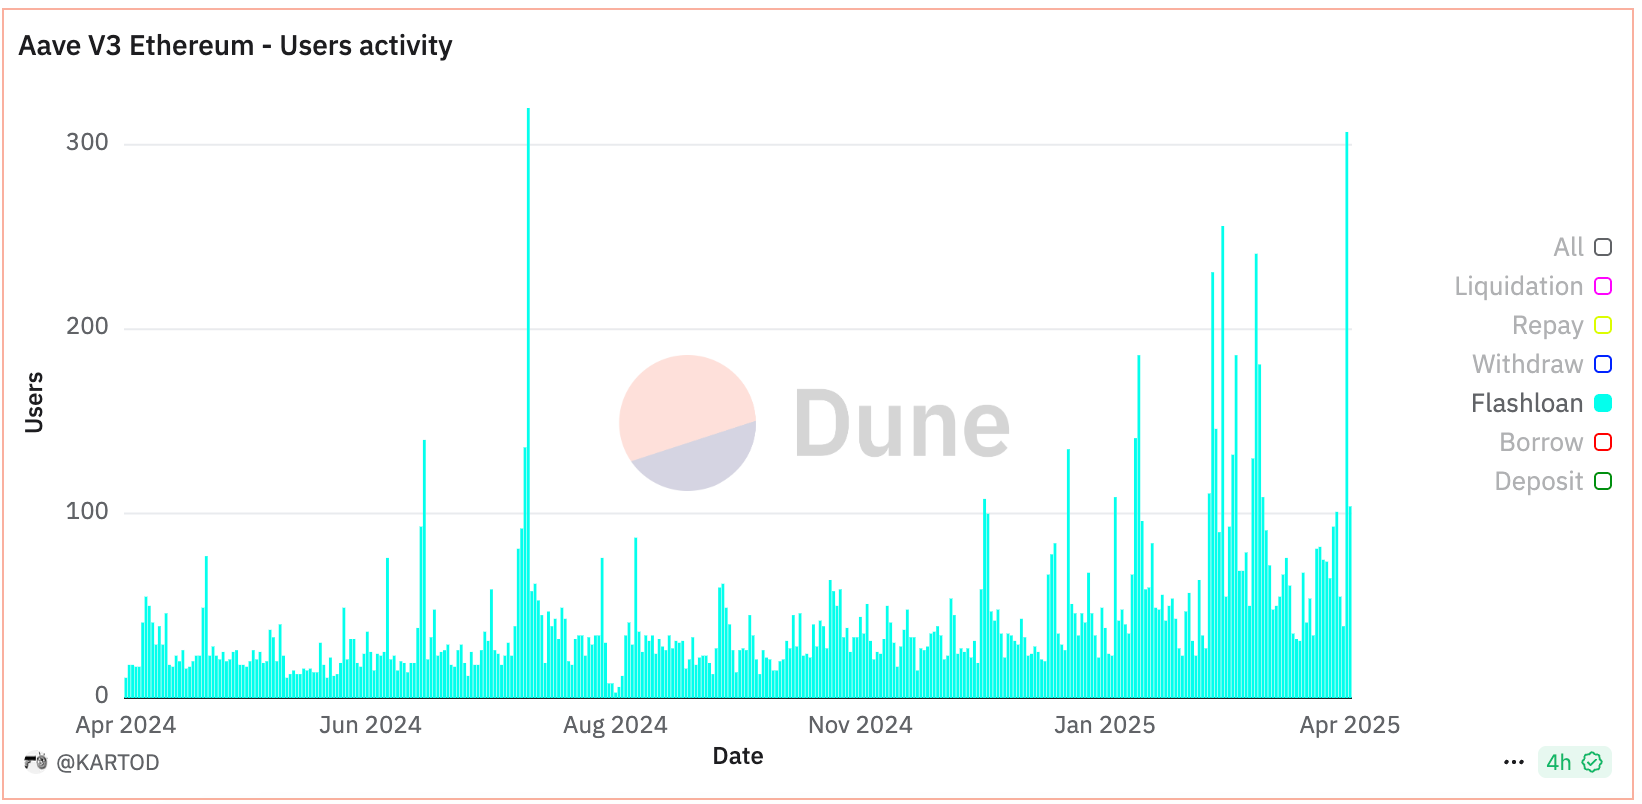
The number of users drawing flash loans from Aave, the leading decentralized finance protocol, rose to 307, the highest since early August 2024.
Flash loans leverage Ethereum’s atomicity, allowing users to borrow without posting collateral for a fee on condition the loan is repaid in in the same transaction in which you borrowed in the same transaction in which the user borrowed funds.
These types of loans are usually drawn for arbitrage trades that seek to profit from price discrepancies between two markets.
While You Were Sleeping
Goldman Boosts Recession Risk, Brings Forward Fed Rate-Cut Call (Bloomberg): Goldman Sachs chopped its U.S. fourth-quarter GDP forecast to 0.5% and raised the odds on a recession to 45%. It forecast 130 basis points of Fed rate cuts this year starting in June.
Bitcoin CME Futures Gap Lower After Trump Says ‘There Won’t Be a Deal With China’ (CoinDesk): CME’s bitcoin futures declined, indicating bearish sentiment, after Trump ruled out a China trade deal. Open interest also fell, suggesting potential withdrawal from digital assets.
Wall Street Starts to Speak Out Against Trump’s Tariffs (The Wall Street Journal): Bill Ackman urged a 90-day pause to avert a “self-induced economic nuclear winter,” while Stan Druckenmiller said he does not support tariffs exceeding 10%.
Hong Kong Regulator Releases Crypto Staking Rules for Licensed Exchanges (CoinDesk): Hong Kong’s Securities and Futures Commission gave a green light for virtual asset trading platforms (VATPs) and authorized virtual asset funds to offer staking services.
China Tries to Downplay the Trade War’s Effects on Its Economy (The New York Times): Beijing accused Washington of undermining global trade norms to serve unilateral goals, claiming U.S. tariffs threaten the collective interests of the international community.
Pete Hegseth to Visit Panama as U.S. Raises Pressure Over Canal (Financial Times): The U.S. Defense Secretary will take part in the Central America Security Conference, meeting Panama President José Raúl Mulino Tuesday as part of a push to strengthen regional security ties.
In the Ether