Analyst Says Buying This Meme Coin Is A 3X Leveraged Play If Solana ETFs Go Live

As the crypto market looks toward a recovery and the likes of Solana make their way out of losses, a crypto trader has called out one meme coin that could be a great play as the SOL price recovers. The BONK meme coin, currently the largest meme coin in the Solana ecosystem and billed for triggering the revival of the blockchain, continues to receive a lot of support as a meme coin that could outperform as the market ushers in the next altcoin season.

Solana’s BONK Meme Coin Is The Play

Crypto analyst and trader Unipcs became popular in crypto circles on the social media platform X (formerly Twitter) after turning $16,000 into more than $10 million with a long BONK trade. Despite making what many have referred to as a life-changing trade, the trader has refused to close this trade, with the expectation that the meme coin will continue to rise.

In a recent post, Unipcs has once again reiterated his support for the BONK meme coin and why he believes it’s a great play to be involved in. The post mainly points to bullish developments surrounding the Solana ecosystem and why BONK could be a way to maximize gains as the Solana price rallies.

The first bullish development the crypto analyst points to is the fact that a Solana ETF is expected to hit the market soon. When this happens, the Solana price is expected to recover in response, possibly rising toward new all-time highs, something that would translate into more bullishness for meme coins domiciled on the blockchain.

BONK Solana ETF

As for BONK, Unipcs explained that the meme coin acts as a 3X leveraged bet on the Solana price. This is because historically, the BONK price has often risen 3X higher than any gains that Solana puts in. Its highly volatile nature as a meme coin also contributes to this, as it is prone to rapid bursts of rising prices, the same way it is prone to quick crashes.

Furthermore, the expectations of a Solana ETF being approved by the Securities and Exchange Commission (SEC) are not the only thing propelling the bullishness of BONK. BONK, itself, also has a pending ETF filing with the commission, and the approval of a Solana ETF increases the likelihood of a BONK ETF approval, giving the meme coin even more fuel to rally.

Given these bullish factors, the crypto analyst believes that being in BONK could be a good play, especially as the price remains 75% below its all-time high. “Ff we do get Solana season soon, you do not want to be underexposed to BONK,” Unipcs said in closing.

BONK price chart from TradingView.com (Solana)

XRP Price Forms Rounded Bottom Within Descending Channel, Target Set Above $3

Despite breaking above $3 earlier this year, the XRP price has since gone on to disappoint investors with multiple crashes that have rocked the altcoin. This has seen the cryptocurrency lose almost 50% of its acquired value between late 2024 and early 2025. Nevertheless, this has failed to erode bullish sentiment, with predictions for higher prices dominating the community.

Time To Go Long On The XRP Price?

A crypto analyst on X (formerly Twitter) has renewed bullish hope after identifying an important formation on the XRP price chart. The analysis pointed out that the XRP Price is still moving within a descending channel, a formation that usually signals a bearish move.

However, the downtrend has pushed the altcoin’s price to the point where it is now testing the bottom trend line. This bottom trend line has been known to act as strong support previously and is expected to do so this time around.

With the support forming, it is likely that the XRP Price is gearing up for a bounce from this level. Furthermore, the crypto analyst points out that XRP is also forming a rounded bottom inside this descending channel. Such a rounded bottom could signal an end to the downtrend from here.

XRP Price

As the formation grows, the main level of support is now sitting at $1.6. So far, this level has held up quite nicely and bulls have been using it as a bounce-off point for recovery. Given this, the crypto analyst advises that entries for the XRP price are best at around $1.70 to $1.85.

This is not the only good news for the XRP price with support forming. If it holds and the altcoin does indeed bounce from this level toward $2, then the next important levels lie between $2 and $2.2. These serve as the levels for the bulls to beat to confirm a bullish continuation toward a possible all-time high.

If the bulls are successful, then three profit targets are placed by the crypto analyst. These include $2.3385, $2.8160, and $3.3062, pushing it toward January 2025 highs.

The Bearish Case

While the analysis is inherently bullish, there is still the possibility of invalidation that could send the XRP price tumbling further. As the analyst points out, the major support currently lies at $1.6. This means that bulls must hold this level. Otherwise, there is the risk of a much deeper correction as a liquidity sweep could send support further down to $1.3.

Nevertheless, with buy sentiments building once again, it is likely that XRP will follow the bullish scenario in this case.

XRP price chart from TradingView.com

Chart from TradingView.com

Bitcoin Price Crash: $1.83 Billion Makes Its Way To Exchanges, Is A Bloodbath Coming?

Bitcoin is currently hovering above a key support level, and any minor selloff triggered by a group of traders could potentially snowball into a wave of intense selling pressure. This fragile situation is underscored by data from the on-chain analytics firm Santiment, which revealed that over 30,000 BTC, valued at approximately $1.83 billion, has been transferred to crypto exchanges within a short period. Undoubtedly, such a huge amount of BTC entering crypto exchanges is problematic, especially in terms of a bullish outlook for the cryptocurrency.

30,000 BTC Sold In 72 Hours

According to Santiment data highlighted by crypto analyst Ali Martinez, Bitcoin addresses holding between 1,000 BTC and 10,000 BTC have sold or redistributed around 30,000 BTC in the past 72 hours. Considering the current average price of Bitcoin, this comes out to about $1.83 billion worth of BTC exchanging hands. 

Exchange inflow data from IntoTheBlock, which tracks the activities of various holder cohorts, reveals that on October 8 alone, around 18,220 BTC was moved to exchanges. This was followed by an additional 16,000 BTC on October 9 and roughly 13,800 BTC on October 10.

While not all inflows lead to immediate selloffs, high volumes of BTC entering exchanges often suggest that investors are positioning themselves for potential sales. This continued exchange inflow could signal a buildup of selling pressure, with market participants potentially preparing to liquidate their holdings in the near future.

Bitcoin Under Increased Selling Pressure?

On a positive note, the current selloffs are largely being driven by short-term holders, which has led to a shift in Bitcoin ownership. Many of the BTC being sold are being scooped up by long-term holders, who view the dip as an opportunity to strengthen their positions. This shift in ownership could stabilize the market, as long-term holders are typically less likely to sell going forward.

Related Reading: Second XRP ETF Filing Hits The Market, How Did The XRP Price Respond?

Moreover, exchange inflow data shows a gradual decline in the amount of BTC being sent to exchanges each day. This trend indicates that fewer investors are moving their Bitcoin into exchange wallets, which could be a sign that the recent wave of selloffs is losing momentum.

In terms of exchange reserve, data from CryptoQuant shows a steady decline in the amount of BTC held on wallets controlled by crypto exchanges since the beginning of October. This decline in exchange reserves contradicts the fears of continued selloffs, as it implies there is less Bitcoin available for sale on exchanges. If this trend continues, it could further reduce the selling pressure and provide a more optimistic outlook for Bitcoin’s near-term recovery.

At the time of writing, Bitcoin is trading at $60,854, establishing a price floor of around $60,000.

Bitcoin price chart from Tradingview.com

Ethereum TD Setup: Why The ETH Price Must Hold $2,250

Ethereum has largely exhibited a sideways movement between $2,500 and $2,350 in the past seven days. This sideways movement has yet to give rise to a clear path as to how the crypto performs moving forward, denting the sentiment of many bulls. 

In an interesting analysis with the use of the TD Setup, crypto analyst Ali Martinez highlighted a critical price point for investors to watch on the ETH price trajectory. At the heart of this analysis is the $2,250 price point, a level that could be the line between a bullish recovery and a steep correction.

ETH Price Must Hold $2,250

The TD setup is very popular among crypto analysts and investors. Historically, Ethereum has shown a clear reaction after breaking above or below the TD setup. Its reliability in pinpointing key reversal points has made it a go-to tool for analysts like Ali Martinez. 

Using an ETH/US Dollar price chart that he shared on social media platform X, Martinez noted that the TD Sequential has made or broken the cryptocurrency’s price action in the past while also highlighting notable examples. Each time the ETH price broke above the TD setup resistance trendline, a strong bull run has always followed. On the flip side, when ETH dipped below the setup’s support line, it corrected by an average of 53%. 

The first significant breakout above the TD setup resistance triggered an 8,885% surge, which saw the ETH price reach an all-time high of $1,138 at the time. Conversely, the first time the ETH price broke below the TD setup, it corrected by 56.67%. The latest break above the TD setup occurred in March of this year, which saw the ETH price surge by about 113% as it crossed above $4,000 for the first time in two years. 

Ethereum

Recent price dynamics puts the TD setup around $2,250. According to Ali Martinez, breaking below this price point could trigger a significant price drop. If a historical 53% average were to repeat itself, Ethereum could correct to as low as $1,100. 

Current Market Snapshot

As of the time of writing, Ethereum is trading at approximately $2,410, roughly 7% above the critical $2,250 threshold identified by the TD setup. While the ETH price has managed to stay above this level for now, its proximity to this key price level makes it a critical level to watch. 

The TD sequential indicator identifies potential points of exhaustion in an asset’s trend, whether bullish or bearish. Therefore, a break below $2,250 could mean the final reversal from a bullish Ethereum to a bearish sentiment. 

Market sentiment towards Ethereum remains mixed at the moment. Sellers currently have the upper hand, but a break above $2,500 could set the path for a bullish momentum.

Ethereum price chart from Tradingview.com

Why Is The Shiba Inu Price Crashing Today?

With the Bitcoin price crash over the weekend, the prices of other cryptocurrencies such as Shiba Inu have followed sharply. The result of this has been a double-digit price crash for Shiba Inu, alongside other altcoins. Naturally, the rapid decline has raised questions, with industry stakeholders wondering what is driving this massive crash.

Shiba Inu Price Crash Is Following Bitcoin

The Shiba Inu price crash being experienced today is not a result of a single event occurring for the meme coin. Rather, it is linked to a further market-wide crash that began with the Bitcoin price first falling below $60,000 and eventually breaking $50,000 on Monday. Therefore, to get the real reason behind the Shiba Inu price crash, we must look at the reason driving the Bitcoin crash.

So far, Bitcoin, and the broader crypto market, has been responding to major events happening around the world. These are outline by pro trader Adam Khoo in an X (formerly Twitter) post, revealing a much deeper reason for the decline.

One of these major events is the decline in the Japanese stock market, which is seeing its largest single-day decline since 1987. As Khoo outlined, traders on the Japanese stock exchange had borrowed the Japanese Yen at low interest rates to convert to United States Dollar, which is, in turn, used to buy US stocks for a larger gain.

This strategy has worked for the trader as Yen’s interest rates remained low. However, the Japanese government raised interest rates, meaning that these traders were now dealing with massive losses as the Yen strengthened against the US dollar.

The result of this is a large sell-off as traders scramble to pay back their loans while taking huge losses in the process. Naturally, this led to a decline in US stocks and the likes of Bitcoin and Shiba Inu have been reacting to this market decline.

Not only this, other major events such as war escalation in the Middle East, as well as the US presidential elections having no clear winner yet, has driven prices down further. With fear and panic spreading, more investors are selling, causing an already deep decline to depend further.

However, while investors in assets such as Shiba Inu panic, the crypto trader does not believe that it is all bad. According to him, this is a great time to “take advantage of temporary mis-pricing caused by short term crisis.”

Presently, the Shiba Inu price is sitting at $0.00001111 – its lowest level in six months. Going by the trader’s sentiment, this could be a good time to get into coins such as Shiba Inu, as a rebound from here could lead to new all-time highs.

Shiba Inu price chart from Tradingview.com

Bitcoin Whales Spend $6.3 Billion In One Day As Historic BTC Buy Signal Appears

Bitcoin whales are not backing down from the market and have continued to capitalize on the pump by buying every dip. The most recent dip toward $60,000 saw these large investors gobble up BTC at an alarming rate, with their daily spending coming in at billions of dollars.

Bitcoin Whales Buy $6.3 Billion Worth Of BTC

In a stunning discovery, co-founder of Bitcoin-based company Apollo, Thomas Fahrer, revealed that Bitcoin whales have been rapidly buying up the tokens amid price drawdown. More specifically, the daily spend of these whales caught Fahrer’s eye.

The report shared by the founder shows that while smaller investors had been selling, Bitcoin whales were buying up billions of dollars worth of coins. In the 24-hour period, these whales holding more than 1,000 BTC on their balances accumulated 8,953 BTC, worth $6.3 billion at the time. This further adds to their weekly accumulation numbers, coming out at 12,058 BTC, which is almost $9 billion worth of BTC bought in one week.

This accumulation trend comes in light of smaller investors selling their tokens. For example, Fahrer’s screenshot show Sharks, which are investors holding between 100-1,000 BTC on their balances sold 6,746 BTC in one day, worth around $5 billion.

Other notable sellers include the crabs, which are investors holding 1-10 BTC, selling 1,074 BTC in the same time period. Shrimps – investors holding 0-1 BTC, were also caught selling, with a total of 591 BTC sold. While Fish investors, those holding 10-100 BTC, sold only 95 BTC in the one day period.

The flow of these investors shows that BTC is flowing out from smaller investors toward larger investors, something that is bullish for the price. The same is the case on the weekly timeframe where Shrimps sold 2,079 BTC, Crabs sold 5,748 BTC, Fish sold 1,155 BTC, while Sharks bought up 60 BTC, with Bitcoin whales buying the majority with 12,085 BTC.

Time To Buy

A number of crypto analysts have called for buying and it seems Bitcoin whales are the ones following this advice. One of the analysts who has been vocal about it being the time to buy is Ali Martinez, who shared an interesting formation on the Bitcoin chart.

Martinez pointed out that the TD Sequential, which had previously predicted the Bitcoin price movement, had flashed a buy signal. The level at which this analyst presented this buy signal was around the $69,500 level, and since then, the BTC price has since rebounded above $70,000, suggesting the buy signal was correct.

If the TD Sequential holds like it did the last time it appeared, then the current price push could see Bitcoin reach a new all-time high above $74,000, since the last one saw an almost 15% move. But for now, Bitcoin bulls are fighting to maintain its position above $70,000, with a 12.22% increase in the last week.

BTC price chart from Tradingview.com (Bitcoin whales)

Market Expert Who Predicted Bitcoin’s Rise above $69,000 Unveils New Target

The Bitcoin rise above $69,000 before the fourth halving to reach a new all-time high of $73,000 in 2024 took many by surprise. However, crypto analyst BitQuant was not one of those people. In 2023, the analyst had correctly predicted that the BTC price would reach a new all-time high before the halving was completed. After the successful completion of his prediction, the crypto analyst has once again predicted where the Bitcoin price is headed, and how high it will go.

Crypto Analyst Says Bitcoin Price Will Reach $95,000

BitQuant has unveiled his latest prediction for the Bitcoin price, and the target being displayed will please many who continue to be bullish. Amid the choppy headwinds that have dominated the market, the analyst believes that the Bitcoin price will surge and reach $95,000.

Interestingly, the analyst does not expect the campaign to $95,000 to be a long, drawn-out move. Rather, BitQuant explains that the Bitcoin price can complete this target in a single move. Such a move would mean a 50% increase in price from its current level of around $62,000 and will no doubt trigger a ripple effect that will be evident in the market.

The post read:

$95K will be achieved in just one move, and that is quite obvious. Will that move start today, tomorrow, or the day after tomorrow? I don’t think anyone knows. If you can’t relax now and wait for #Bitcoin to perform as expected, then it’s better to leave the market to avoid the torture. Because in the coming months, there will be a lot of pain for those with weak nerves.

BitQuant’s prediction was in response to another crypto analyst, Mikybull, who identified the formation of a ‘cup and handle’ pattern on the Bitcoin crash. The analyst believes that this formation will precede a massive breakout that will send it to a “cycle top.”

Bitcoin price chart from Tradingview.com

Is $250,000 Still In Play?

Back in 2023, when BitQuant made the initial prediction that Bitcoin would reach a new all-time high before the halving, he had set out a price target for the cryptocurrency. As the crypto analyst explained at the time, reaching a new all-time high before the halving, although it has never happened before, does not mean that it will peak by then.

Rather, the analyst expects the bull rally to continue well after the halving, which is when the price will peak. BitQuant’s target at the time was the price peaking at $250,000 at the top of the cycle. However, this target has not made an appearance in his analyses in recent times.

The most recent predictions circle around the $95,000 target and the analyst expects it to hit this price in May. In a prediction from April, BitQuant expects that the price will first go to $49,000, before recovering to $75,000, and then surge to $95,000.

Bitcoin Fear & Greed Index Reaches Highest Level Since 2021, What To Expect Next

The Bitcoin Fear & Greed Index has risen to its highest level in almost three years, hitting Extreme Greed at rocket speed. Using past performance and indicators, it is possible to deduce where the BTC price is headed next after reaching this new milestone.

Bitcoin Fear & Greed Index At New 2-Year High

The Bitcoin Fear & Greed Index is a measure of investor sentiment and how they are looking at the market. This can help to figure out if investors are currently putting money into the market or if they are taking money out of it.

There are five major categories across the Fear & Greed Index, including Extreme Fear, Fear, Neutral, Greed, and Extreme Greed. The index is ranked on a scale of 0-100, with a range of numbers representing a category of investor sentiment.

Extreme Fear is the lowest on this scale, which ranges from 0 to 25. Then, from 26 to 46, we have the Fear. Both of these categories indicate an unwillingness of investors to enter the market and have often presented as the best time to invest in crypto.

Next on the scale is 47 to 52, which represents the Neutral territory. Then 53 to 75 is Greed when investors are beginning to feel confident in the market. Finally, 76 to 100 is Extreme Greed, which represents peak bullishness. As the Bitcoin Fear & Greed Index currently sits at 79, which is Extreme Greed, it could carry some implications for the market.

BTC price chart from Tradingview.com (Bitcoin Fear & Greed Index)

Extreme Greed Marks The Top?

Just as the Bitcoin Fear & Greed Index can be helpful in determining what is a good time to buy, it can also provide pointers for when a market top might be in. Looking through the historical performance of the crypto market compared to the Fear & Greed Index, we see a persistent correlation between peak euphoria and the market top.

The most recent example of this is November 2021, when the index’s score climbed to as high as 84, just 5 points shy of the current 79 score. At this point, the price of Bitcoin had risen to $69,000 before meeting resistance, which it will eventually succumb to,

In the following days, sentiment would begin turning, as did the price of Bitcoin. A similar pattern was also seen in February and March 2021 when the index hit a high of 94. The next few days saw interest taper off, marking the peak at that particular point.

If the same pattern were to be repeated in this scenario, then Bitcoin could have another few days of runway before it blows off top. Presently, the cryptocurrency is already seeing significant resistance at $57,000, which could suggest that the top is near.

OG Ethereum ERC-404 Token PANDORA Is Rallying Again, What’s Behind It?

PANDORA, the first token to use the Ethereum ERC-404 token standard, is on the move after slowing down for a few weeks. The token’s price saw a significant surge over the weekend, rising around 50% to clear $24,000 once more. This recovery was triggered by a number of factors, so here they are.

Whales Set Their Sights On PANDORA

The most obvious reason behind the price push recorded for PANDORA over the weekend can be traced back to significant whale activity. On-chain data tracking website Lookonchain, flagged a number of whale transactions that took place in the days leading up to the price surge.

The first whale accumulation was seen on February 20, when Lookonchain reported that a single whale had spent $4.89 million to purchase 244.24 PANDORA tokens. The buying spree took place over a number of days, and by the time the whale was done, they had an average entry price of $20,044.

A couple of days later on February 23, the on-chain tracking platform reported that another whale was making their PANDORA play. This time around, the new whale spent $1.37 million buying 71.45 PANDORA tokens at an average price of $19,268.

Together, these whales scooped up a little over $6 million worth of tokens. When the price eventually hit $24,000, the first whale saw profit margins of almost $1 million, while the second whale was sitting on a profit of over $330,000.

PANDORA price chart from Tradingview.com (Ethereum ERC-404 token)

First Set Of Incentives Land For Holders

Another factor that has helped push the price of PANDORA over the week is incentives in the form of airdrops being announced for PANDORA holders. Monarch, a project also built on the Ethereum ERC-404 token standard, announced earlier in February that it would be awarding tokens to PANDORA investors.

A total of 5% of the token supply was announced to be allocated as an airdrop for PANDORA holders. This incentive, coupled with the fact that PANDORA announced that it is gearing up to release the latest iteration of the ERC-404 token standard, created demand for the token.

PANDORA Token Performance

During the weekend, the PANDORA price went from trending around $16,000 to rising 50% in one day to clear the $24,000 level. However, this high price level could not be sustained for long as a sharp dump would follow on February 23, apparently triggered by whales dumping their holdings.

In the last day, the price of the token has continued to fluctuate between $16,000 and $17,000. As of the time of writing, the altcoin is trading at $17,139, with 5% losses in the last day, according to data from Dexscreener.

The Polygon Vesting Contract Is Officially Empty, Will This Send MATIC Price To $3?

Like many other crypto projects, the native token of the Polygon network, MATIC, was launched with some portion of the supply vested for the team over a period of time. In the case of Polygon, the vesting was for five years, and since 2019, there have been periodic token unlocks. However, the unlocks, which have often been a deterrent for investors, are now over, as the last batch was just released to the team.

Polygon Last Unlock Goes To Team

On Wednesday, February 21, the Polygon Foundation received the very last portion of their vested tokens from the vesting contract. In total, 273,304,816 million MATIC tokens valued at $260 million were released to the Foundation’s wallet.

This unlock marks the very last unlock that the Foundation will receive, meaning that almost all of the available supply of MATIC is now in circulation. The latest unclog brings the circulating supply of the cryptocurrency to 9,618,318,574 out of its 10,000,000,000 maximum supply. As a result of this, the market cap of Polygon is sitting just above $9.14 billion with a fully diluted valuation (FDV) of approximately $5 billion.

The entirety of the MATIC supply has been unlocked, which means that there will be no more tokens being brought into circulation. This is a huge milestone for the project, whose investors have waited years for the vested tokens to finally run out.

MATIC price chart from Tradingview.com (Polygon)

How Will This Affect The MATIC Price?

The fact that the entirety of the MATIC supply is now in circulation is bullish for the digital asset, especially in the long term. Inflation is a factor that tends to drive investors away and keep them from holding their coins due to the fear of more tokens coming into circulation, causing supply to exceed demand.

Now that the entirety of the supply is now in circulation, it gives the MATIC price a chance to enter into price discovery. However, there is still some concern about when the Polygon Foundation might start selling their coins as the entirety of the unlocked tokens still sit in the Foundation’s wallet.

If they do decide to sell, though, it is likely that the foundation would do so through OTC (over-the-counter) deals to minimize the impact of such a sale on the token price. As a result, the MATIC price might not suffer much.

At the time of writing, the MATIC token is trading at $0.95 with a 24-hour increase of 1.11%. Although its performance has been far from encouraging, the token is sitting only 67% below its 2021 all-time high of $2.92.

Bitcoin Fisher Transform Reaches Critical Level Not Seen Since 2021, What This Means

The Bitcoin price has had a rocky start to the new week after losing its footing above $52,000 on Tuesday. However, all hope is not lost, as indicators still point to a continuation of this trend. Crypto analyst Tony The Bull has identified an important trend in the Bitcoin chart which could trigger a continuation of the trend back above $52,000.

Bitcoin 1-Week Fisher Transform At Crucial Point

In an analysis posted on X (formerly Twitter), the crypto analyst shared a chart that showed the Bitcoin Fisher Transform in comparison to price. Most importantly, the chart showed the 1-week Fisher Transform and how it has moved since 2017.

The analysis shows some similarities between the current trend and the trends seen in 2017. A similar trend was also seen in 2019 and 2021, where the Fisher Transform rose rapidly before falling. But the importance of this trend lies in where the Fisher Transform heads next from here.

The current important level is the 1.5 Standard Deviation, which has been a crucial point whenever this trend has occurred. Now, if the Fisher Transform is able to stay above this level, it is bullish for the price. However if it falls below this standard deviation, it is very bearish for the price.

Bitcoin

“This is a pivotal area based on historical price action and its exhibiting 2017-like behavior not seen in 2019 or 2021,” the crypto analyst explains. “Below it tends to incite bearish trends, while holding above gives bulls extra vigor.”

Bitcoin price chart from Tradingview.com

Bears And Bulls Vie For Control Over BTC Price

The interest in the next direction of the Bitcoin price has seen bulls and bears lock horns over which camp will reclaim control of BTC. This has seen the price of the digital asset fluctuate wildly over the last few days, going from $53,000 to below $51,000, before bouncing back up once again in the early hours of Wednesday.

This tug-of-war continues to hold the price of Bitcoin down, but investor sentiment seems to be climbing even through this. According to the Bitcoin Fear & Greed Index, investor sentiment has reached Extreme Greed for the first time in one year.

Historically, the index going into extreme greed has signaled the top of the market, with prices trending downward not too long after. However, Bitcoin is still seeing positive indicators, with its trading volume rising more than 40% in the last 24 hours alone.

Finance Expert Drops Grim Prediction For US Economy, Says Bitcoin Is The ‘Parachute’

The United States economy and where it might be headed has been a hot topic of debate among finance experts, with some recommending Bitcoin as a safe haven. One of those who has continued to tout BTC as the answer is renowned finance author Robert Kiyosaki, who has made a gloomy prediction for the US economy.

The Economy Is Coming Down

In a post made on X (formerly Twitter), Robert Kiyosaki, who is widely known for his best-selling finance book titled ‘Rich Dad Poor Dad’, warned investors of an impending crash. According to Kiyosaki, a lot of investors would end up losing their money as they do not know what to do with it.

He compared the current situation to flight students in the US Navy being taught how to fly and also how to crash. However, it seems that there is no easy option for investors going forward, as he calls for a “bail out.”

The finance expert warns that banks as well as the US economy will crash, and “We are not going in for a soft landing.” In light of this, he steers investors toward other forms of wealth preservation, which are Gold, Silver, and Bitcoin.

As much as the finance author expects that the crash will be brutal, he believes that by being in the three assets mentioned above, then investors can have “parachutes for your personal soft landing.”

Bitcoin price chart from Tradingview.com

Strong Advocate For Bitcoin

Kiyosaki is not new to pushing Bitcoin as an alternative to traditional cash and investment vehicles. Over the last year, the finance expert has warned that the US economy is headed for doom and as always, pushes the likes of Gold, Silver, and Bitcoin as an answer to the ‘inevitable crash.’

The author has also provided incredibly bullish predictions for the BTC price going forward, which he expects to rise more than 300% from here. According to Kiyosaki, Bitcoin will rise as high as $150,000 post-Spot Bitcoin ETFs approval, and with the price inching toward $50,000 already, it seems Kiyosaki’s prediction may end up playing out.

Kiyosaki has also presented Bitcoin as a safe haven at a time when there is widespread political discontent. He has also publicly declared his dislike for the current President, Joe Biden, who he believes is weak and a terrible president.

In order to fight back, the finance author suggests that investors move their assets into Gold, Silver, and Bitcoin which cannot easily be controlled by the government. He also believes BTC is the “best protection” against hyperinflation, which he expects to happen soon.

Dogecoin Adoption Explodes In Stunning Move, Can DOGE Chart A Path To $0.2?

The Dogecoin adoption trend has taken the crypto market by surprise after the number of new wallets being created on the network skyrocketed. Last week, new wallet creations were the center of attention as more than 890,000 new DOGE wallets were added in a single week. This time around, a new Dogecoin metric is taking the stage.

New Non-Zero Dogecoin Addresses Rise Rapidly

In a new report, the on-chain data tracking platform Santiment has identified rapid growth in one Dogecoin metric and that is the number of new non-zero addresses. These addresses include those that were created in the last week and are holding more than 0.001 DOGE on their balances.

The report shows that this category of addresses jumped more than 400,000 in the space of two weeks. More specifically, 413,800 new wallets have been added in the last week, with DOGE balances ranging from between 0.001 and 1 DOGE. This earns them the classification of non-zero balances.

Interestingly, this rapid rise in adoption happened at a time when the DOGE price was struggling to hold up in the market. As Santiment notes in its post, the DOGE price is down more than 23%, while network adoption has been on a bullish run.

However, this rise in adoption does not have a positive effect on the DOGE price, suggesting that there isn’t demand among the investors. More than likely, these new non-zero wallets are created by existing users who are looking to take advantage of and trade the newly introduced DRC-20 token standard on the network.

Dogecoin price chart from Tradingview.com

DOGE Comes Under More Selling Pressure

The Dogecoin price could be looking at more struggles ahead as more sell-offs could be looming on the horizon. Whale Alert, a platform that tracks the origin and destination of large crypto transactions, has flagged a large DOGE transaction that has sparked speculation in the community.

According to the report, the whale sent a total of 100 million DOGE coins worth over $7.8 million to the Robinhood exchange. The destination of the transaction is important because usually when investors send coins to centralized exchanges such as Robinhood, the purposes are more than likely to sell. In this case, a $7.8 million sell-off could put further pressure on an already struggling DOGE price.

For the DOGE price to climb as high as $0.2, there would need to be a catalyst, such as Elon Musk announcing Dogecoin payments for X (formerly Twitter). If the entire crypto market continues to perform poorly though, then the DOGE price could fall as low as $0.07 before bouncing back.

Here’s Why A Bitcoin Bull Run In 2024 Is Inevitable

The expectations of a Bitcoin bull run in the year 2024 continue to drive investment decisions across the space. A number of reasons have been given for the expected bull run, including the approval of Spot Bitcoin ETFs for trading as well as the upcoming BTC halving event. One analyst has echoed the latter, elaborating on why the halving will bring about a bull market.

The Bitcoin Halving Event Will Send Market Higher

Crypto analyst James van Straten took to X (formerly Twitter) to explain why the Bitcoin halving event is bullish for price. Now, the halving is an event that is programmed to take place approximately every four years, cutting the block rewards in half each time it happens.

This means that the number of BTC that miners are awarded for mining a block is immediately slashed by 50%, thereby drastically reducing the number of new coins coming into circulation. Currently, the block reward is at 6.25 BTC and the next halving will slash it to 3.125.

Straten points to this reduction, using the monthly issuance as the case study. He explains that over the past month, there have been a total of 61,000 BTC accumulated by miners and exchanges. However, after the halving, the monthly issuance is expected to drop to 13,500 BTC and it is this drop that is most significant.

As Straten points out, if the demand were to stay elevated at the same levels when the halving takes place, it would see demand exceed supply by a factor of four. This will cause a shift in the market, which will have to “find an equilibrium most likely higher.” In other words, prices would have to go up to keep up with the demand.

Bitcoin price chart from Tradingview.com

Targets For BTC Price In 2024

Another bullish factor for the Bitcoin price is that the halving year coincides with the United States presidential elections. As Markus Thielen, Head of Research at Matrixport, pointed out in an analysis, this coincidence has always been bullish for the price.

The report points back to the previous halving and election years, which show the price of Bitcoin ending on a high note. The last three halving years have seen BTC rise 152% in 2012, 121% in 2016, and 302% in 2020, showing a consistent trend.

With the year 2024 being another halving and election year, the research analyst expects that the price of Bitcoin will finish out the year at $70,000. This would mean another 65% rally from the current price levels, and if the trends hold, the start of another bull market.

“Supported by the macro environment, monetary tailwinds, the US election cycle, and gradually increasing demand from TradeFi investors allocating to Bitcoin ETFs, a Bitcoin rally to 70,000 appears plausible,” Thielen said.

LUNC Price Rally Is Far From Over Following Falling Wedge Breakout, Analyst Says

Over the weekend, the LUNC price saw some of the most bullish price action that sent its price soaring over 20%. This rally eventually brought the price above $0.0001 after struggling around $0.00009 for the last two weeks. However, the tides seem to be completely changing for the altcoin, as one analyst expects the rally to continue.

Prepare For The LUNC Price To Double

The LUNC price, despite having risen so much, is still showing signs of a continuation. This is evident in the Falling Wedge Breakout that was confirmed by crypto analyst Ava Cryptoo on TradingView. This Falling Wedge Breakout is significant as it often precedes some of the most significant rallies in cryptocurrencies, such as LUNC.

The price of the altcoin is currently retesting the significant resistance at $0.000115. Now, this level is significant because rejection from this level had initially stopped the LUNC price breakout on Saturday. Now that the price is starting to retest it again, it shows that the bulls are far from done with this altcoin.

LUNC price chart from Tradingview.com

In a scenario where the LUNC price successfully retests and breaks above this level, then the crypto analyst expects that the price will more than double from its current level. They put the price target for the altcoin as high as $0.00022, and the timeline for this is shown to be a matter of days. However, all of this hinges on the fact that the price makes a “Perfect Retest” and breaks out completely.

LUNC price chart from Tradingview.com

Why Is The Altcoin Rallying Amid Low Market Sentiment?

The LUNC price breaking out during such slow market movements suggests an end to the accumulation that happened below $0.0001. In addition to this, Binance carrying out its scheduled LUNC burn contributed to the rise in price that was seen this weekend.

Binance, the largest crypto exchange in the world, has been committed to burning LUNC tokens realized from fees in an effort to help reduce its vast supply. The latest burn which took place on February 1 saw approximately 2.1 billion tokens performantly removed from circulation.

This is the 18th burn that the crypto exchange has carried out, each time removing hundreds of millions to billions of tokens from circulation. Following this burn, the crypto exchange has helped the LUNC burn figure cross the 51 billion threshold.

A wave of excitement naturally followed the monthly burn as the price started to rise rapidly. The LUNC trading volume reportedly surged more than 700% at the time, at first triggering a 10% increase in price. By the time the weekend was over, the LUNC price had already risen more than 20%, and continues to hold on to the majority of its gains.

What Is Sei (SEI) Network?

The Sei (SEI) Network is a Cosmos-based layer-1 blockchain that aims to change the world of digital asset trading, especially in the decentralized exchange (DEX) ecosystem. It was specifically designed for the world of trading, featuring various sectors of the cryptocurrency space spanning GameFi, NFTs, and, most especially, decentralized finance (DeFi). Sei is positioned as the “Decentralized NASDAQ,” as it offers a seamless blend of centralized finance (CeFi) trading experiences with decentralized finance tools.

Since its inception, it has established itself as a major player in the cryptocurrency space by providing cutting-edge features and advantages over rivals. With its innovative technology stats and passionate community, it has become one of the fastest-growing Layer 1 blockchains for trading and other purposes.

At its core, the SEI token is designed to optimize and streamline business operations and interactions. It is expected to be not just a cryptocurrency but a comprehensive solution that addresses several challenges in the contemporary blockchain ecosystem. 

SEI Network founders

Who Are The Founders Of Sei Network?

Sei (SEI) network founders and brains behind the SEI are Jayendra Jog, Dan Edlebeck, and Jeffrey Feng. Jayendra Jog was the former lead software engineer at Robinhood, a popular centralized crypto exchange. 

Dan Edlebeck is the co-founder and CEO of Exidio, a decentralized VPN application in the Cosmos ecosystem. Lastly, Jeffrey Feng brought his investment experience from his role at Goldman Sachs.

Investors And Institutions Backing the SEI Token

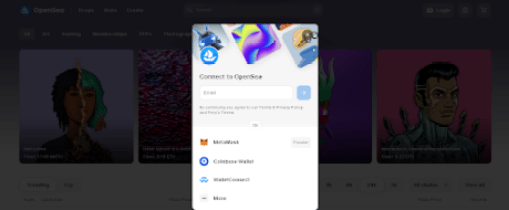
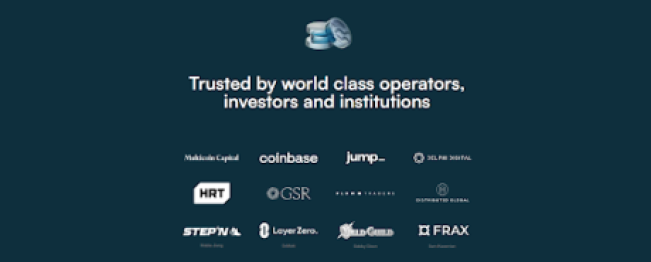
The Sei network has a lot of credible investors and institutions backing it, such as Coinbase, which is one of the largest centralized exchanges (CEX) in the world; Jump, Muitcoincapital, Layer Zero, GSR, and many more, as shown in the screenshot from the website below.

SEI Investors

What Sei Network Aims To Achieve In The Crypto Space And Beyond 

Sei aims to foster smart, efficient, and sustainable enterprises, and it does so by leveraging the power of blockchain technology to automate processes, reduce costs, and eliminate intermediaries. This makes Sei tokens a frontrunner in the race toward a decentralized future.

Sei token is unique in its approach and functionality as it goes beyond the standard features of cryptocurrencies and offers a sophisticated governance model encouraging active community participation. It takes the decentralization aspect a notch higher by ensuring fair and transparent decision-making.

The token is designed for compatibility and scalability, allowing seamless integration with new and existing business systems. This means whether you are a large corporation like Blackrock, which manages $10 trillion in assets, or a small business startup, the Sei token is designed to fit right into your operations, providing you with the benefits of blockchain without the hassle of overhauling your business system.

How Does Sei (SEI) Work?

One of the major problems with decentralized exchange (DEXs) is that orders are either not processed on-chain or are processed on-chain on a fast blockchain at the expense of decentralization and security. 

Given this bottleneck, the Sei network has implemented several innovative features to resolve the challenges faced by decentralized exchanges (DEXs) by combining off-chain speed with on-chain security. It aggregates orders at the end of the block and executes them all at once rather than executing them one at a time, and in this way, it prevents the persistent problem of front-running in decentralized trading.

The Sei network also makes use of native price oracles that minimize external dependencies while offering trustworthy data feeds. It handles the placement and execution order of a single transaction as opposed to doing so in two (2).

What Makes The Network Unique?

The Sei network stands out from the rest due to its self-executing smart contracts with the terms of the agreement directly written into code lines. The code and the agreement contained therein then exist across a distributed blockchain network.

This means that the transactions are irreversible and trackable, and they do not require a third-party intermediary. This automation process drastically reduces costs and increases efficiency, making transactions smooth and very easy.

Blockchain

Sei tokens also utilize a decentralized infrastructure, which means any single central entity or authority does not control it. Instead, control is spread out amongst many different nodes or computers that participate in the network to ensure that even if one node goes down, the entire network continues running smoothly.

The decentralized nature of the SEI token fosters a sense of community and mutual trust among its users. It boasts a democratic system that encourages active participation and promotes transparency and fairness.

Notable Features Of The Sei (SEI) Network

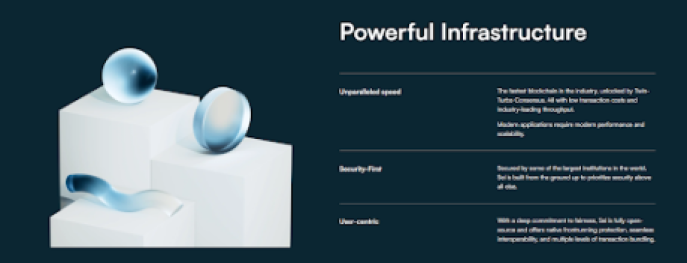
Twin-Turbo Consensus Mechanism: The Sei network leverages the Cosmos SDK and Tendermint Core to provide decentralized trading apps with speed, security, capital efficiency, and decentralization.

Parallelization: The Sei blockchain divides work into smaller chunks, processing and executing them simultaneously to prevent front-running.

Native Order Matching: The Native Order Matching feature ensures that decentralized exchanges (DEXes) are able to have their own central limit order book (CLOB).

Order Bundling: Sei offers order bundling at the client and chain level to enhance user experience and efficiency.

Price Oracles: It’s integrated into a native system for trustworthy assets with real-time oracles provided by validators, meaning that Sei provides users with an Oracle module that functions as a token price reference.

Lightning Speed Transactions: Sei claims to offer 600 milliseconds in transaction finality, making it highly scalable compared to other crypto projects like Bitcoin, Ethereum, and even Solana.

Fee Structure: At launch, SEI tokens have no chain-level trading fees; however, decentralized exchanges (DEX) may introduce their transaction fees through smart contracts.

Potential Applications Across Various Industries 

Banking and Financial Industry: The Sei blockchain technology is designed to streamline operations, eliminating the need for intermediaries and reducing transaction costs. This will bring a new level of transparency to the banking and financial industry, with every transaction recorded and traceable on the blockchain.

Medical and Healthcare Industry: The Sei network offers an efficient way to manage and share patient data securely. This can help eradicate fraudulent activities, improve patient care, and enhance data interoperability.

Supply Chain (Import and Export) Industry: The Sei blockchain network token can ensure the authenticity and traceability of products, from the raw materials to the end consumers. Every step can be recorded on the blockchain, providing full visibility and reducing the emergence of counterfeit goods and products.

Impact on the Environment: Sei’s eco-friendly consensus mechanism significantly reduces energy consumption compared to traditional cryptocurrency. Its smart contracts can automate carbon credit trading, supporting businesses in their sustainability efforts.

Digital Identities: The Sei network can be employed to develop a secure decentralized solution for managing digital identities and protecting individuals’ privacy and digital data.

The Tokenomics Of SEI Coin

Sei’s native cryptocurrency, SEI, does not have a maximum supply of tokens to be mined. However, it has a total supply of 10 billion coins. This means all of the tokens in circulation have been free-mined on the blockchain, including those that are locked or reserved. The token has a circulating supply of 2.4 billion at the time of publication. 

According to its website, 48% of the supply is in an Ecosystem Reserve, with Private Sale Investors and the Team receiving 20% of the supply, respectively. 9% of the supply went to the Sei Foundation and the Launchpool received 3% of the supply.

SEI Coin tokenomics

Sei token is up 619% since its all-time low of $0.09536 on October 19, 2023, and its latest all-time high of $0.8778 was recorded on January 3, 2024. With a market cap of $1.5 billion, it is currently the 48th-largest cryptocurrency in the industry.

Conclusion

The Sei network aims to solve issues not only in the crypto industry but also in other industries. This includes the likes of the banking and financial industry, where it aims to reduce the costs of transactions by eliminating the use of intermediaries and providing top-notch security measures to protect user privacy and identities.

The blockchain is energy-efficient compared to the likes of Bitcoin as it doesn’t consume as much energy. Its super-fast 600-millisecond transaction finality makes it highly scalable on a scale comparable to Kaspa, whose full confirmation transactions are at an average of 10 seconds.

How To Create And Mint Your Own NFTs On The Ethereum Network

The allure of creating your own NFTs and BRC-20 tokens is undeniable. For artists, owning and monetizing their digital creations through NFTs offers a new level of control and potential financial reward. Beyond the realm of art, NFTs can foster passionate communities, grant exclusive access to events, and even act as fundraising tools. 

However, stepping into the world of token creation isn’t without its challenges. It demands both a technical understanding of blockchain technology and smart contracts, along with a careful consideration of financial risks and potential regulatory implications. Before diving in, it’s crucial to assess your goals, resources, and risk tolerance. While the possibilities are vast and exciting, responsible and informed action is key to navigating this rapidly evolving landscape.

NFTs, or Non-Fungible Tokens, are digital assets that represent ownership or proof of authenticity for specific items or content. Unlike fungible cryptocurrencies like Bitcoin or Ethereum, NFTs cannot be exchanged on a one-to-one basis due to their unique nature.

NFTs are typically created and traded on blockchain platforms such as Ethereum, Binance Smart Chain, and decentralized marketplaces like OpenSea. These platforms utilize smart contracts to establish ownership and enable transparent and immutable transactions for NFTs.

NFTs can represent a wide range of digital items, including artwork, music, videos, virtual real estate, and collectibles. Each NFT has metadata describing the item it represents and a unique identifier that sets it apart from other NFTs

Creating NFTs On The Ethereum Network

The primary stage in the creation of NFTs involves identifying the content you wish to associate with your NFT. Consider the specific representation you desire for your NFT, whether it be digital artwork, collectibles, virtual real estate, or any other distinct digital item.

In this article, we will use illustrations from OpenSea to guide you on the steps you need to create your own NFTs. OpenSea stands as a leading decentralized marketplace built on the Ethereum blockchain, dedicated to NFTs. It creates a space where users can engage in buying, selling, and discovering an extensive array of digital assets, encompassing artwork, virtual real estate, collectibles, and more.

OpenSea delivers a user-friendly interface, showcasing a vast selection of NFT listings curated from diverse creators and projects. Through OpenSea, users gain the ability to explore the NFT community, partake in auctions, and securely manage their digital assets. With a commitment to fostering the expansion and accessibility of the NFT market, OpenSea ensures a seamless experience for enthusiasts and collectors alike.

This step-by-step guide covers how to create an NFT collection and mint directly to your wallet. 

First, visit the original OpenSea website, and click on the “Login” button at the top to connect your preffered wallet.

To figure out the best wallet to use on the Ethereum network, check here.

NFTs

Next,  click on your “Profile Icon” at the top right of your OpenSea interface in order to deploy a smart contract and select “Studio” through the pop-up options.

NFT OpenSea

To initiate the creation of a fresh NFT, simply click the “Create” button located at the top right corner.

OpenSea

When you explore the options, you will find the choice to either Drop a collection or Create/Mint an NFT. Selecting “Create an NFT”. This will enable you to mint an NFT directly into your wallet.

NFTs

Once you proceed, a fresh “Create an NFT” screen will be presented. If you are using OpenSea Studio tools for the first time to create an NFT, select “Create a new collection.” You will be able to add one NFT to this collection initially, with the option to include more NFTs at a later stage.

NFT

After selecting “Create a new collection,” you will be guided through the steps on your screen to deploy a smart contract. This process will enable you to create NFTs for your newly created collection.

To customize your contract, you need to add a logo image, choose a contract name, and designate a token symbol. Additionally, you will need to choose an EVM blockchain. It’s important to note that deploying a smart contract incurs gas fees, and the estimated fees for each blockchain will be displayed. If the fees are higher than anticipated, you can revisit the process at a later time, as they are subject to change based on network activity.

NFTs 

When you are prepared, proceed by clicking on “Continue”. This action will prompt a transaction signature request in your wallet, which will necessitate gas.

NFTs

Once the process is finalized, you will receive a confirmation message. Proceed to the next step by selecting “Create an NFT” as shown below.                                  :

NFT OpenSea

Having successfully created a smart contract, you are now prepared to generate an NFT. It is important to note that once your item is minted, further editing becomes impossible as it permanently resides on the blockchain. In this case, you will be creating an ERC-1155 NFT, which allows for the creation of multiple copies of the same item.

To begin this phase, upload the media for your NFT, which represents the artwork associated with it. Next, choose the collection in which you wish to mint your NFT.

Subsequently, provide a name for your item and set the desired item supply. The item supply determines the number of copies you wish to mint for the NFT. If you choose 1, then the item will be a one-of-one. 

NFT name

Next, click on the “Create” button at the bottom right, as shown in the above image.  A loading message will appear as the item is being minted. To proceed with the minting process, you will need to approve the transaction using your wallet.   

NFTs

Congratulations! You have successfully minted your very first NFT!

NFT OpenSea

Conclusion

Although NFTs and BRC-20 tokens have distinct functions and operate on separate blockchains, they both contribute to the growing realm of blockchain-based digital assets. NFTs have captured widespread interest for their exceptional nature and capacity to represent ownership of digital assets

Dogecoin Adoption Rate Touches New ATH, But Why Is This AI Bearish On DOGE Price?


DOGE The Dogecoin network is on a roll after a particularly disappointing performance leading up to the end of January. Usage on the network is beginning to pick up once more after the price made its way above $0.08. New adoption saw the highest spikes, as almost 1 million new DOGE wallets were created in a 7-day period.

890,000 New Dogecoin Wallets In One Week

According to data from the on-chain analytics platform, IntoTheBlock, the number of new addresses created on the Dogecoin network spiked significantly in the last seven days of January. The total number of new addresses created during this one-week period came out to a total of 890,000. However, the most interesting part is the spike that took place between January 28 and 29.

In the screenshot shared by IntoTheBlock on X (formerly Twitter), we can see that the majority of new wallets creation happened in a single day. The daily wallet creation went from an average of 60,000 leading up to January 28, and by January 29, around 240,000 new wallets were created in a single day.

The next day would see a slight decline from these 2024 highs. But by January 31, the numbers picked up once more. During this time, another 200,000 DOGE wallets were created in a single day, accounting for one of the largest spikes in new wallets on the network.

IntoTheBlock offered a possible explanation for the spike in new wallets which could be related to an increased interest in Doginals. Doom, a highly anticipated project, was launched on the Dogecoin blockchain, contributing to the spike. The on-chain tracker also added that “the rumors of Xpayments could be driving new users to Dogecoin.”

Dogecoin price chart from Tradingview.com

Machine Learning Algorithm Not Convinced On DOGE Price

Despite the increased interest in the Dogecoin network over the last week, the outlook for its native DOGE coin is still not favorable, according to the machine learning algorithm at CoinCodex. The algorithm has presented the likely movements of the DOGE price over the next few days to the next month, and they are far from bullish.

For the nearest term, the CoinCodex machine learning algorithm expects that there will be a small increase in price over the next five days, with an expected 1.54% rise. However, looking out in the long term, the algorithm expects a change in this positive momentum.

Over the next month, the AI expects that there will be an around 11.13% drop in price from the current levels. This would put the DOGE price at $0.071, pointing to the current sentiment toward the meme coin being rather bearish for now.

Nevertheless, Dogecoin is still holding on to its small gains of 0.7% over the last day, while maintaining its position as the 10th-largest cryptocurrency in the space with a market cap of $11.37 billion.

Bitcoin To $5 Million? S2F Model Predicts When This Will Happen

Using historical and future Bitcoin halving events, the Bitcoin Stock to Flow (S2F) live data chart model has pointed toward a BTC surge to unprecedented highs during the 2028 to 2032 halvings. 

Bitcoin To Hit $5 Million After 2028 Halving

Crypto analyst Bit Harington recently shared insights in a post on X (formerly Twitter) about the potential surges in the price of Bitcoin during the next halving stages. Using data from the Bitcoin S2F chart, Harington predicted the price of Bitcoin would reach $500,000 by the fourth halving, which is taking place in April. 

His predictions were based on the distinctive trend observed in BTC’s price, where the first to third halving phases exhibited a consistent 10x price increase for each successive halving. 

Responding to the post, the creator of the S2F model, Plan B, made a bold prediction, suggesting that the average price of Bitcoin during the 2028 and 2032 halving events could potentially reach an impressive $5 million. 

The cryptocurrency has consistently experienced bullish rallies following each halving event, from the first Bitcoin halving in November 2012 to the third in May 2020. Due to this, many investors and crypto analysts foresee a similar surge in BTC’s price during 2024 halving. 

These expectations could be attributed to the events that typically occur during a Bitcoin halving event. In each halving phase, BTC mining rewards are cut in half, and the supply of the token is reduced, thereby inducing scarcity and increasing the token’s value. 

While these price projections about Bitcoin are made to keep investors alert, it’s important to note that they remain speculations, and models like S2F can be subject to wide margins of error. 

Bitcoin price chart from Tradingview.com (BTC)

Analyst Reveals Key Factors To Consider In 2024 Halving

Another crypto analyst, Ali Martinez, has disclosed four crucial factors to keep in mind as the 2024 April Bitcoin halving approaches. Martinez highlighted the significance of the post-halving price corrections in the 2016 and 2020 Bitcoin halving, emphasizing that BTC declined by 30% to 70% within a month after the halving phases. 

He also mentioned BTC’s post-halving rallies, where the cryptocurrency experienced significant surges to 700%, 2,850%, and 11,000%, respectively, during the 2012, 2016, and 2020 halving events. The crypto analyst delved into bull market durations after each halving, which lasted about a year or more.

He concluded his analysis by predicting that the next Bitcoin market top would occur around April or October 2025. At the time of writing, the price of BTC was $42,110, according to CoinMarketCap. 

Bitcoin Whales Go On Buying Spree As Price Dips, Here’s How Much They Bought

A recent development shows that Bitcoin whales have refused to be deterred by the recent price action of the flagship cryptocurrency. Instead, they have chosen to see it as an opportunity to accumulate more BTC. This move could turn out to be really profitable based on a recent analysis by crypto analyst Ali Martinez

An Increase In Bitcoin Whales

Ali Martinez stated in an X (formerly Twitter) post that 46 new entities now hold 1,000 BTC or more, which represents a 3% increase in just two weeks. Data from BitInfoCharts further shows that there are now 1,898 wallet addresses holding this amount of Bitcoin or more. This is significant as it suggests that more people have become bullish on the crypto token despite the recent market correction

These whales no doubt have enough reason to be bullish on BTC, as Martinez’s recent Bitcoin analysis suggests that the tide could turn soon enough. The analyst highlighted in an X post how, historically, price corrections for Bitcoin have “consistently been followed by further upside gains” in bull markets. 

As such, he noted that dips like this might offer “strategic buying opportunities for those looking to capitalize on Bitcoin’s potential growth.”

Meanwhile, the Spot Bitcoin ETF issuers have helped contribute to the increase in this figure, considering they have had to accumulate BTC for their respective funds. Data from on-chain analytics firm Arkham Intelligence shows that the world’s asset manager, BlackRock, currently holds over 44,000 BTC for their Bitcoin ETF. 

Bitcoin price chart from Tradingview.com (BTC whales)

BTC Still Has More Bullish Momentum 

While many in the crypto community continue to speculate whether the bull market is back, there is reason to believe that BTC’s bullish momentum is not fading anytime soon. In his most recent X post, Ali shared how the next market peak could land around 2025 if Bitcoin is to mirror past bull runs. Going by this projection, Bitcoin is said to have 600 days of bullish momentum still ahead. 

In the meantime, Bitcoin bulls will have to overcome the selling pressure from Bitcoin whales like Grayscale. The asset manager had to offload a significant portion of its BTC holdings due to the amount of outflows it keeps recording from its Spot Bitcoin ETF. GBTC investors like FTX are reported to be taking profits, considering that the fund had traded at a significant discount to Bitcoin’s price before now.  

At the time of writing, Bitcoin is trading at around $39,000, up in the last 24 hours, according to data from CoinMarketCap.