Stablecoin backing is under fresh fire after outspoken economist and gold supporter Peter Schiff took aim at tokens tied to US dollar reserves. He argues that relying on a fiat currency he views as shaky makes little sense when a more stable asset exists.
His comments have reignited a long‑running debate about what should sit behind digital coins that promise a steady peg.
Schiff Questions Fiat Backing
According to Schiff, it makes no sense to support a token pegged to a currency that can be inflated away. “I get Bitcoin, but not US dollar stablecoins,” he wrote in a social media post.
He pointed out that fiat money can be printed in large amounts, while gold has a fixed supply and centuries of use as money. Schiff said gold cannot be easily devalued by inflation or reckless monetary policies.
I get Bitcoin, but not U.S. dollar stablecoins. If you’re going to introduce a third party custodian, why settle for a token backed by a flawed fiat currency like the dollar, when you can own one backed by gold? You get the same liquidity, but you also get a real store of value.
— Peter Schiff (@PeterSchiff) June 19, 2025
Gold‑Backed Tokens On The Rise
Based on reports, gold‑backed stablecoins are seeing more interest from investors worried about inflation and dollar weakness. Tokens like Tether Gold (XAUT) and Paxos Gold (PAXG) let users move digital claims on physical gold. These assets give the same quick transfers and high liquidity as dollar‑pegged coins but tie each token to real metal stored in vaults.
Regulatory Scrutiny Intensifies
Regulators across the globe are racing to establish precise regulations for stablecoin reserves. Congress members in the US are considering tighter reserve and audit requirements. Europe and Asia are creating their own regulations to achieve transparency and safeguard users. Schiff’s call for gold introduces additional context to these discussions. It could lead regulators to explore whether commodities can serve as backing for tokens under particular regimes.
Market Reaction Mixed
According to reports, Schiff’s tweet trended, garnering over 500,000 views within 24 hours. Crypto naysayers applauded his observation on fiat risk. Other investors cautioned that gold-backed tokens have higher fees and cumbersome custody expenses. They explained that transferring metal or establishing physical reserves introduces friction when compared with exchanging dollar-backed coins at a bank custodian.
Investors also pointed out that stablecoins are widely used in lending, trading and payments within DeFi platforms. Dollar‑pegged tokens like USDC and USDT dominate these flows because they tie directly into existing banking rails. Gold‑backed coins, by contrast, tend to be held as digital bullion rather than spent on everyday transactions.
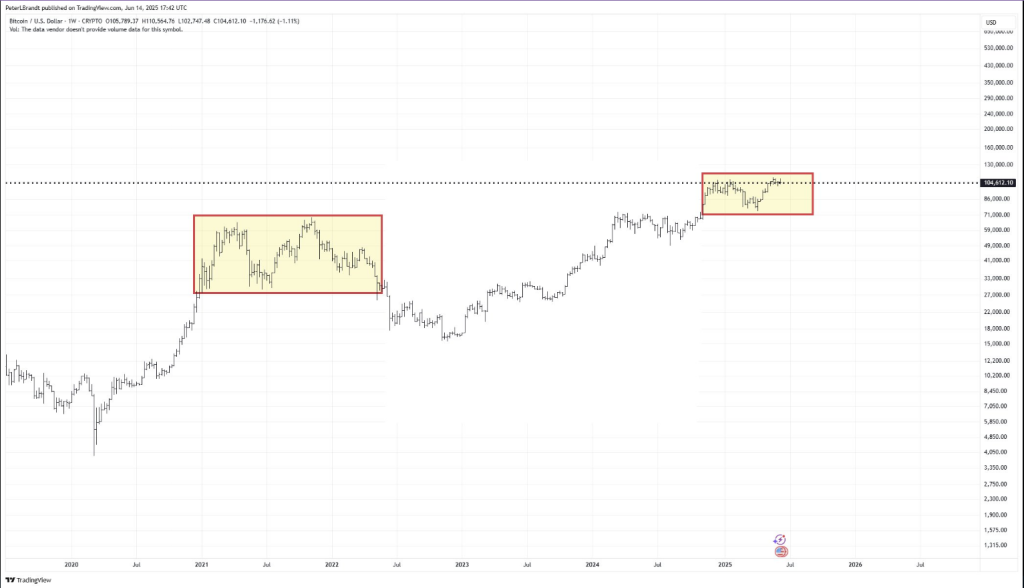
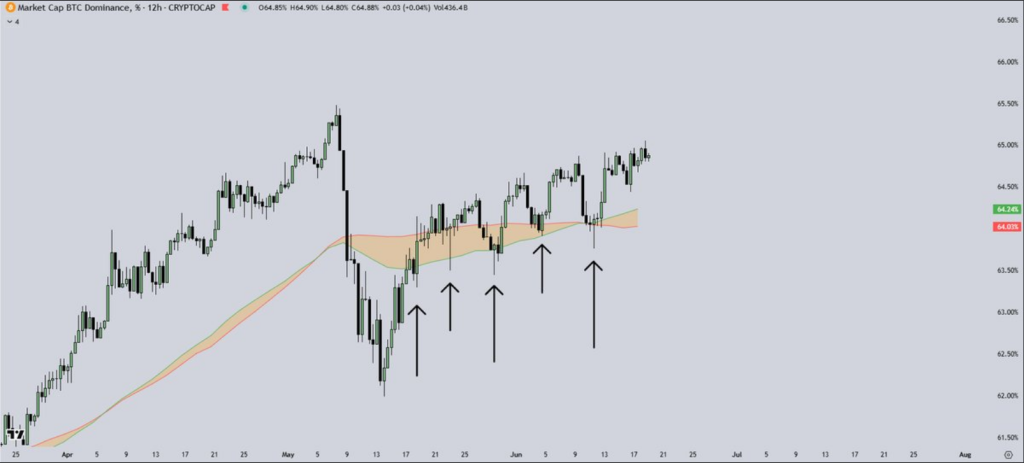
Featured image Imagen, chart from TradingView
 (@el_crypto_prof)
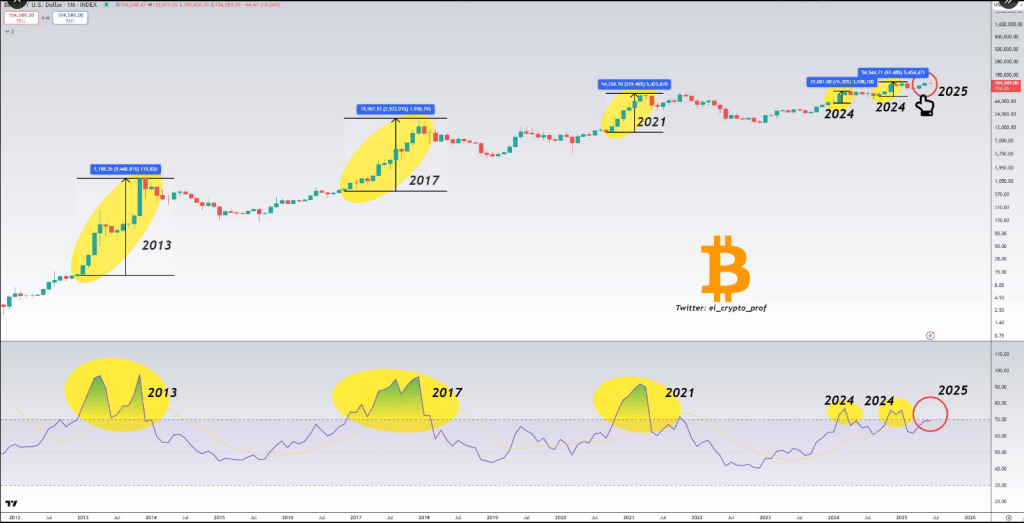
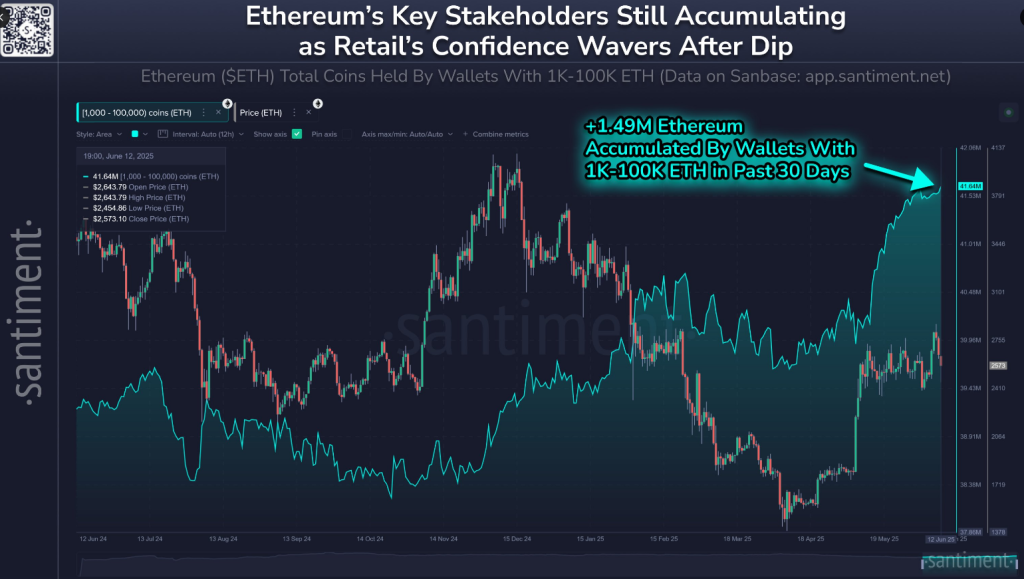
 Bitcoin’s elite vs. mortal wallets are moving in two different directions as its market value sits just north of $104.3K.
 Wallets with 10+
  Wallets with 0.001 to 10
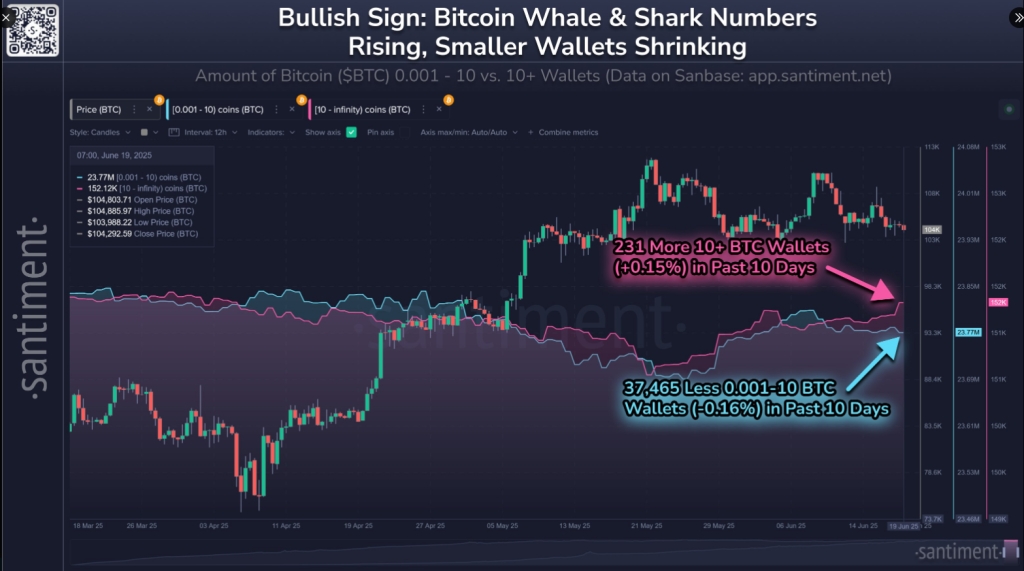
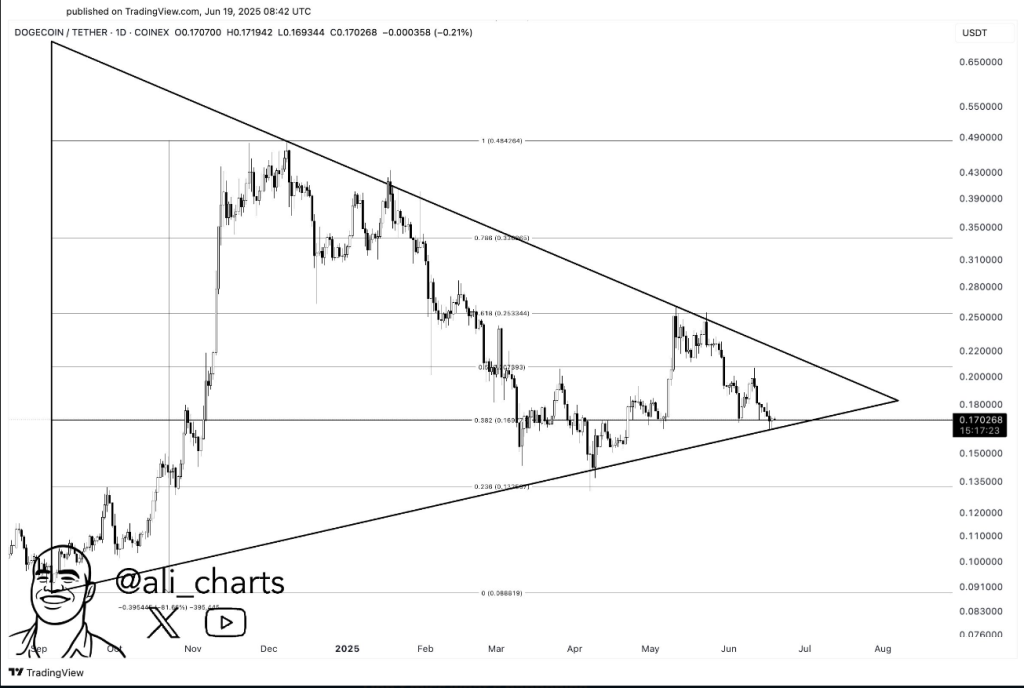


 (@CryptoFaibik)


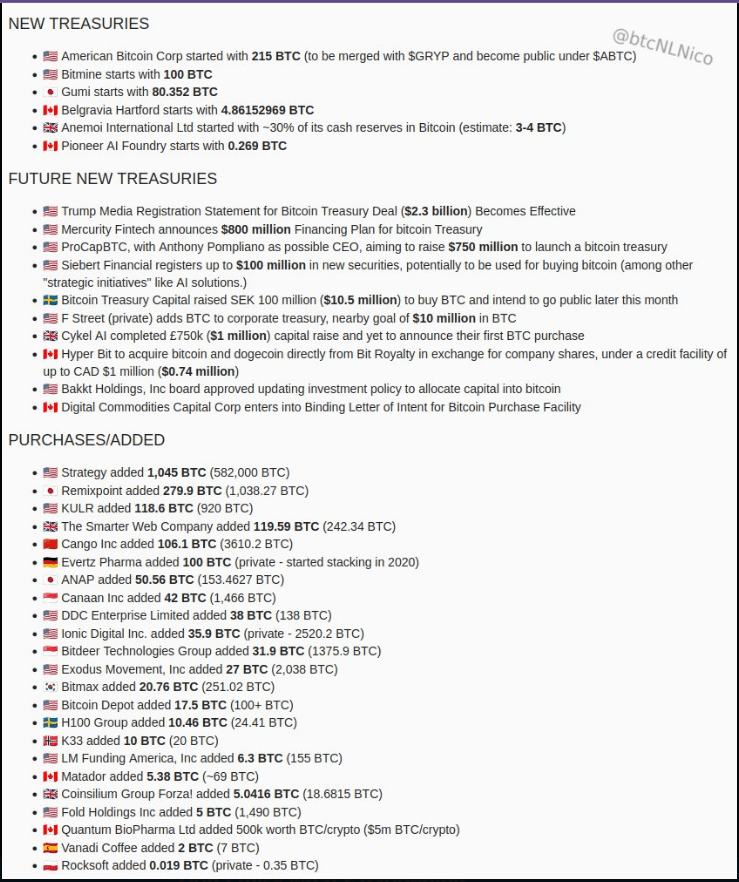
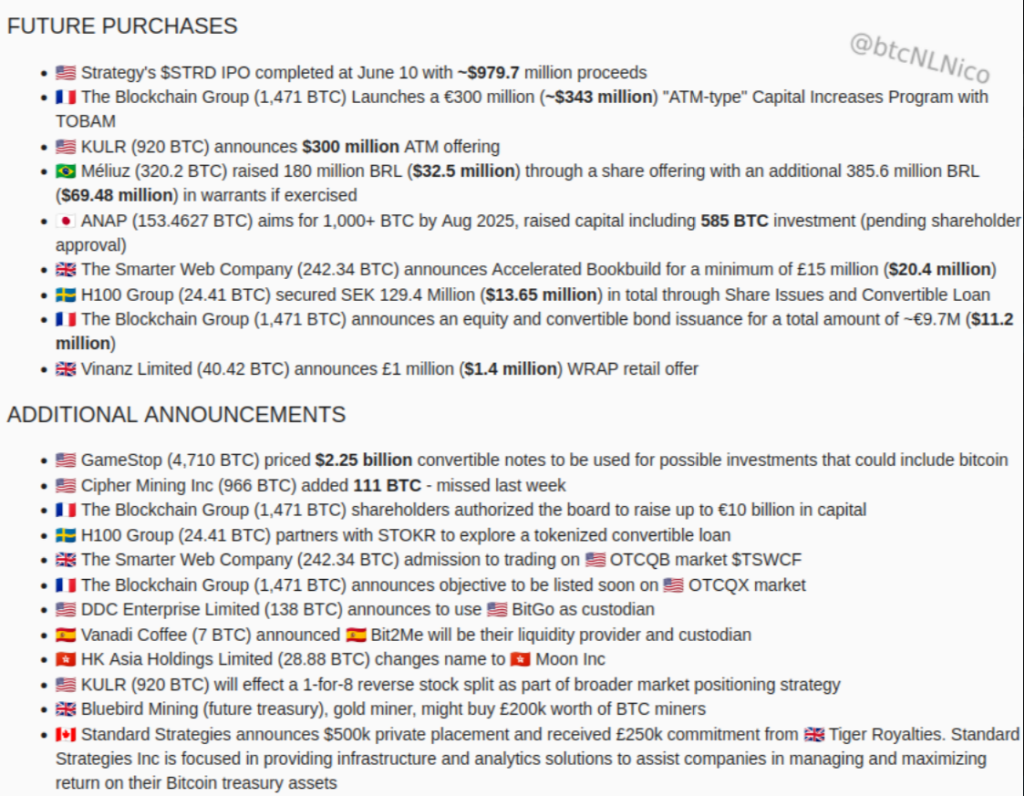
 Week 24 –
  June 9-13 saw a massive 60 announcements!