As 2024 approaches, crypto analytics firm Nansen offers insightful predictions for the crypto sector, anticipating significant developments and shifts. Despite cautious optimism, they acknowledge a 10-20% chance of inflation resurgence after the US Federal Reserve (Fed) pivot, potentially impacting crypto prices.
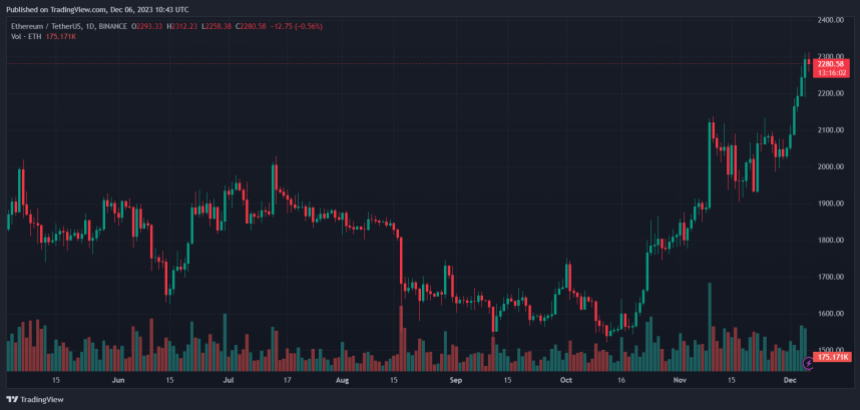
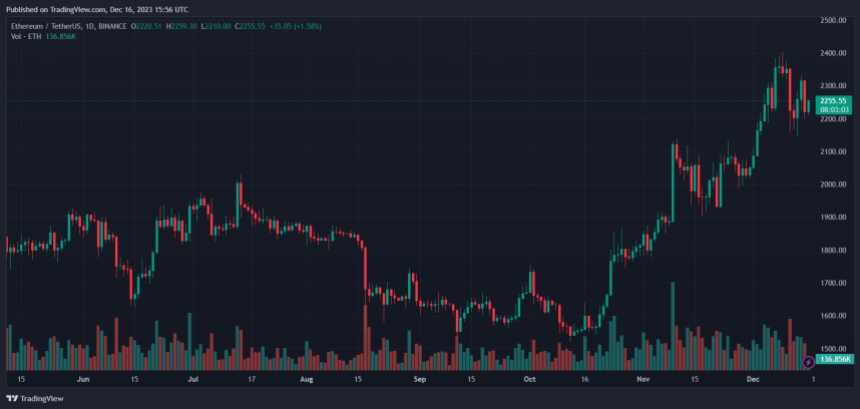
Related Reading: Ethereum Price Close Below $2,120 Could Spark Larger Degree Decline
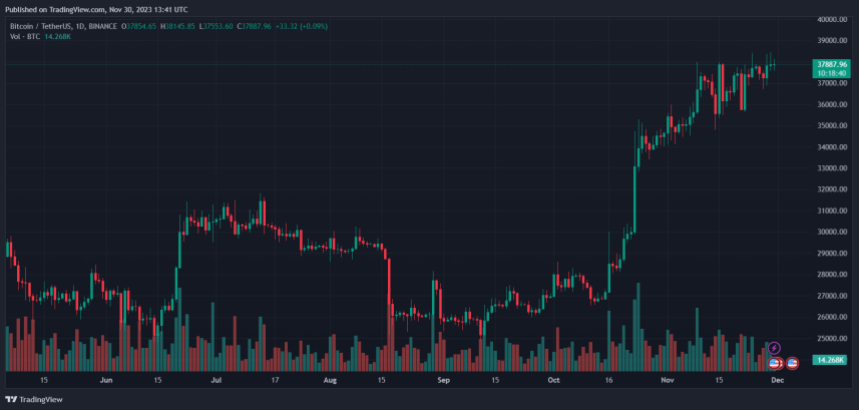
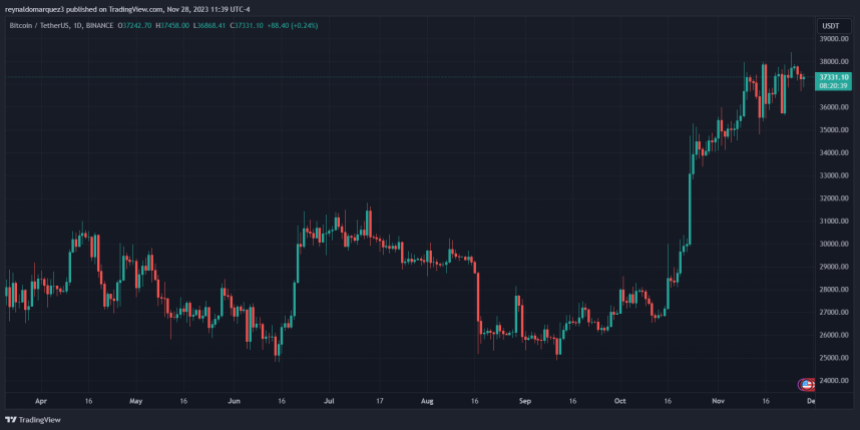
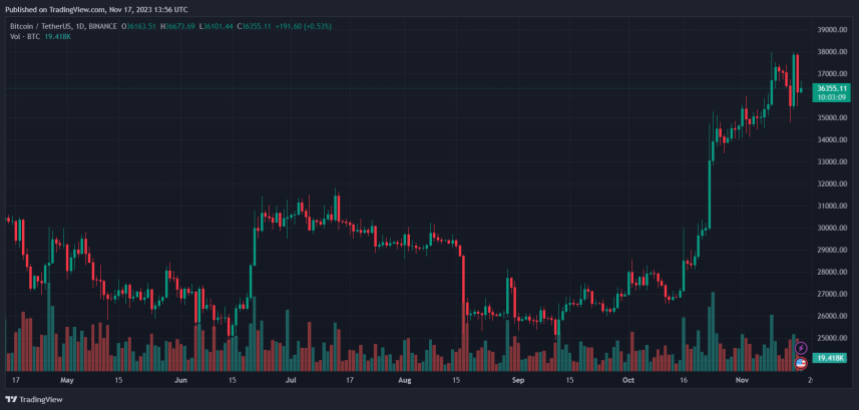
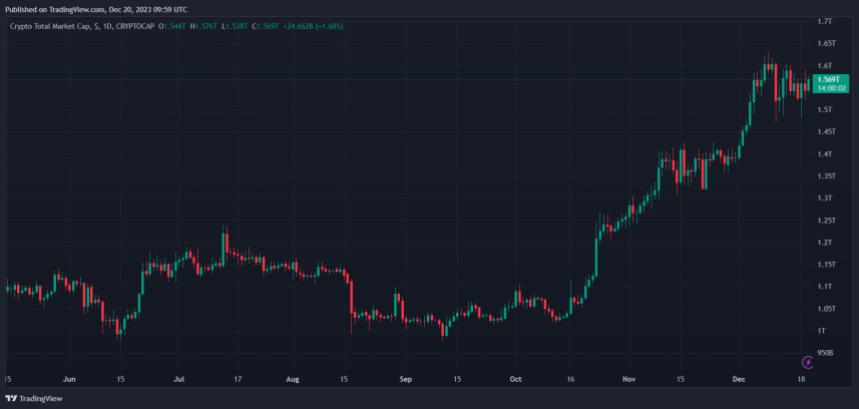
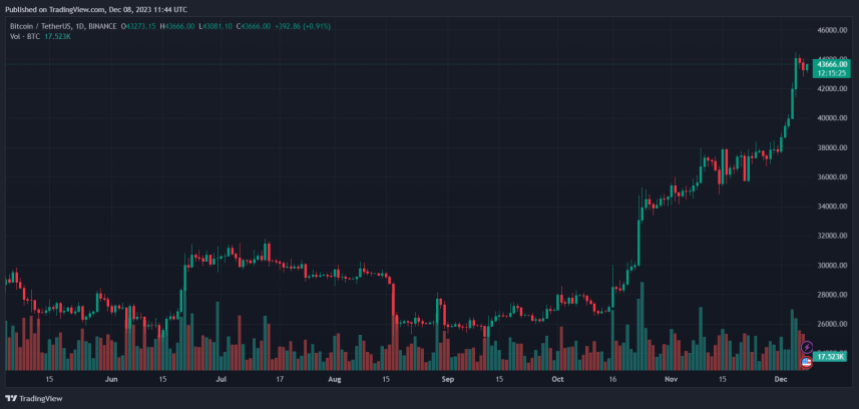
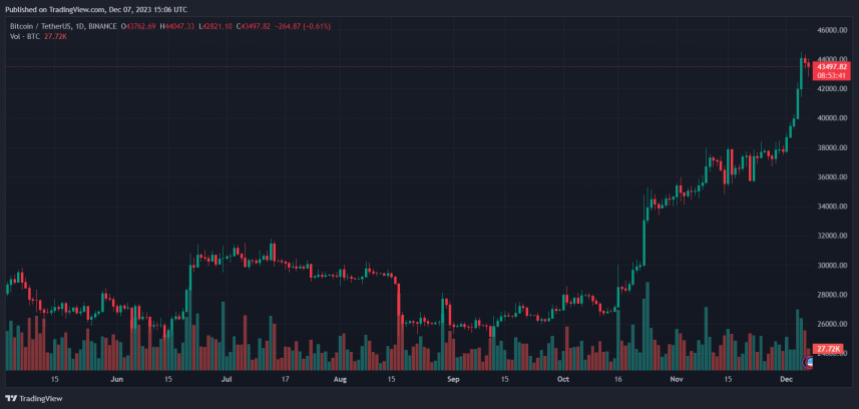
As of this writing, the total crypto market capitalization is $1.5 trillion on the daily chart and seems poised for further upside in the long run.
AI As Primary Use Case: The New Hot Thing In 2024?
According to the firm, a key high-conviction bet for 2024 is the emergence of Artificial Intelligence (AI) agents as primary blockchain users. Integrating AI and blockchain is expected to “advance rapidly, enhancing blockchain performance and broadening use cases.”
This development signifies a crucial step in the blockchain world, potentially transforming how transactions and interactions are processed on the network.
Another focus area is the intent-centric applications that address user experience (UX) challenges in the crypto space. These applications are designed to simplify user interactions with networks, removing complexities and making the technology more accessible to a broader audience.
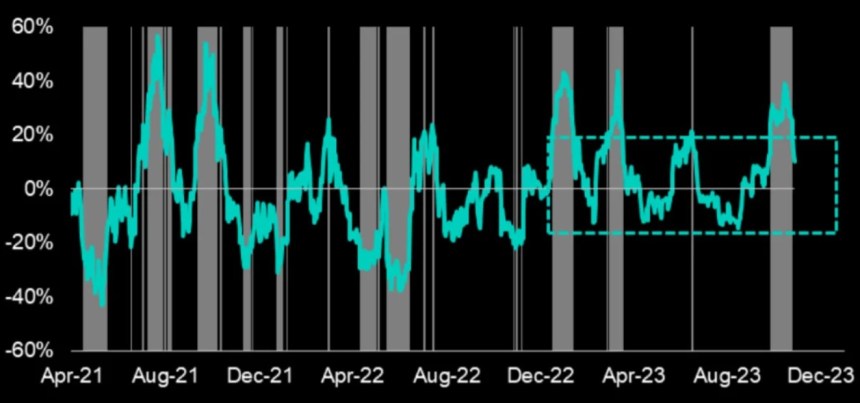
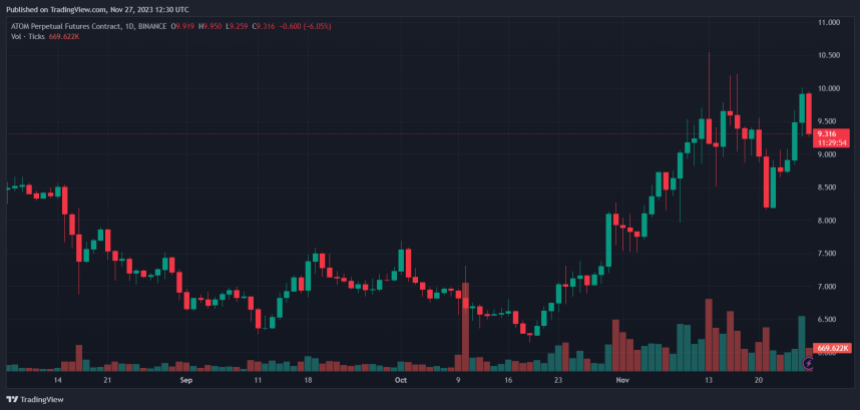
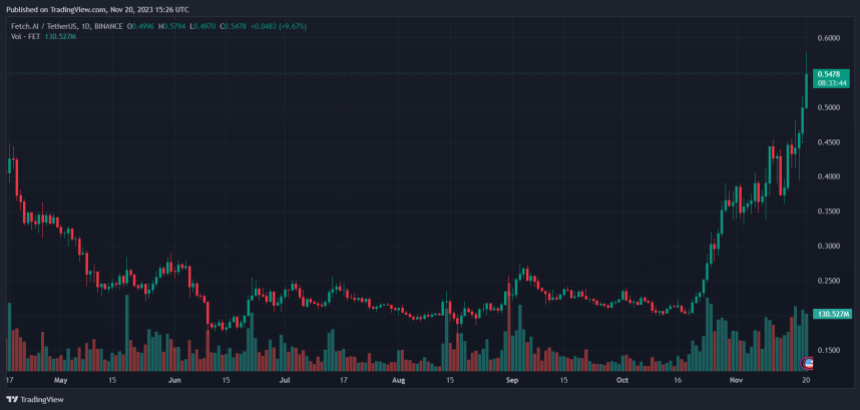
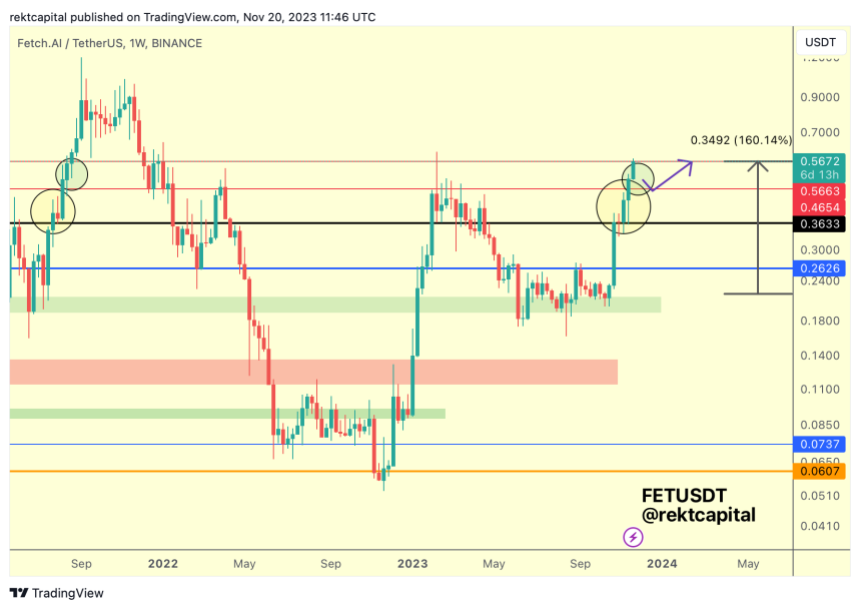
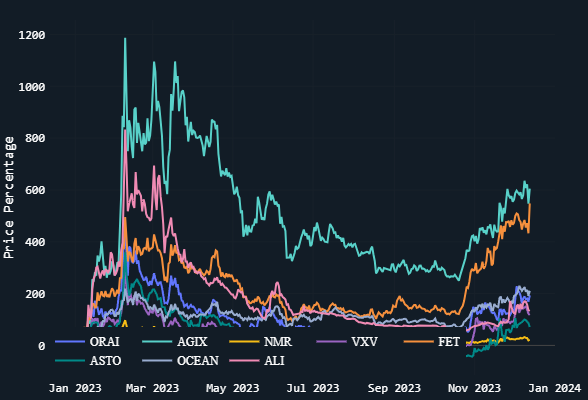
As seen in the chart below, the integration between AI and crypto is already paying off for early investors. Despite the persistent downside pressure recorded across the board, the AI tokens sector has been among the best-performing in the nascent industry.
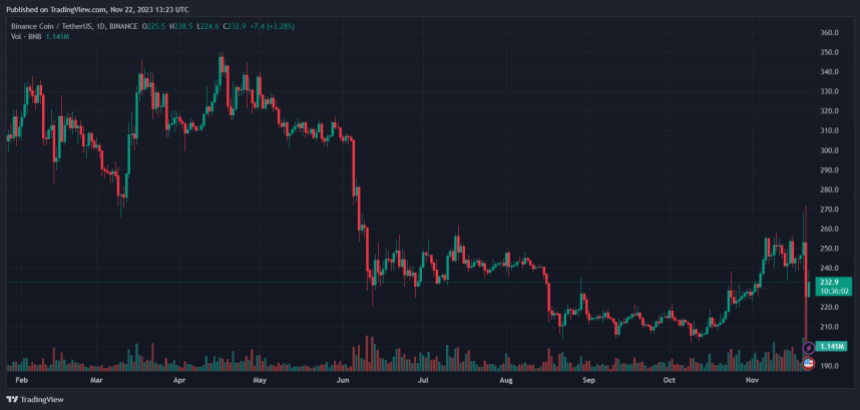
2024 is also projected to be a pivotal year for decentralized exchanges (DEXs). Nansen forecasts that DEXs will gain significant market share from centralized exchanges (CEXs), driven by monetary incentives and innovative features.
This shift could mark a fundamental change in the crypto trading landscape, emphasizing the growing importance of decentralized financial systems. Since 2020 and 2021, DEX has been gaining ground over CEX, and the trend might favor the former in 2024.
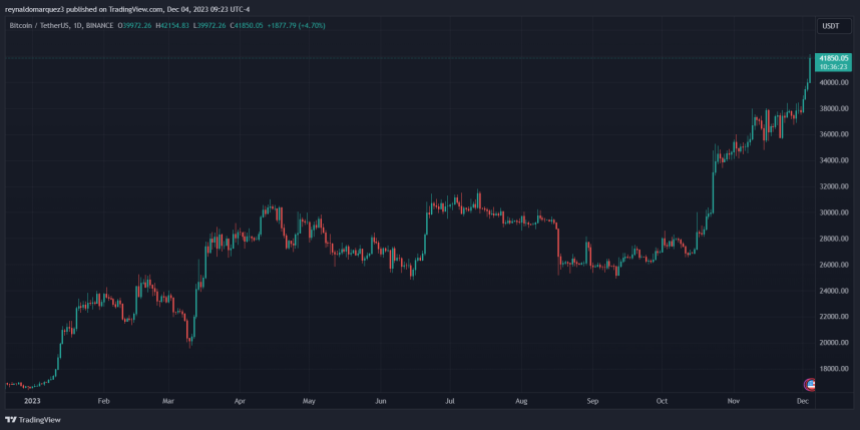
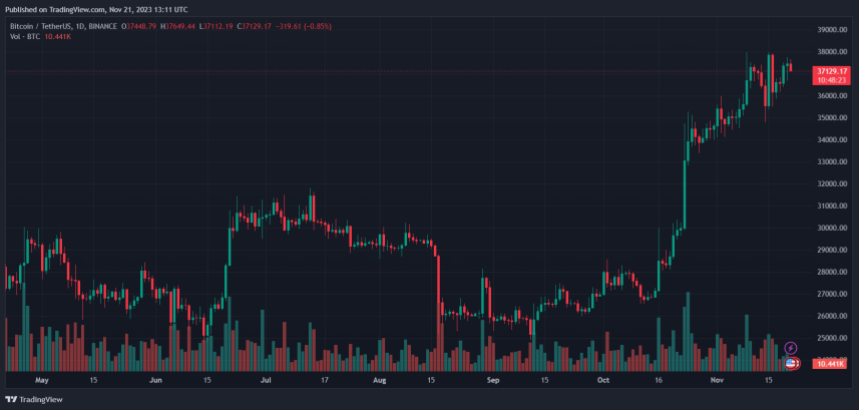
Finally, Nansen believes that the largest and most trusted cryptocurrency, Bitcoin, is expected to secure a broader range of use cases beyond simple transactions. This expansion could open new avenues for Bitcoin and highlight its versatility and robustness as a digital asset.
Use cases such as non-fungible tokens (NFTs) already gained popularity in 2023, and this trend might continue. However, some Bitcoin community members are fighting the change, which could hinder its adoption and implementation.
Nansen: Market Scenario Analysis For 2024
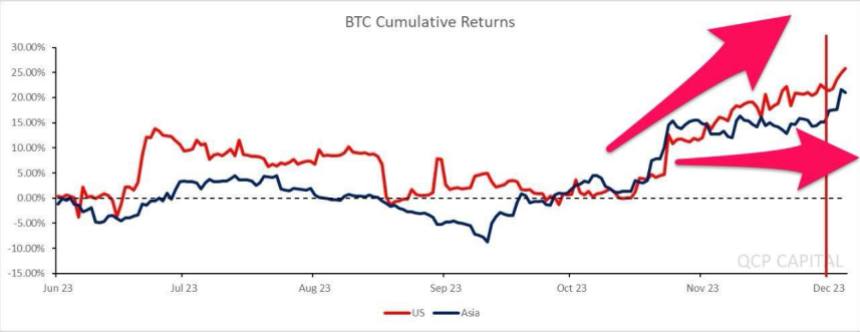
The potential scenarios for the crypto market in 2024 depend a lot on the macroeconomic situation. In a “soft landing” situation, where inflation slows without drastically increasing unemployment, crypto prices are expected to grow steadily.
However, there’s also the possibility of a re-acceleration of inflation or a recession, which would pose challenges for crypto prices and change the bullish narrative. Nansen’s analysis also acknowledges structural drivers likely to influence the crypto market, such as the statistical boost around Bitcoin’s halving.
These structural drivers also include the adoption of blockchain by major traditional players and regulatory clarity, particularly around a BTC spot Exchange Traded Fund (ETF) in the US. However, unknowns like geopolitical events and macroeconomic shifts could significantly impact the market.
In conclusion, Nansen’s research presents a nuanced view of the crypto market in 2024, highlighting potential growth areas like AI integration and DEXs while remaining aware of the challenges ahead. The year promises to be crucial for the crypto sector, with significant developments expected in technology integration, market structures, and regulatory landscapes.
Cover image from Unsplash, chart from Tradingview


 The Bitcoin narrative continues to steer the ship, but a closer look reveals the total altcoin market cap playing catch-up.