Cardano Price Prediction: Analyst Says $0.8 Might Not Come Again If This Wedge Breaks Out

As part of his Cardano price prediction, crypto analyst CobraVanguard has revealed what needs to happen for ADA to never drop below the $0.8 level again. This comes amid the US SEC’s acknowledgment of Grayscale’s Cardano ETF filing, providing a bullish outlook for the crypto. 

How The Cardano Price May Never Drop Below $0.8 Again

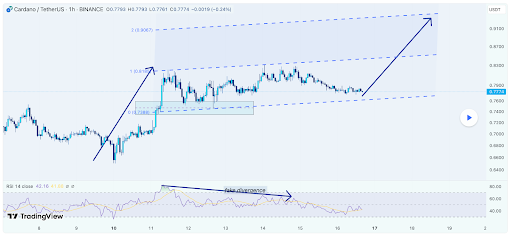
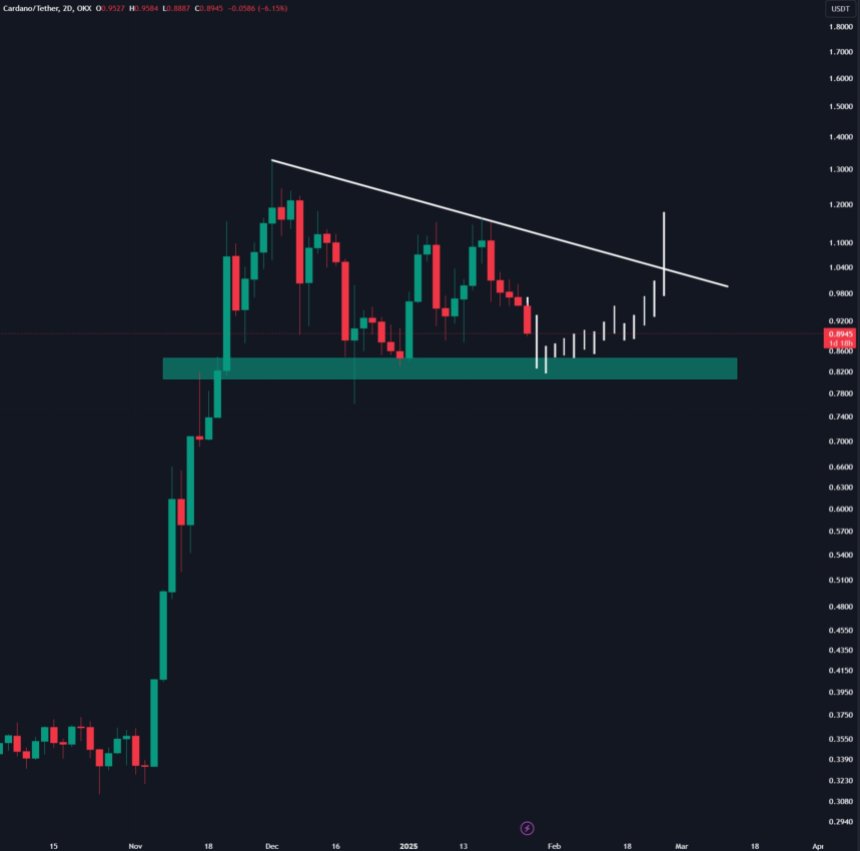
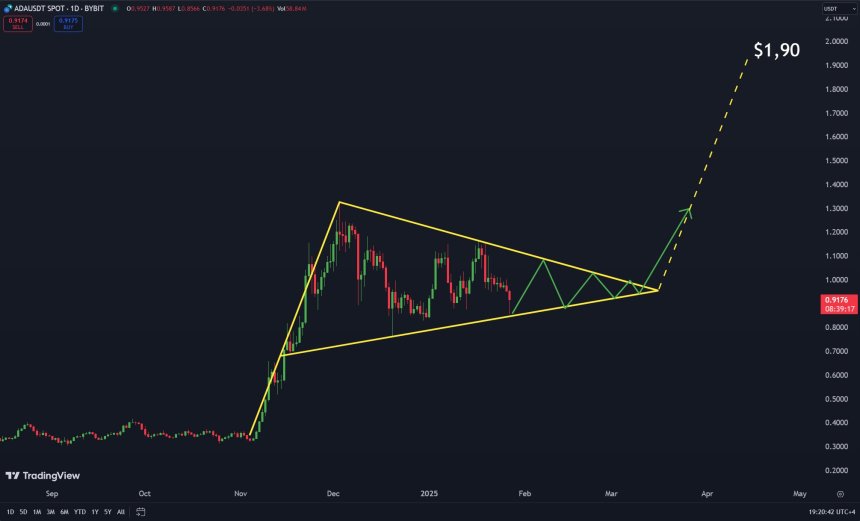
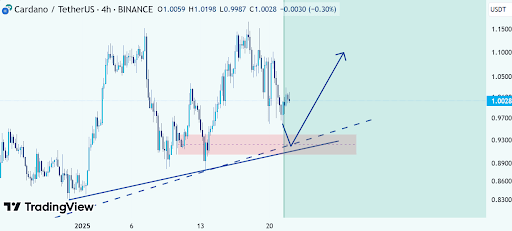
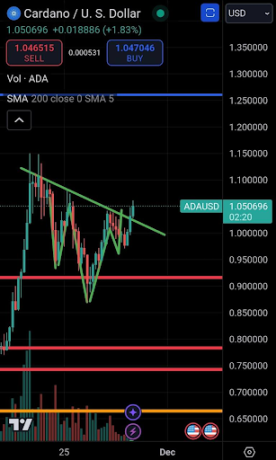
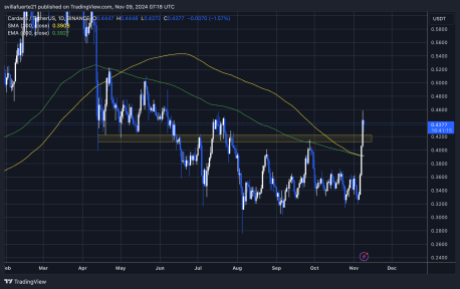
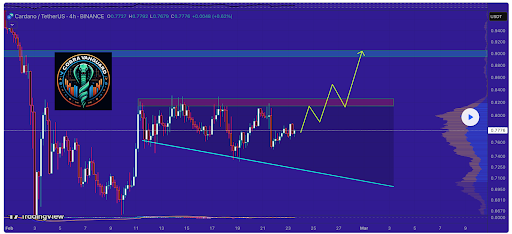
In a TradingView post, CobraVanguard noted that the Cardano price continues to move well within the wedge. The analyst claimed that if this wedge is broken, then market participants will no longer see ADA below $0.80. The analyst’s accompanying chart showed that a break above could see Cardano reclaim the $1 psychological price level

This bullish outlook for the Cardano price comes as the US Securities and Exchange Commission (SEC) acknowledged Grayscale’s Cardano ETF filing. An ETF is bullish for the ADA price as it will attract institutional investors and drive more inflows into the coin’s ecosystem, which could spark a rally to new highs. 

Cardano

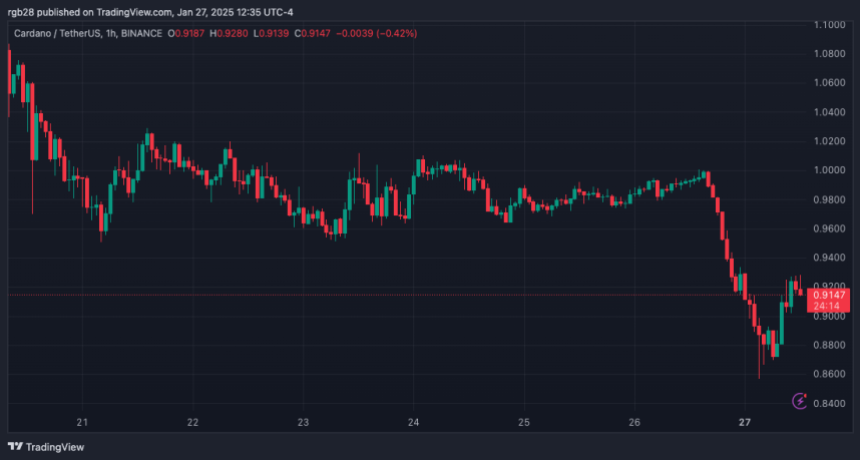
However, in the meantime, the Cardano price looks to be in bearish territory, as it has declined alongside the broader crypto market. ADA is currently below the $0.8 price level, which could represent a great buying opportunity, especially if the crypto eventually never sees this price level again, as CobraVanguard predicted. 

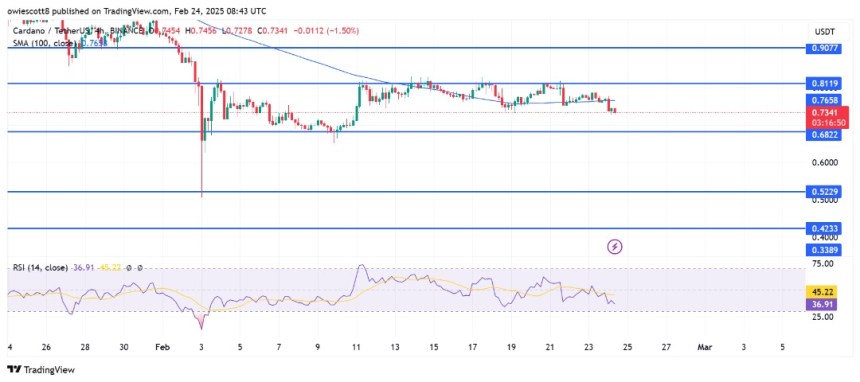
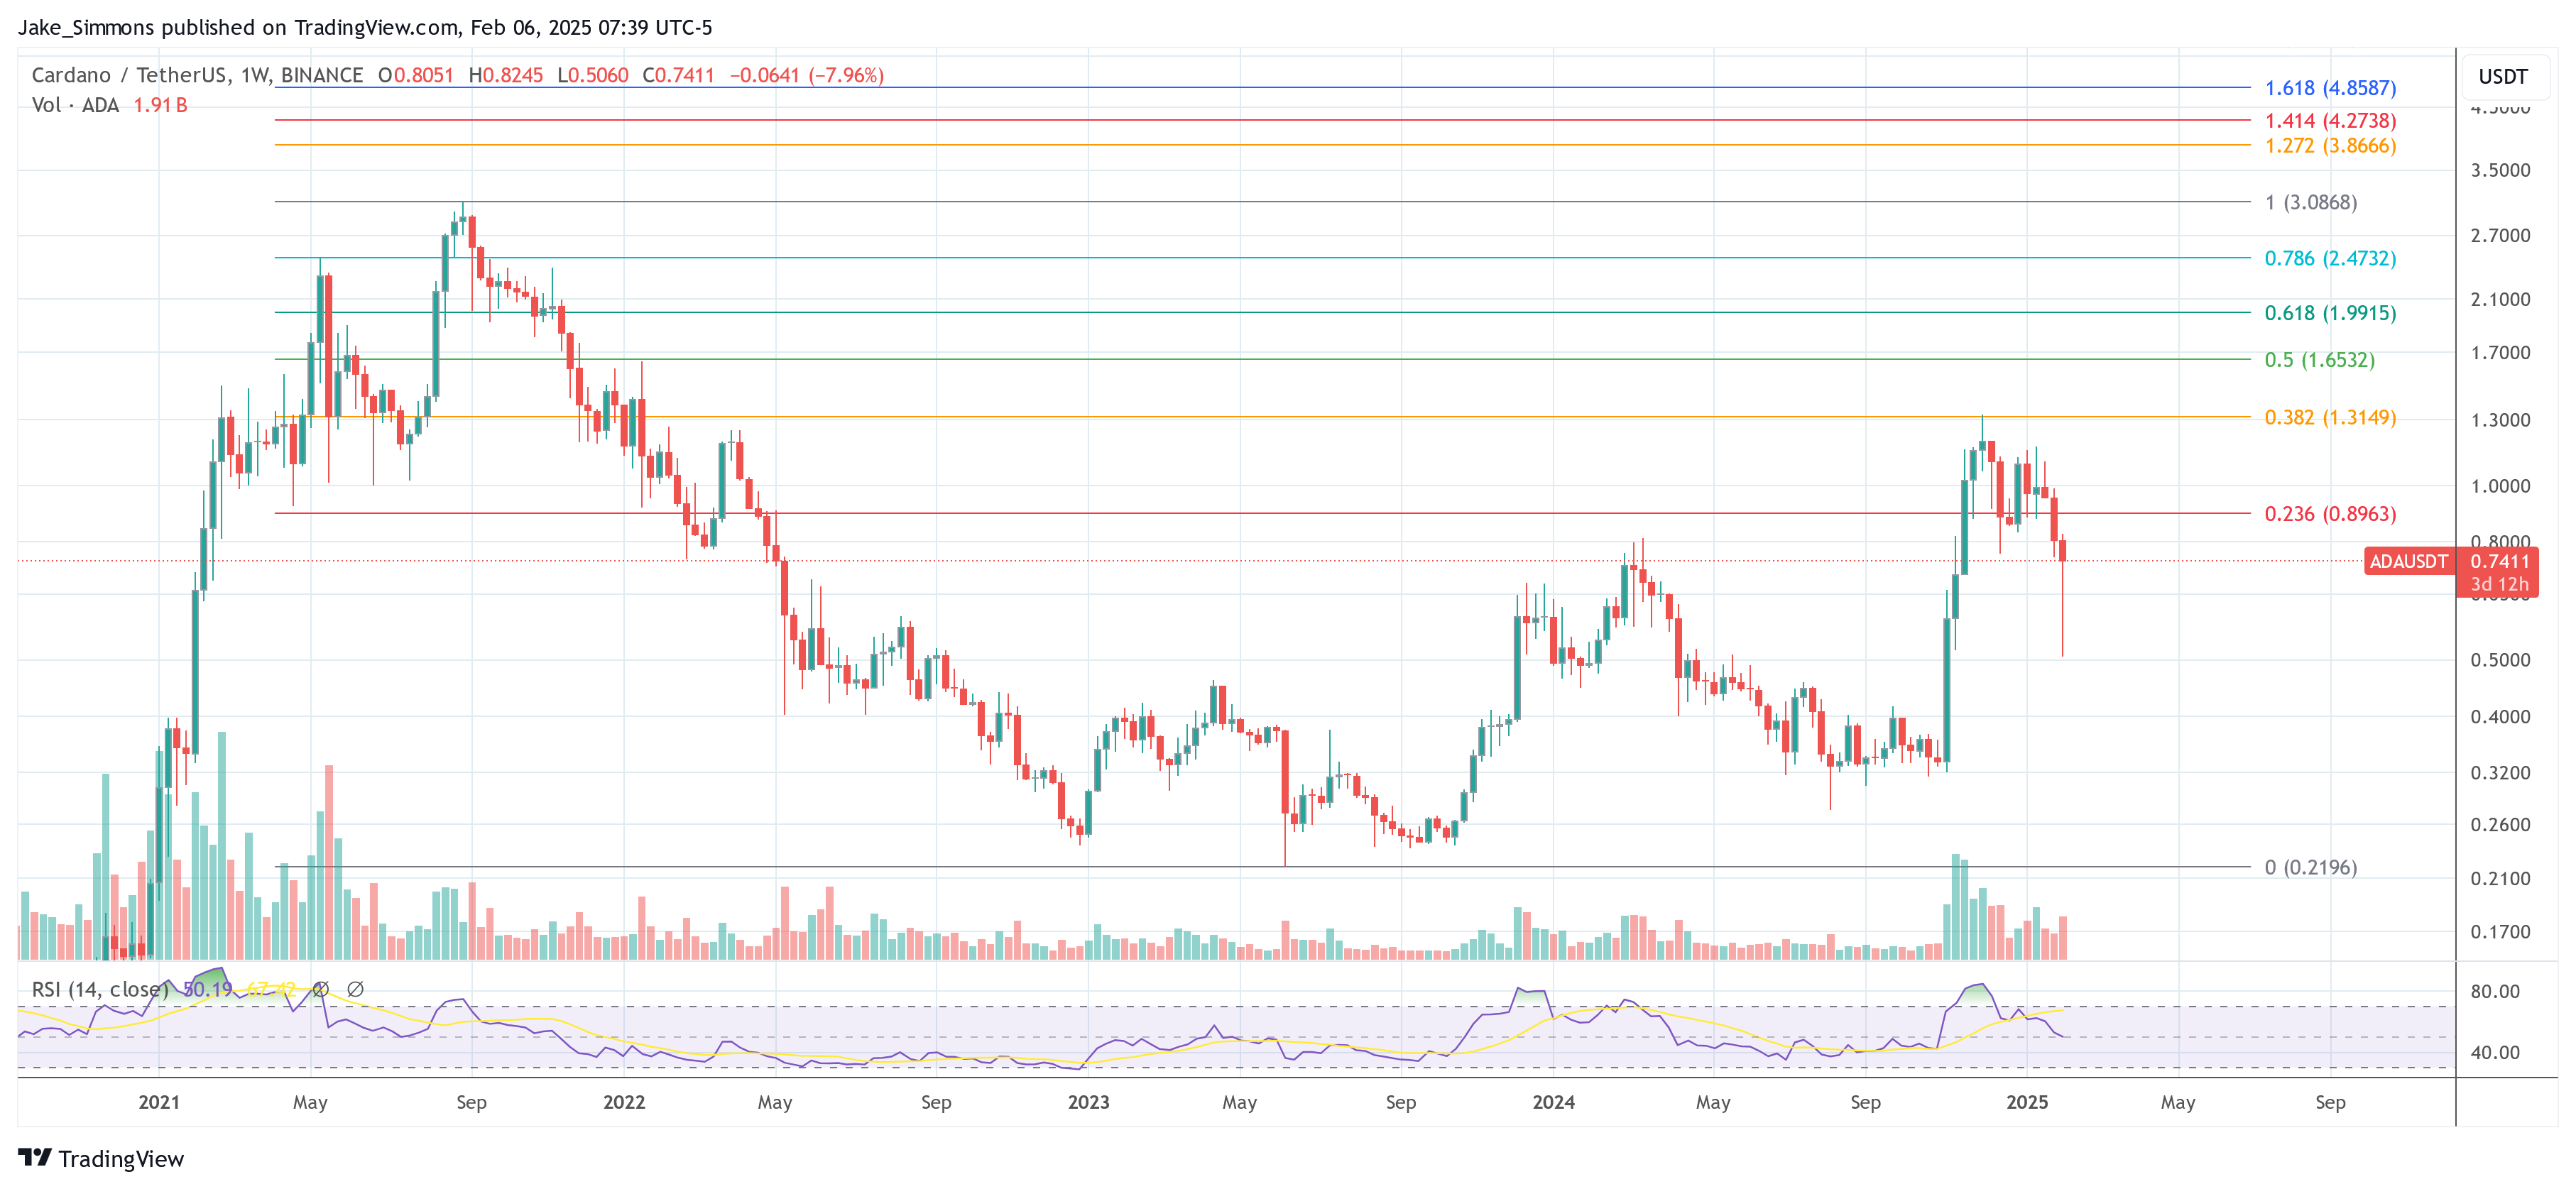
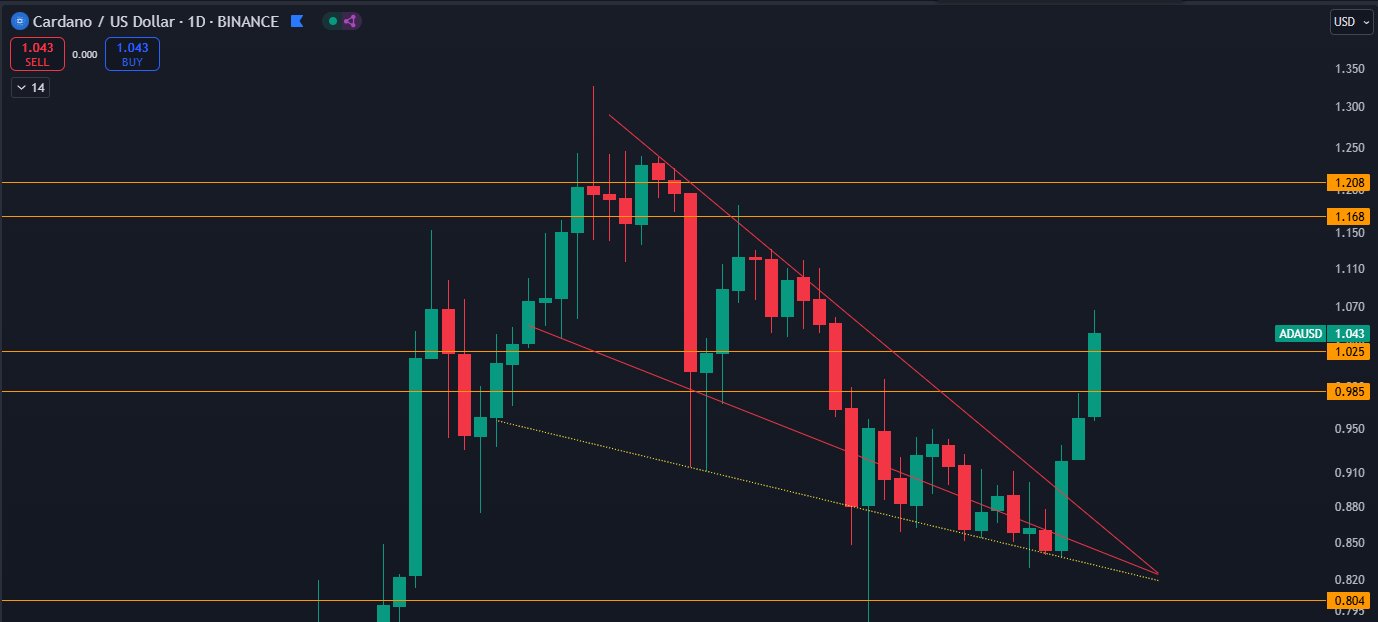
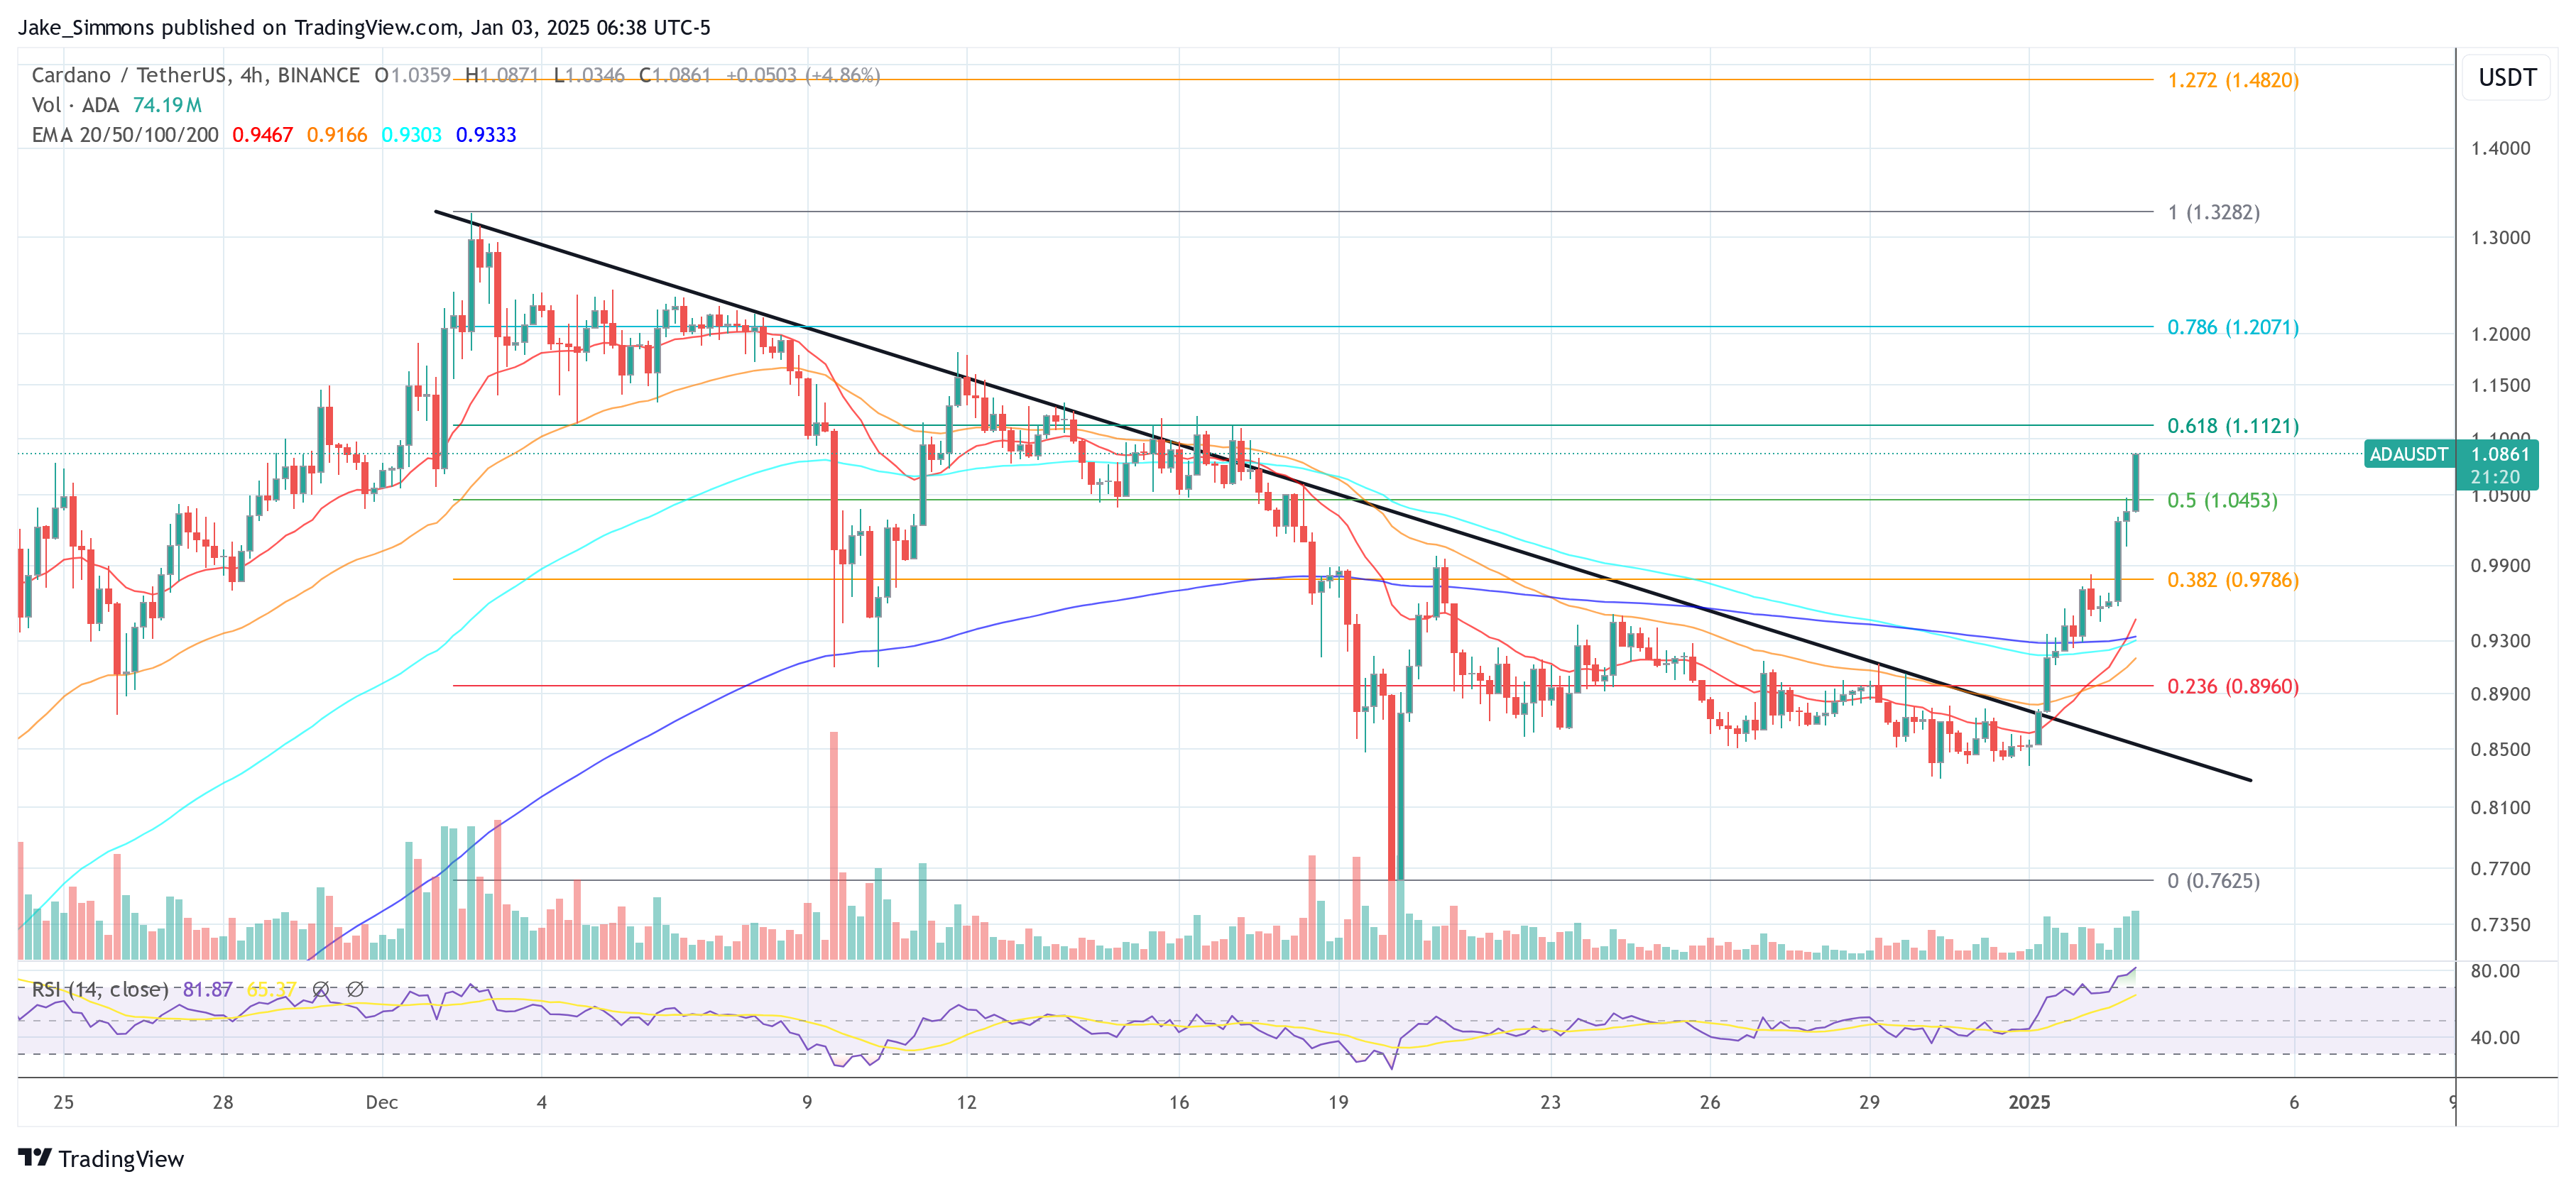
Regarding the short-term bearish outlook for the Cardano price, crypto analyst CryptoBusy also noted that ADA is barely clinging to its 0.5 Fibonacci support level. The analyst added that a breakdown below this Fib support could lead to a straight drop to the $0.618 price level. CryptoBusy suggested that this breakdown will likely happen as ADA is facing significant selling pressure. 

A Mega Bounce Is Coming For ADA

In an X post, crypto analyst Sebastian told market participants to get ready for a mega bounce for the Cardano price after this market downtrend. In another post, he remarked that the worst time to sell is right now. He added that in a month, market participants will wish they had bought more. According to him, the market is a game of emotions and the more people capitulate, the higher prices will go eventually. 

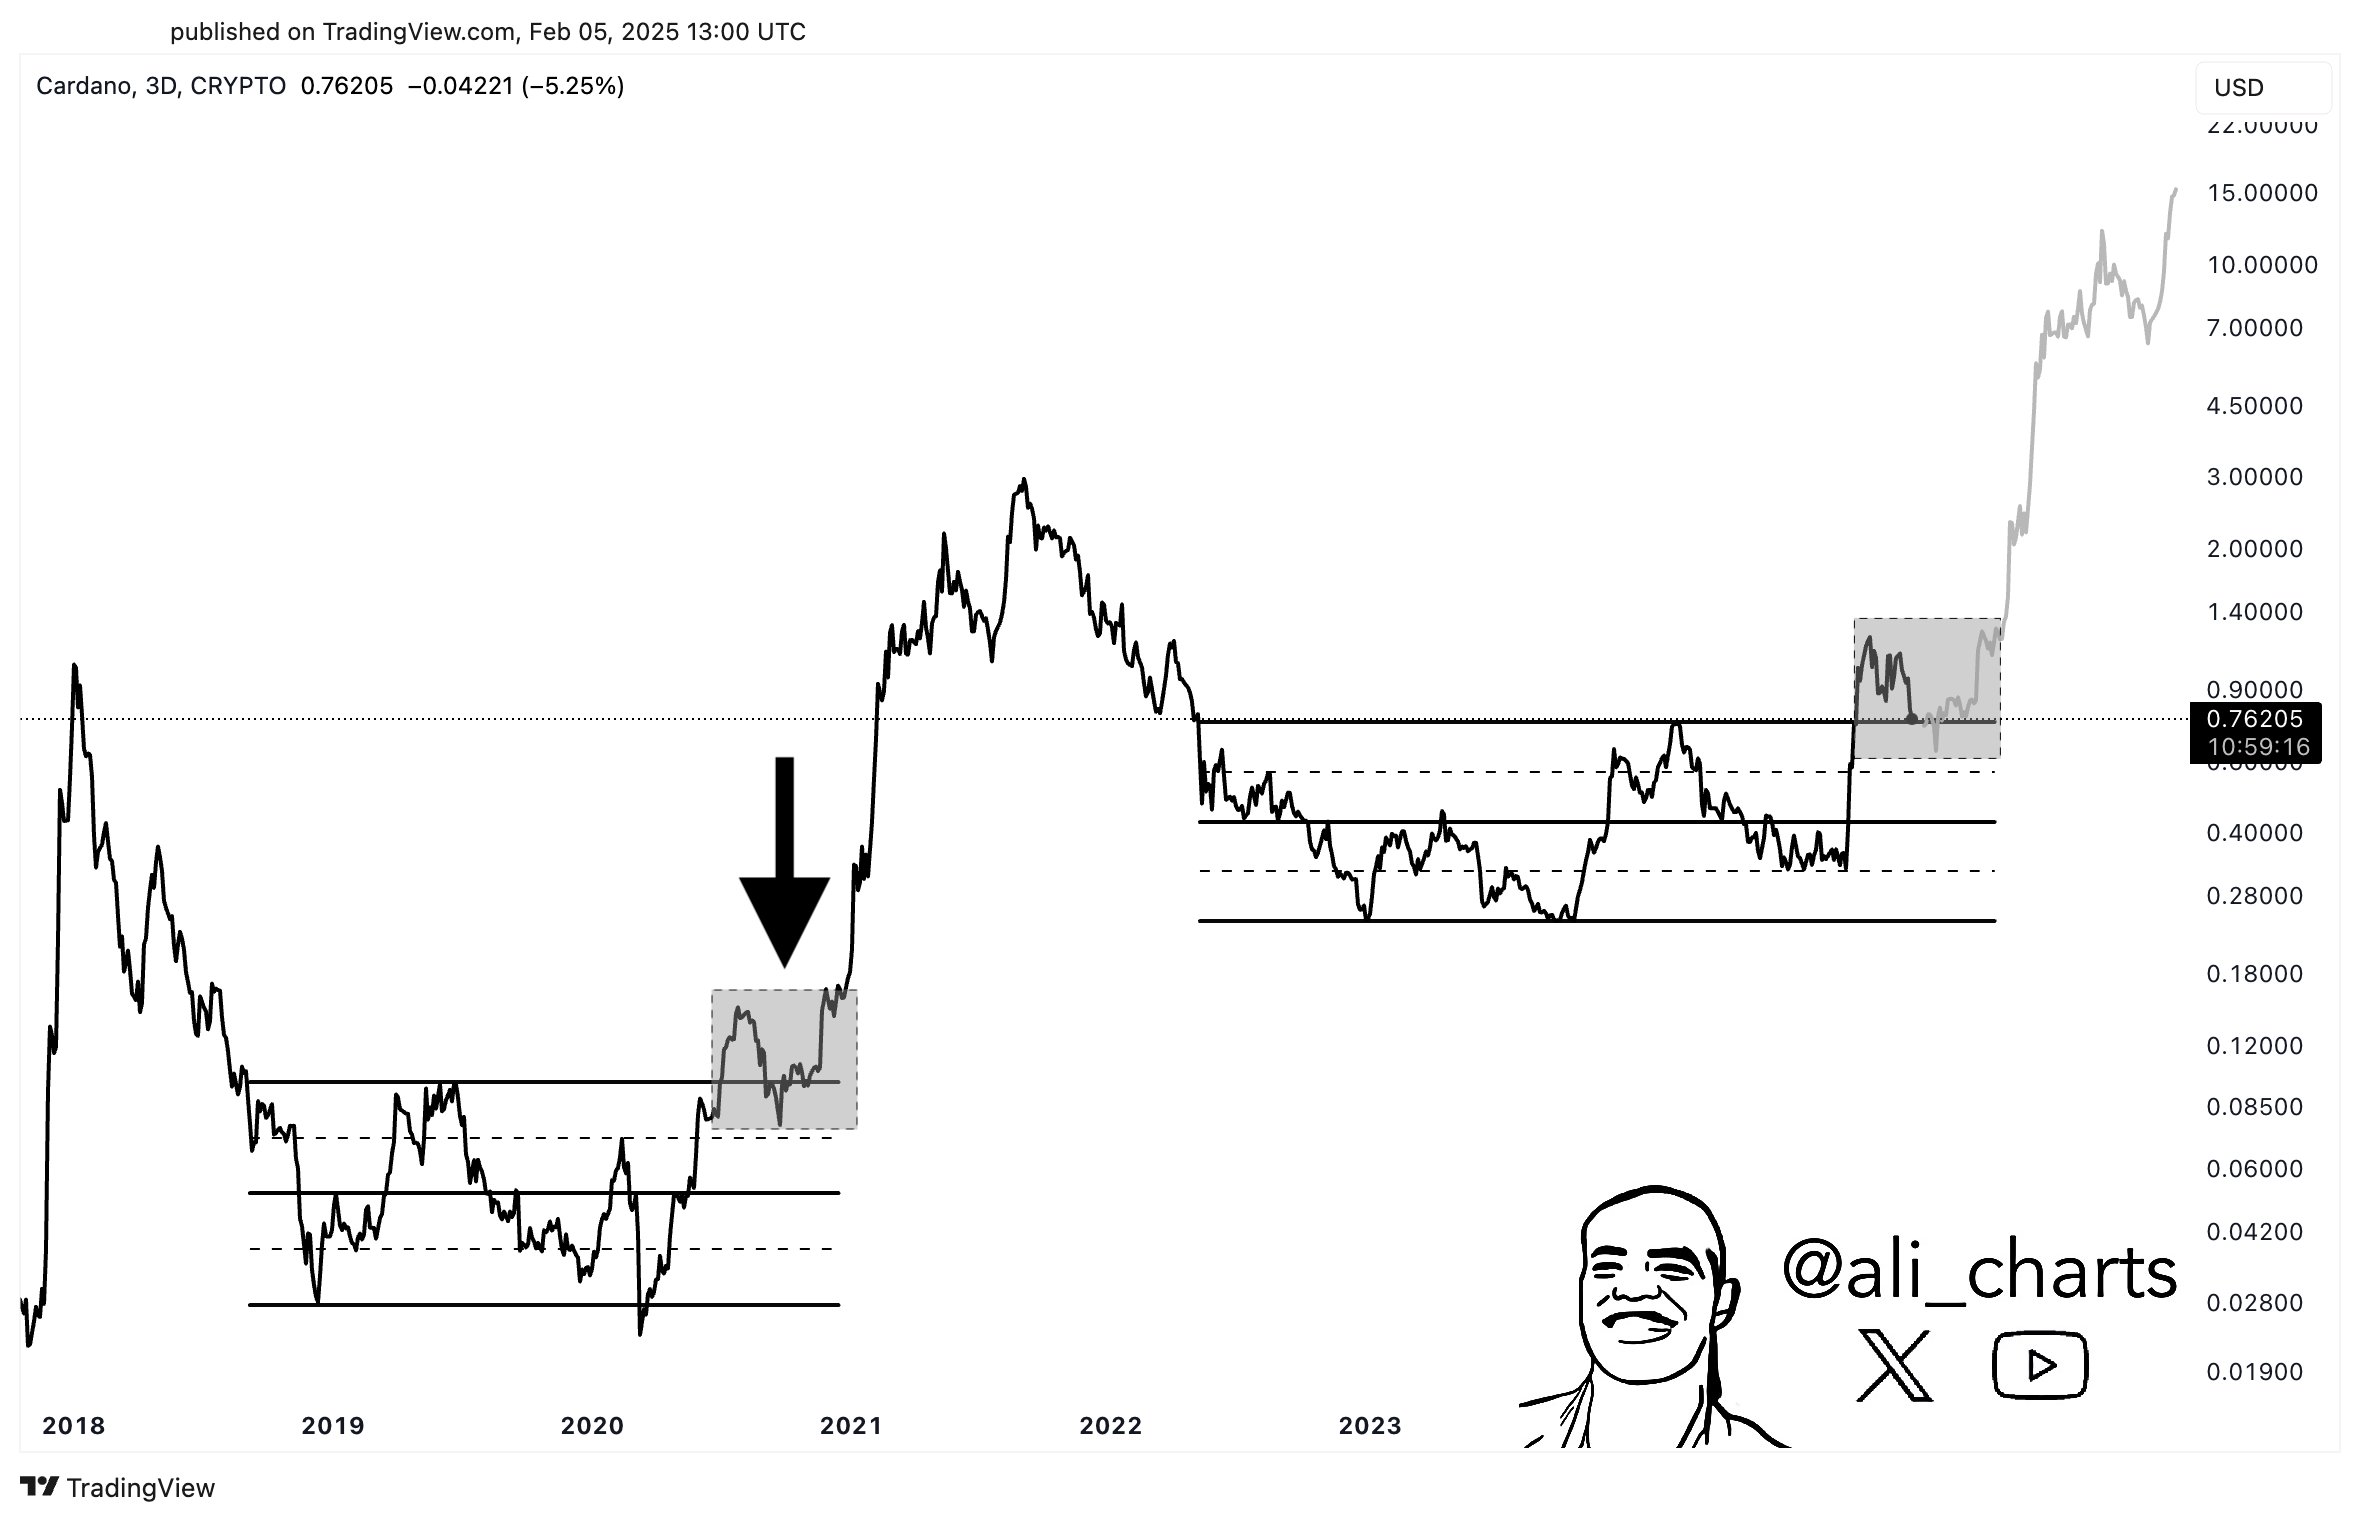
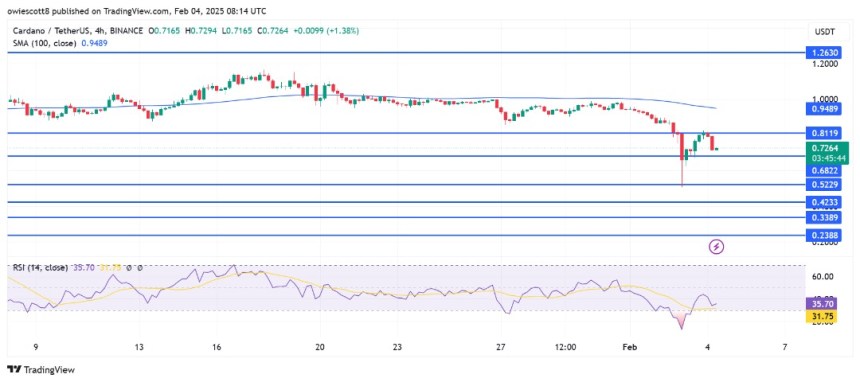
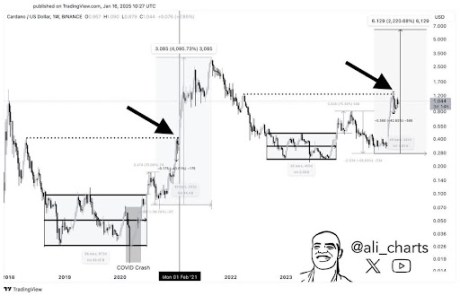
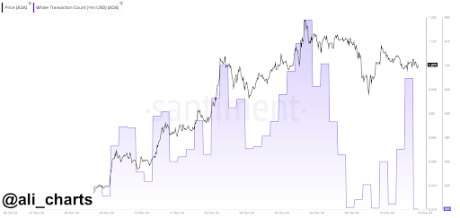
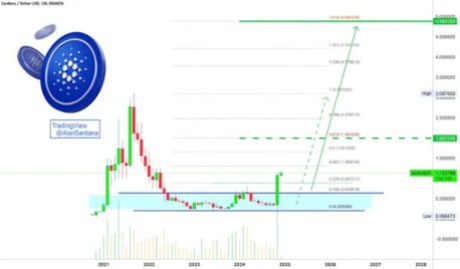
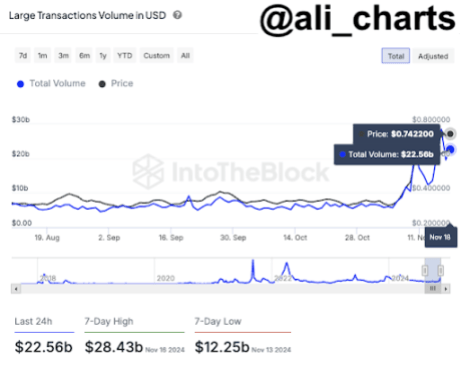
Meanwhile, crypto analyst Ali Martinez recently noted that the most critical support zone for the Cardano price is between $0.67 and $0.80. He remarked that as long as this level holds, ADA’s bull run remains intact. His accompanying chart showed that ADA could still reach its current all-time high (ATH) of $3.10 and possibly surpass this price level in this market cycle. 

At the time of writing, the Cardano price is trading at around $0.65, down over 12% in the last 24 hours, according to data from CoinMarketCap.

Cardano

ADA Charts Turn Bearish – Technical Indicators Signal More Pain Ahead

Cardano (ADA), once hailed as a top contender in the blockchain space, is now facing a challenging phase as its price charts take a sharp turn for the worse. Over the past few weeks, ADA has struggled to maintain its footing, with technical indicators increasingly pointing to the possibility of further downside

With market sentiment tilting toward caution, traders and investors are closely monitoring ADA’s next moves. Will the current bearish setup trigger a sharper decline, or can ADA stabilize and mount a comeback? 

A Breakdown Of Recent Market Movements

Recent market movements for ADA have painted a concerning picture, highlighting a distinct lack of strong bullish momentum. Despite occasional attempts to recover, the altcoin has consistently failed to reclaim crucial resistance zones, leaving the asset vulnerable to more downside.

ADA is showing signs of increasing bearish momentum as the assets have made a negative crossover below the 100-day Simple Moving Average (SMA) a key indicator that often dictates market trends. Sustained trading beneath this level reflects diminishing bullish strength and increases the likelihood of a downtrend.

ADA

Adding to the concerns, the Relative Strength Index (RSI) is trending downward below the 50% threshold, indicating a decline in buying pressure and a shift toward a bearish trajectory. This weakening demand suggests that sellers are gradually gaining control, making it harder for ADA to stage a recovery. If the RSI continues to decline toward oversold territory, it could reinforce the pessimistic outlook, increasing the risk of a deeper price correction.

ADA’s negative trend is likely to persist should ADA fail to break above the 100-day SMA and the RSI remains below the 50% threshold coupled with rising selling pressure. Typically, this scenario could lead to an extended decrease, pushing the price toward major support levels.

Key Levels To Watch: Where Can ADA Find Support?

As ADA struggles to gain upside momentum, identifying key support levels becomes crucial in assessing potential downside risks and rebound opportunities. With the price trading below the 100-day SMA and bearish sentiment prevailing, market participants are closely watching how the asset reacts to critical price zones.

The first key support to watch lies around $0.6822. If selling pressure persists, retesting this area is probable, where bulls may attempt to defend the price and prevent further declines. A bounce from this level could indicate a short-term recovery.

However, failure to hold the $0.6822 support puts the next major zone to watch at $0.5229, a historically significant level that has served as a key turning point in previous market movements. Losing this support might accelerate the bearish momentum, leading to a deeper correction.

ADA

Cardano Price Eyes Impulse Move After Bearish RSI Divergence Was Invalidated, Here’s The Target

The Cardano price is currently eyeing an impulsive move to the upside following the invalidation of a bearish Relative Strength Index (RSI) divergence. In his analysis, crypto analyst Melika Trader revealed how high ADA could rally following this bullish channel formation. 

Cardano Price Eyes Impulsive Move To The Upside

In a TradingView post, Melika Trader predicted that the Cardano price could rally to between $0.90 and $0.94 as it eyes an impulsive move to the upside. The analyst observed that ADA recently experienced a sharp rally, breaking through resistance levels and establishing a new range. This could pave the way for the rally to these price targets. 

Melika Trader further noted that a deceptive bearish RSI divergence was invalidated as the Cardano price continued its uptrend, confirming bullish momentum. Meanwhile, the analyst remarked that the ADA price is currently consolidating near the lower boundary of the parallel channel, suggesting a potential bounce from its current price level. 

Cardano

In line with this, he stated that if the Cardano price respects the channel structure, then ADA could aim for the $0.90 and $0.94 range as the next resistance. Crypto analyst Ali Martinez also provided a bullish outlook for ADA, stating that the crypto looks ready to rebound as the TD Sequential indicator has flashed a buy signal on the 4-hour chart. 

Meanwhile, crypto analyst Paul stated that the nice Fibonacci count is working for the Cardano price with .618 higher lows. The analyst’s accompanying chart showed that ADA could reclaim the psychological $1 price level and rally to as high as $2.2 on the Wave 3 impulsive move to the upside. The chart also showed that ADA could then correct to as low as $1.2 before it reaches $3 on the Wave 5 impulsive move. 

Five Reasons Why ADA Can Reach $20 In This Market Cycle

In an X post, crypto analyst Sebastian outlined five reasons the Cardano price could reach $20 in this market cycle. The first is that Cardano could become a Bitcoin DeFi player, which is bullish for the ADA price. Secondly, if Cardano’s founder Charles Hoskinson becomes part of Donald Trump’s Crypto Advisory Council. 

The crypto analyst also mentioned a Cardano ETF as one of the reasons he believes the Cardano price could reach $20 in this market cycle. Grayscale has already filed to offer one, which means that an ADA ETF could launch at some point. Meanwhile, the crypto analyst also mentioned Cardano’s potential partnership with Microsoft and the US Treasury being built on the Cardano blockchain as the fourth and fifth reasons ADA could reach $20. 

At the time of writing, the Cardano price is trading at around $0.8, up over 3% in the last 24 hours, according to data from CoinMarketCap.

Cardano

Cardano Breaking Barriers: ADA Aims For $0.8119 As Confidence Grows

Cardano is showing renewed strength as bullish momentum builds, driving ADA closer to the $0.8119 resistance level. After steady accumulation, buyers are beginning to take control, pushing the price higher and reinforcing optimism in the market. This growing confidence suggests that ADA could be on the verge of a significant breakout, provided it can overcome key resistance zones.

With technical indicators turning positive and market sentiment improving, all eyes are on whether ADA can sustain its upward momentum. A decisive move past $0.8119 may pave the way for further gains, while failure to break through might invite renewed selling pressure. As the battle between bulls and bears intensifies, the coming sessions will be crucial in determining Cardano’s next move.

Technical Analysis: Can ADA Sustain Its Upside Trajectory?

Presently, Cardano is exhibiting strong bullish momentum as it steadily climbs toward the $0.8119 resistance level, a barrier crucial for its next major move. After facing a strong rebound at the $0.6822 support mark, buying pressure has increased, pushing ADA higher as market sentiment turns optimistic. but the sustainability of this uptrend depends on key technical factors.

It is worth noting that ADA’s price steadily rises toward the 100-day Simple Moving Average (SMA), a critical level that often acts as a dynamic resistance. A successful break above this indicator could reinforce positive sentiment and pave the way for extended gains.

Cardano

Supporting this momentum, the Relative Strength Index (RSI) has recently crossed above the 50% threshold, indicating a shift from bearish to bullish market conditions. This is a significant development, as an RSI above 50% typically suggests that buying pressure outweighs selling pressure, triggering further upside potential.

Additionally, ADA’s trading volume has surged by over 10% in the last 24 hours, indicating growing market activity and increased investor interest. This uptick in volume suggests that traders are becoming more engaged, possibly fueling price movements.

As long as the RSI remains on an upward trajectory and buying pressure continues to rise alongside volume, it might strengthen ADA’s bullish outlook, increasing the likelihood of a breakout above key resistance levels.

What’s Next For Cardano? Predictions Beyond $0.8119

As Cardano continues its upward trajectory, breaking through the $0.8119 resistance level has become a focal point. But what lies beyond this key milestone? 

If buyers maintain control and push the price above this key barrier, ADA is likely to see an extended rally toward $0.8306 and $0.9077 in the near term. A decisive move above these levels can strengthen upward performances, opening the door for a test of $1.2630, a psychological milestone.

However, if Cardano struggles to surpass $0.8119, it may enter a consolidation phase or experience a pullback, with $0.6822 as the next closest support level. The bulls must hold this zone to prevent further bearish pressure. Furthermore, a break below this level could signal an extended correction, exposing ADA to deeper losses.

Cardano

Cardano Could Explode By 1,850% In ‘Monster Parabolic Rally’: Analyst

A new analysis by crypto strategist Ali Martinez suggests that Cardano (ADA) might be on the cusp of a significant upward move—potentially reaching the $15 price mark, which would represent a staggering 1,850% rally from current levels near $0.76. “If historical data is any guide, Cardano could be at the very beginning of a monster parabolic rally!” Martinez writes via X.

Cardano Fractal Analysis Points To Major Upside

Martinez’s chart (published on the 3-day timeframe) draws a parallel between Cardano’s price action in the 2018–2021 cycle and its present structure, highlighting a near-identical fractal pattern. In the previous cycle, ADA consolidated for several months within a defined horizontal range before staging a decisive breakout and retest of the upper boundary. That retest then led to a parabolic ascent spanning late 2020 into 2021.

Cardano price analysis

In the current cycle, Cardano appears to be retesting a similar support line, shown on Martinez’s chart as a horizontal band around $0.76–$0.80. If ADA were to follow the same trajectory that transpired in its last major rally, Martinez’s “monster parabolic rally” fractal implies a surge toward $15.

Immediate Support is currently at $0.76–$0.80. According to the chart, ADA is hovering just above a critical support zone—its role in the previous cycle was to provide a springboard for the bull run that followed.

The next significant resistance level is around $1.60, aligning with the upper boundary of the grey-highlighted zone on the chart. Notably this price level also aligns with the 0.5 Fibonacci retracement level drawn from the last bull market peak to the bear market bottom.

In the long term, the grey extended price line in Martinez’s chart illustrates the fractal-based projection, indicating that ADA could ultimately surge toward the $15 region. If ADA continues to follow this trajectory, the area between the 0.618 Fibonacci level ($2.00) and the 0.786 Fibonacci level ($2.47) could act as a temporary resistance zone, potentially causing a brief consolidation before the rally resumes its upward momentum.

Martinez’s view hinges on the idea that crypto markets often exhibit cyclical behaviors. In Cardano’s last major cycle, once a key horizontal level was reclaimed and successfully retested, momentum accelerated sharply, culminating in an explosive move. With the current market once again retesting a crucial support zone, Martinez posits that the table is set for another extended bull phase.

Of course, fractals are not guarantees of future performance; rather, they are visual aids that highlight how price structures can echo past market behavior. Whether Cardano follows this script depends on broader market conditions and investor sentiment. Still, the analyst’s forecast underscores why $0.76 is a level to watch.

At press time, ADA traded at $0.74.

Cardano price

Cardano Price Breaks Down From Ascending Channel, Here Are Two Ways It Could Go

A crypto analyst has confirmed a recent breakdown of the Cardano price from an Ascending Channel pattern. With key support and resistance levels now in focus, the analyst has outlined two scenarios for ADA, projecting where its price could move next. 

Cardano Price Ascending Channel: Bullish Scenario

The Cardano price has been trending within an Ascending Channel for some time, maintaining steady price momentum amidst market volatility. However, a TradingView crypto analyst, known as ‘MelikaTrader94’, has identified a recent change in the Cardano price action. The analyst highlights that the altcoin has broken below the Ascending Channel, indicating a possible shift in market sentiment.

An Ascending Channel is a distinctive chart pattern formed by two upward-sloping parallel trend lines. This pattern is typically considered a bullish continuation signal, often indicating the potential for a price reversal or deeper correction. 

Based on the TradingView analyst’s report, Cardano’s recent breakdown from its Ascending Channel could give rise to two possible scenarios. Firstly, the analyst predicts that the price of Cardano could experience a bullish surge, driven by the momentum generated from the channel breakdown. 

Cardano

The analyst shared key support and resistance levels to watch, highlighting that a breakout about resistance could confirm a bullish reversal. Interestingly, the Cardano price has already broken below the key support level of around $0.7765. The cryptocurrency is now testing lower regions to find its next critical support. 

The TradingView analyst predicts that if the price of ADA can reclaim the support level at $0.7765, a retest to higher levels may be imminent. He has set a bullish target for ADA between $0.95 and $1.00, signaling the start of a strong uptrend and a potential price discovery. He also highlighted new resistance levels between $0.7765 and $0.80 for the price.

Bearish Scenario: Further Decline Toward 0.2910 Fib?

In an alternative scenario, MelikaTrader94 has shared a bearish outlook for the Cardano price. The price of Cardano is already in a severe downturn after crashing by 23.3% over the past week. Despite this bearish performance, the TradingView analyst predicts that ADA could see further downward momentum, declining towards the 0.4836 and 0.2910 Fibonacci levels if it fails to hold current levels. 

The TradingView expert has pinpointed new support levels around $0.63, $0.48, and $0.29. These price points act as a barrier for the ADA, potentially preventing further declines. The analyst also disclosed that these support levels will serve as significant demand zones where buying pressure is set to increase.

Given the possibility of a further breakdown in the ADA’s price, the analyst has cautioned investors to closely monitor ADA’s price action, particularly around the $0.63 level, as this could confirm the cryptocurrency’s next move.

Cardano

ADA Bullish Momentum Fades As Bears Reclaim Control At $0.8119

Cardano’s (ADA) bullish momentum is losing steam as bearish pressure mounts, forcing the price to retreat from the critical $0.8119 level. After a promising attempt to push higher, ADA bulls are now struggling to maintain control, with sellers stepping in to reclaim dominance. 

The recent rejection of this key resistance suggests that downward pressure is building, raising concerns about whether the altcoin can hold its ground or slip further. With technical indicators hinting at growing weakness, the focus now is on the next support zones to determine if a deeper correction is on the horizon.

Market Sentiment Shifts: Bulls Losing Their Grip

Cardano’s market sentiment has shifted as bulls appear to be losing their grip on price action, with ADA continuing to trade below the 100-day Simple Moving Average (SMA). This key level has become a barrier that the bulls have yet to break through, indicating weakening buying pressure and increasing dominance from the bears

The failure to reclaim the 100-SMA suggests that the bullish momentum, which initially gained traction, is losing steam, and the market is starting to lean toward a bearish outlook.

ADA

Further compounding the bearish outlook is the recent movement of the Relative Strength Index (RSI), which has started to drop again before reaching the 50% threshold. Typically, this reflects that buying pressure is fading, and selling momentum is building, adding more weight to the argument that the bulls are losing control.

With the price struggling below the 100-SMA and the RSI reflecting weakening momentum, the outlook for ADA remains uncertain. Unless bulls can regain traction and break above the 100-SMA, the asset might face further declines, as bears continue to dominate the market. 

Key Support Zones In Focus As ADA Faces Bearish Pressure

After ADA’s recent struggle at the $0.8119 resistance level, the focus is shifting to crucial support zones that will be vital in determining its next move. As bearish pressure mounts and the price remains under the 100-day SMA, ADA’s ability to hold key support levels is under scrutiny.

The immediate support zone to watch is $0.6822, which has previously acted as a critical level for ADA. If the price tests and holds this zone, it could serve as a launching pad for another attempt at the upside.

However, if ADA fails to hold $0.6822, attention will turn to the next major support at $0.5229, where a more significant bounce may occur once buying pressure resurfaces. Should these support levels be breached, ADA may face a more extended period of downward movement, with $0.55 emerging as the next line of defense.

ADA

‘No Need To Panic’: Cardano (ADA) Holding Key Level Despite 14% Drop

In the past day, Cardano (ADA) has seen a 14% retrace amid the crypto market’s pullback. The cryptocurrency recently saw its price lose the $1 mark, descending below $0.90 on Monday morning. Despite the drop, some market watchers shared a positive outlook for ADA, asserting that a rebound to $1.30 could be around the corner.

Cardano Holds Key Higher Timeframe Support

Cardano, alongside the rest of the market, ended the week with a Sunday bleeding, registering seven consecutive red candles yesterday afternoon. The market pullback continued Monday morning, with Bitcoin (BTC) losing the $100,000 support for the first time in over a week.

As the market correction persisted, ADA’s price lost the $0.90 support, hovering between the $0.85-$0.89 range before recovering. Almost two weeks ago, Cardano bounced from the $0.90 support to reclaim the $1 resistance.

During this jump, the cryptocurrency surged to its 2025 high but failed to break past the $1.18 resistance level, sending ADA into a downtrend. Since then, the altcoin has failed to turn the $1 resistance into support, hovering between $0.95-$1.02.

The recent drop sent Cardano to a two-week low price and back to its end-of-year range of $0.83-$0.95. Nonetheless, the cryptocurrency’s price remains above crucial levels, as some market watchers noted.

AMCrypto highlighted that after its 5% recovery from today’s low, ADA was back to its 2-day support level. To the analyst, there is “no need to panic” if Cardano holds the $0.80 support zone.

Cardano

This zone was 2024’s Q1 high, and it has served as a key higher timeframe level, fueling the altcoin’s rally once it has been turned into support in 2021 and late 2024. AMCrypto noted that “For alts to retest major support levels during a bull run is a good sign.”

ADA To Reclaim $1 Soon?

Other analysts shared similar predictions, suggesting that Cardano’s run would be determined by its next price move. Carl Runefelt stated that “despite the market correction, ADA is still holding on to this massive bullish pennant.”

The analyst pointed out that ADA’s chart displays a 2-month bullish formation that targets $1.9 if it breaks out. However, he noted that the first target is the local top of $1.30. Runefelt explained that “if the support holds, we could see a bullish breakout at some point.”

Cardano

Meanwhile, ADA trader Sebastian considers that Cardano needs to close the day above $0.95. He stated it “would be amazing for ADA if this last daily candle turns green” and closes within the symmetrical triangle.

Previously, Sebastian noted that ADA’s “painful consolidation might soon be over,” as the cryptocurrency was “running out of space within this symmetrical triangle and might break out soon.”

To the trader, If Cardano gets “back in the chart,” then the recent breakdown will “be busted and will likely result in a pump to the upside.”

As of this writing, ADA is trading at $0.90, an 8% decline in the last 24 hours.

Cardano, ADA, ADAUSDT

Behind Cardano 15% Correction: Here’s How Much ADA Whales Sold

After a quiet start to 2025, the price of Cardano had finally begun to build on its bullish momentum from the previous year. However, the altcoin has seemingly encountered a setback, with its value falling by nearly 15% in the past week.

While this downturn could be attributed to the uncertainty and drama surrounding Donald Trump’s inauguration, it could also be linked to the movement of large investors over the past week. Here’s how the Cardano whales sold in the last seven days.

Whales Sold $180 Million Worth Of ADA Tokens Last Week

In a recent post on the X platform, prominent crypto pundit Ali Martinez shared the amount of Cardano tokens offloaded by whales in the past week. This is based on the change in the wallet holdings of those who own between 100 million and 1 billion coins.

It is worth mentioning that addresses holding tokens of such magnitude are called whales. These entities are deemed significant as other market participants often watch their movements.

Due to their substantial holdings, crypto whales often wield significant influence over the market and prices. Historically, prices of assets tend to move in the direction of these large investors (prices rise during whale accumulation and dip during whale sell-offs.)

Cardano

According to Martinez, the Cardano whales trimmed their holdings in the past week, offloading more than 180 million ADA tokens in the process. This sell-off is equivalent to around $185 million at the current market price.

While determining the exact rationale behind the latest whale movement is difficult, it is not unusual for whales to lock in profits, especially after a price surge. For context, the Cardano price jumped nearly 30% from $0.9 to as high as $1.15 between January 13 and January 17.

Furthermore, large-scale sell-offs by whales could indicate a shift in investor sentiment, especially if they expect a future price decline. They might try to cash in early to minimize or avoid losses.

Ultimately, whales shaving their holdings doesn’t often bode well for an asset (Cardano, in this case), as it increases supply in the open market. Increased supply without sufficient demand to absorb the selling could exert bearish pressure on ADA’s price.

Cardano Price At A Glance

As of this writing, the ADA token is valued at around $0.97, reflecting a decline of over 1% in the past 24 hours. According to data from CoinGecko, the altcoin is down by about 15% in the last seven days.

Cardano


Featured image from Unsplash, chart from TradingView

Cardano Price Bounces From Key Support Level, But There’s Still A Risk To Crash To $0.85

Positive price action in the past 24 hours has seen Cardano (ADA) rebounding upwards alongside the rest of the crypto market. The entire market is up by 4.3% in the past 24 hours, a trend that has seen the Cardano price also breaking above the $1 mark again.

Interestingly, Cardano’s recent break above $1 comes just hours after it bounced on a support zone around $0.92-$0.95. Despite this break, technical analysis shows that there remains a risk of a Cardano price crash in the short term.

Key Support Zone Interaction Near $0.92-$0.95

A technical analysis of Cardano’s 4-hour candlestick chart, shared by crypto analyst melikatrader94 on TradingView, highlights a compelling confluence as Cardano attempts to regain upward momentum. The analysis identifies a support zone near $0.92-$0.95, which coincides with an upward-sloping trendline that has served as support for many weeks.

Cardano’s towards the support trendline is a notable decline after its price reached a peak around $1.16 on January 17. Furthermore, this reversal comes after the cryptocurrency experienced another upswing that began when it rebounded from the same upward-sloping trendline near $0.89 on January 13. These repeated interactions with the trendline and the support zone show the volatility surrounding Cardano’s price over the past days and the ongoing battle between bullish and bearish market participants.

Cardano

Since the analysis, Cardano has rebounded again just before reaching the upward-sloping trendline and is now on an upward move. As noted by the analyst, this move might push Cardano’s price back toward its recent highs near $1.10. If this upward momentum is sustained, ADA may also continue upwards until it reaches a key resistance zone between $1.10 and $1.15. A successful breach of this level would further reinforce the bullish outlook and the continuation of a broader uptrend.

Risk Of Breakdown Toward $0.85 Or Lower For Cardano

For the bullish scenario to play out, ADA needs to hold firmly above the support zone and along the ascending trendline. This alignment suggests a continuation of the upward trend that Cardano has been following since late 2024. Secondly, Cardano bulls would need to break above the resistance level highlighted between $1.10 and $1.15 in order to flip the level into support on the long-term.

However, the intense volatility witnessed in the past few days opens up the possibility of a failure to hold above these levels. With this, the analyst warned that a decisive breakdown below the $0.92 level and the ascending trendline would invalidate the bullish outlook. Such a move could pave the way for a deeper correction and cause the Cardano price to drop toward $0.85 or even lower. 

At the time of writing, Cardano is trading at $1.02 and is up by 2% in the past 24 hours.

Cardano

Expert Bullish On Cardano: Forecasts Explosive Rally To $3 Once This Resistance Is Broken

Cardano (ADA) has struggled to maintain the bullish momentum it experienced in recent weeks, with its price still trailing approximately 67% below its all-time high of $3.09, reached during the 2021 bull run. 

Despite this significant gap, analysts believe that the potential for a robust price recovery exists in the coming weeks and months ahead of the new year.

Cardano Consolidates Above Key Moving Averages, Poised For Breakout

Trend Rider, a prominent analyst on the social media platform X (formerly Twitter), provided insights on Cardano’s current price action, noting that the price dipped below the parabolic line, indicating a cooling-off period, which occurred just above the $1 mark last week. 

However, he emphasized that the Cardano price is consolidating above its moving averages, suggesting it is preparing for a potential breakout while “shaking out weaker hands.” 

Trend Rider further anticipates a resumption of bullish momentum soon, forecasting that once the Cardano price breaks through the $1.25 resistance level, it could rapidly surge toward the $3 mark, inching closer to its previous record peak.

Adding to the optimistic outlook, analyst Ali Martinez pointed out that after experiencing a 44% correction, Cardano began its second leg up during the week of February 1, 2021. 

Given that ADA has already undergone a 43% correction recently, the analyst suggests that the next upward movement for ADA could be just two to three weeks away, with a target of $6 in sight.

Analysts Identify Key Support And Price Targets

Another analyst, AV Sebastian, also weighed in, suggesting that the price recent dip may be over, and that the Cardano price is poised to break out of a triangular pattern. He highlighted the last two candles as particularly bullish and expects a significant rally in the coming days.

In analyzing short-term price actions, several analysts noted that ADA is exhibiting a “very bullish market structure” on the daily timeframe. On the chart is observed a double bottom formation leading to a breakout and a V-shaped recovery along a descending channel. 

It is further believed that a retest of the key support zone at $1.3886 appears inevitable for ADA’s price in the near-term, which would then lead to price uptrend with a main target of $1.7748.

Further support zones have also been identified, with the $0.824 level being crucial to watch early in 2025. Holding this support could unlock significant upside potential, and analysts are eyeing May 2025 as a key timeframe for achieving targets.

Cardano

At the time of writing, ADA was trading at $1.14, up 1.13% for the 24-hour period. 

Featured image from DALL-E, chart from TradingView.com

Cardano Price Eyes Breakout To $6 After Bouncing From 43% Drawdown

The Cardano price is targeting a bullish breakout to $6 after experiencing a bounce from its initial 43% downturn. While other cryptocurrencies like XRP and Bitcoin (BTC) recorded massive gains in this bull market, Cardano (ADA) maintained a relatively muted price last year, experiencing significant volatility. Despite this, analysts remain bullish on ADA, emphasizing its potential for a substantial price recovery and a surge to new ATHs.  

Cardano Price Targets $6 ATH

Ali Martinez, a prominent crypto analyst on X (formerly Twitter), shared a bullish price prediction for Cardano, forecasting a massive surge to $6. The analyst compared the similarities in ADA’s current price movement to historical patterns. He shared two parallel price charts of Cardano depicting its price action from 2018 to 2021 and 2022 to 2025. 

Cardano price

In the left chart, ADA traded within a sideways accumulation zone, highlighted by the rectangular box, before experiencing a breakout above $0.14. Following the breakout, Cardano’s price corrected by about 43.6%, a massive decline that pushed its value below the $0.1 mark. 

As is often seen among cryptocurrencies, Cardano’s significant price crash established a solid foundation for a notable rally. After its substantial decline, the cryptocurrency initiated a significant price rally, reaching a peak of approximately $3.08. This remarkable price surge represented a gain of over 4,095%. 

In the right chart, Martinez identifies a similar sideways accumulation pattern between 2022 and 2023 of this year’s bullish cycle. Following this, Cardano broke out to reach a new price high of $0.8. After this, the altcoin underwent a 42.65%, mirroring the crash in 2021. 

Based on the historical fractal, Martinez predicts that Cardano could soon initiate its second leg up, potentially mimicking its impressive price rally in 2021 within the next two to three weeks. As a result, the analyst has set a bullish target for Cardano at above $6, marking a significant gain of 2,220.68%.

While historical patterns do not accurately predict future price movements, they can provide insights into market trends, conditions, and other factors. Martinez’s bullish prediction for the Cardano price relies on the assumption that it can repeat similar market behavior and conditions during its 2021 bull rally. 

Update On ADA Price Analysis

As mentioned earlier, the Cardano price declined severely last year despite bullish sentiment spreading to other altcoins in the market. In the last few weeks, ADA seemed to be recovering from bearish trends, as CoinMarketCap’s data showed a price increase of 16% over the past week. Cardano also experienced notable price gains in the last month, rising by over 10%. 

Although its price has reclaimed its $1 mark, ADA’s momentum seems to be fading, as the cryptocurrency has pulled back, recording a decline of 4% over the last 24 hours. 

Cardano price chart from Tradingview.com

Cardano Soars Past $1, Bucking The Broader Market Trend

In a notable show of strength amid an otherwise subdued market, Cardano (ADA) has climbed above the psychologically significant $1 mark today, January 3. Over the past 24 hours, ADA has surged by more than 11%, outpacing the mostly flat performances of other top cryptocurrencies, including Bitcoin.

Within the top 100 assets by market capitalization, only Murad-memecoin SPX6900 (SPX) has registered a higher 24-hour gain, rising 30%. Over the last seven days, ADA is up approximately 20%.

Although the jump appears to have come without any immediate catalyst, Cardano’s roadmap is poised for several notable protocol enhancements in the coming months. Among them are a Bitcoin-centric decentralized financial ecosystem and ongoing initiatives aimed at improving Cardano’s scalability, decentralization, and interoperability with other networks.

These fundamentals suggest that the current price action may be underpinned by broader optimism about the network’s evolution, although technical factors seem to be the primary driver. “ADA pushing through resistance like its butter. This momentum is truly explosive. Pay attention to key resistance levels, this one wants to go higher,” crypto analyst Satoshi Stacker (@StackerSatoshi) stated via X.

Cardano price analysis

Cardano Price Analysis

On January 1, ADA/USDT decisively broke out of a multi-week downward trendline that originated at the December 2 high near $1.32. This trendline had been tested repeatedly until late December, before finally succumbing to strong bullish momentum. Following the initial breakout, ADA briefly retreated to around $0.87, only to bounce back in a textbook retest that validated the trendline breach.

Cardano price

Supporting the bullish narrative, Fibonacci retracement levels anchored at the December 2 high ($1.32) and December 20 low ($0.76) reveal a constructive technical backdrop. The 0.236 Fib at $0.89 served as a launching pad once the trendline break was confirmed, while the 0.382 Fib ($0.97) initially rejected prices on January 2, before later giving way to further upside.

Subsequently, ADA surpassed the 0.50 Fib ($1.04), and this level may now act as immediate support on any minor pullbacks. The 0.618 Fib ($1.11) is the next key hurdle if bullish momentum persists, with the 0.786 Fib ($1.20) and the 1.0 Fib ($1.3282) potentially coming into play if the rally extends into the near-to-mid term.

From a moving averages perspective, ADA has climbed above its 20, 50, 100, and 200 exponential moving averages on the four-hour chart. Notably, the 20 and 50 EMAs have crossed above their 100 and 200 counterparts, which indicates momentum has shifted in favor of the bulls. The volume picture further supports the breakout scenario, with 24-hour trading volume up 14.94% to $1.67 billion.

A look at the Relative Strength Index (RSI) on the four-hour timeframe shows a reading of around 80, placing ADA firmly in overbought territory. This demonstrates solid buying pressure but also suggests a possibility of a short-term pullback should traders opt to take profits.

Possible Deep Correction Could Push Cardano Price To $0.43, Here’s How

The Cardano price action has continued to stall below the $1 mark in light of corrections in the past seven days. This correction, which played out across the entire crypto industry, saw Cardano break below the $1 mark again on December 18%. 

Although the broader trend suggests a possible move on the weekly timeframe towards a new all-time high (ATH), recent technical analysis on TradingView has opened up the possibility for a continued correction towards $0.43 before another strong upward move.

Current Price Movements Highlight Resistance And Cooling Period

According to technical analysis of the Cardano (ADA) price action on the weekly candlestick timeframe, the cryptocurrency has encountered notable resistance around the $1.2046 mark. This resistance has emerged after Cardano’s remarkable 205% surge from $0.4322 in late October to $1.32 in late November. 

Interestingly, this remarkable price surge saw Cardano form significant lows that serve as support levels for the price. Furthermore, the rally ended up with Cardano entering the overbought zone on the Relative Strength Index (RSI) indicator. The rally culminated in the Cardano price peaking at 82.87 on the RSI, but it has since retraced into a cooling/corrective period where buying pressure is consolidating at the time of writing.

Cardano’s consolidation has opened up outlooks as to its next direction, with substantial buying volumes observed in recent trading sessions.

Deep Correction Could Test Critical Support At $0.43

While the long-term outlook remains bullish, the analysis highlights the scenario of a deep correction that could send the Cardano price falling further in the short term. With this in mind, the analyst points to support levels that ADA may revisit in the event of a deeper correction. The first key level at $0.7683 has already proven its significance, acting as a reactionary zone in recent price movements.

Below this, $0.4322 stands as the ultimate support for the current bullish leg. What this means is that ADA has to hold above the $0.43 support level in order for a bullish trajectory to remain valid. Failure to hold above $0.43 is likely to cascade into more price declines at this point and a change into bearish outlook.

The analyst also identifies $0.3166 and $0.2427 as primary supports. These levels are Cardano’s lowest support during the previous bear market and are considered less likely to be breached in case of a longer-term decline.

Despite the potential for a deep correction, Cardano’s recent market behavior and buying trends suggest a promising long-term outlook. At the time of writing, ADA is trading at $0.912 and has increased by 2% in the past 24 hours. Once the current resistance at $1.2046 is cleared, ADA is well-positioned to challenge its $3.09 all-time high and possibly establish new highs in the current cycle.

Cardano price chart from Tradingview.com

Cardano Price Eyes Recovery Toward $2 As Million-Dollar Whale Transactions Explode On The Network

The Cardano price has recently rejected around the $1.1 price level. Notably, the past three months have been highlighted by a remarkable Cardano surge that saw it break above $1 for the first time since early 2022 and peak at $1.3 on December 3, 2024. 

Although Cardano has managed to hold above the $1 mark since then, price action in the past 24 hours has been highlighted by a 3.77% decline alongside the rest of the crypto market. However, on-chain data shows that the decline has given crypto whales another opportunity to double down on their holdings. 

Surge In Whale Transactions Reflects Continued Confidence In Cardano

A surge in whale activity on the Cardano network has brought forward another spirit of accumulation among the holder cohort, with prominent crypto analyst Ali Martinez highlighting the development on the social media platform X. Martinez noted that 687 transactions with a value of at least $1 million were recorded within the past 24 hours, pointing to increasing interest from large investors.

According to data from the on-chain analytics platform Santiment, this increase in activity is particularly notable, as the whale activity had been declining since the beginning of December. Particularly, Cardano whale activity declined from about 894 transactions on December 2, just before it reached its current 2024 peak of $1.3, to around 240 transactions between December 8 and December 12.

Whale activity is one of the biggest indicators of a network’s performance and its price outlook. Although the whale activity could also point to whales exiting their positions, current market sentiment points to accumulation instead. Furthermore, the increase in whale activity is an indication of continued confidence in the cryptocurrency’s price outlook. 

Cardano price

The Path To $2: What Lies Ahead For Cardano?

As it stands, the recent rejection at $1.11 has seen the Cardano price decline to retest the support at $1. At the time of writing, Cardano (ADA) is trading at $1.03, although there remains a risk of a further move to the downside.

However, the surge in whale transactions is one bullish signal that could send the cryptocurrency on a bounce upwards due to its counterweight action against selling pressure.

The next target remains a final break above the $2 threshold, which might still be achievable before the end of the year. Reaching the $2 price target, which is about 94% from its current price level, would require a general bullish sentiment in the wider crypto market. Interestingly, crypto analysts at Changelly have presented a more cautious outlook with a year-end ADA price of $1.15. 

Nonetheless, Cardano has more than tripled in its value in the past six weeks and it could resume this momentum anytime soon towards $2 if the bulls can continue to hold above the $1 mark. 

Cardano price chart from Tradingview.com

Cardano Next In Line After XRP? ADA Price Targets $4.88 In Epic Breakout

Cardano could be the next to surge after XRP, as the ADA price shows signs of an imminent market recovery. A crypto analyst has projected that the ADA price could experience an epic breakout to $4.88 this bull cycle. The analyst has grounded his bullish prediction on the Cardano price action, providing insights into its potential future movements based on technical analysis and current market conditions.

ADA Price Set Sights On $4.88

Alan Santana, a prominent TradingView analyst, has released a report declaring that additional price growth for Cardano is possible in this bull cycle. Sharing a detailed price chart of Cardano’s movements from 2021 to the present and its future price trajectory, the analyst projected a significant rise to $4.88 by 2026. 

Cardano price

Alan Santana revealed that the ADA price has been in a long consolidation phase for 915 days since May 2022. Surprisingly, the popular altcoin had broken out of this range earlier this month, producing the highest bullish volume ever seen. 

Cardano’s current market position indicates that it is steadily emerging from a market bottom, a development that often precedes a sustained upward trend. Alan Santana has underscored that Cardano’s recent trend shift is only the beginning, as the cryptocurrency has more room for growth in this bull cycle.

Furthermore, the analyst revealed that the primary focus of his technical chart analysis is not to predict a new all-time high or determine how far up Cardano will reach by 2025. Instead, the analysis aims to highlight Cardano’s short-term price action based on a long-term chart. 

Looking at his price chart, Alan Santana has pinpointed the 0.8875 Fibonacci level as the main support level for Cardano. This support was initially a resistance level ADA had conquered during last month’s bullish breakout. The analyst underscored that the breakout signified the highest level the ADA price had reached since May 2022.

Alan Santana has predicted that if Cardano can break above the main support at 0.8875, the market sentiment will remain “super bullish,” and additional price growth should be expected. On the other hand, if Cardano fails to break the 0.8875 level, it could drop to a secondary support level at 0.6330. 

If Cardano faces a retracement to 0.6330, the TradingView analyst has emphasized that the cryptocurrency’s overall market structure will still remain strong. These solid fundamentals have prompted the analyst to forecast a major rally to $2 for  ADA, if it can maintain a price above the 1.30 Fibonacci level.  

Will Cardano Mirror XRP Price Surge? 

Cardano is currently exhibiting potential that mirrors XRP, as the optimism surrounding the ongoing bull market could ignite a price surge for the ADA price. Since the beginning of the year, Cardano’s price has been stuck in a consolidated and declining state. This underperformance led to growing concerns among crypto members, with many labeling ADA a dead coin.

However, with new signs of a potential price rally, Cardano could achieve XRP-like gains if market sentiment shifts in its favor. As of this writing, the price of XRP has been trading at $2.6 after surging by more than 428% in the past month.  

Cardano price chart from Tradingview.com

Cardano Price Breakout: Bull Flag Rally Points To Another 50% Surge

Crypto analyst CoreCrypto has predicted that the Cardano price could enjoy a massive breakout soon enough. The analyst highlighted a bull flag-like structure that could cause Cardano to enjoy another 50% price surge. 

Cardano Price Breakout On The Horizon

In a TradingView post, CoreCrypto stated that the Cardano price is showing strong bullish momentum and is breaking out from a bull flag-like structure, with a successful retest confirming this move. The analyst added that the support is holding firm, signaling a potential rally ahead. In line with this, he stated that now is the time to long ADA and accumulate more within this range. 

For those looking to trade ADA, the analyst stated that the entry range is at the current market price and that they could add up to $0.98. Meanwhile, he set four targets for this long trade. The first target is $1.08, the second is $1.24, the third is $1.36, and the fourth is $1.49, meaning the Cardano price could enjoy up to a 50% surge from its current level. 

Meanwhile, the analyst told traders to put their stop loss at $0.92. As to why this analysis matters, CoreCrypto stated that this setup points to a decisive bullish breakout for the Cardano price. With the confirmed retest and strong support levels, the analyst said it looks like an excellent opportunity for traders. 

The Cardano price undoubtedly boasts a bullish outlook, especially since whales are actively accumulating ADA. This indicates that these investors are bullish on the crypto and expect future price increases. NewsBTC recently reported that whales bought over 130 million coins as demand for the crypto continues to skyrocket. 

IntoTheBlock data also shows that ADA’s large transactions have surged by over 5%, which paints a bullish picture for the Cardano price. Meanwhile, the ‘Net Network Growth’ metric is also bullish at the moment, meaning that investors are actively using the Cardano network. 

ADA Could Rally Up To $10 In This Bull Run

Crypto analyst Dan Gambardello has predicted that the Cardano price could rally up to $10 in this bull run. His prediction came as he discussed Cardano crossing the $1 milestone. He stated that now that ADA has crossed this price mark, it is great to see a consolidation and redistribution among holders. 

Once this consolidation and redistribution phase is over, Gambardello believes that the Cardano price can focus on its rally to $5 and then $10. In an X post, crypto analyst Sebastian said Cardano looks promising. He predicts that a price breakout could happen soon, followed by a restest and then “moon.”

Cardano price

At the time of writing, the Cardano price is trading at around $1.06, up over 5% in the last 24 hours, according to data from CoinMarketCap. 

Cardano price chart from Tradingview.com

297% Spike In Cardano Large Holder Volume Suggests ADA Price Could See Another Uptrend

The Cardano blockchain has witnessed a surge in trading activity over the past few weeks, with price data relaying this trend. Cardano’s price increase in the past 30 days has been more than impressive, with its price doubling within this period. At the time of writing, the ADA is now trading at its highest point so far in 2024 after breaking above the March high of $0.77.

Delving deeper into the forces behind this rally, on-chain metrics suggest that the surge is being driven by strong buying momentum, particularly from large ADA holders. Data from the blockchain analytics platform IntoTheBlock highlights a noteworthy spike in large transaction volume, which today reached $22.56 billion. This figure marks a 297% spike in large transaction volume in the past two weeks. 

Spike In Cardano Large Holder Volume

The surge in Cardano’s large holder activity is highlighted by the ‘Large Transactions Volume in USD’ metric provided by blockchain analytics platform IntoTheBlock. This metric captures the total value of on-chain transactions exceeding $100,000 within a 24-hour period, offering insights into the behavior of high-net-worth investors and institutional participants. 

Interstingly, the Large Transactions Volume in USD metric recently reached $28.43 billion on November 16, which is its highest so far till date. Such a figure underscores the significant interest and heightened activity on the Cardano blockchain, particularly among large-scale holders who are likely driving much of the network’s momentum.

This elevated level of activity has shown no signs of stopping, with the most recent data reporting $22.56 billion in large transactions over the past 24 hours. To provide perspective, Cardano began November with daily large transaction volumes hovering just below $6 billion before experiencing a notable uptick starting November 6.

Cardano price 1

What’s Next For ADA Price?

At the time of writing, the ADA price is trading at $0.80, up by about 6.5% in the past 24 hours. This price point marks the highest ADA price since May 2022. Not just large holders; retail holders are also in on the trend. The ADA trading volume has surged by about 29% in the past 24 hours, coming in at $2.31 billion. 

As it stands, Cardano is currently outperforming every other large market cap crypto in the past 24 hours. On-chain data and key market indicators suggest that this bullish momentum is likely to persist, with the next significant price target being a breakthrough above the psychological $1 mark.

Cardano price 2

Beyond the large transaction metric, other metrics such as the net network growth and positive momentum in the futures market suggest a very optimistic outlook.

Cardano ADA price chart from Tradingview.com

Crypto Analyst Predicts Bullish Move For Cardano Price To Cross $5, Here’s When

Crypto analyst Babenski predicted the Cardano price would enjoy a parabolic rally above $5 and revealed when this could happen. This comes amid ADA’s recent rally, which could mark the beginning of its bull run, having underperformed for most of the year. 

When The Cardano Price Could Cross $5

In a TradingView post, Babenski revealed that the Cardano price could cross $5 by 2025 year-end or the start of 2026. As part of his analysis, the analyst also noted that Cardao printed a falling wedge on the weekly chart and had broken out. With this development, he remarked that the main target for this price breakout is around $1. 

Cardano price 1

However, if the Cardano price holds above this $1 target, Babenski is confident that ADA can replicate its 2021 bull run pattern, which could spark the ADA rally to $5 and above. A rally to this price level will mark a new all-time high (ATH) for the Cardano price, whose current ATH is $3. 

The Cardano price has been one of the worst performers since the start of the year, with a 26% year-to-date (YTD) loss. However, there is a growing feeling that the ADA bull run is set to begin. For context, the ADAprice is up over 22% in the last seven days, its largest weekly gains this year. 

ADA whales also look to be bullish on the Cardano price again, as IntoTheBlock data shows a surge in whale activity. The on-chain analytics platform Santiment also revealed that there were recently 697 ADA whale transactions that involved $100,000 transfers and above, close to the highest figure recorded since the Cardano price bottomed on September 4.

Cardano price 2

Meanwhile, 37,892 unique ADA addresses made transfers in a single day, the most since September 4. In line with this, Santiment predicts that ADA might witness some retail FOMO soon enough. 

ADA Entering Its Most Bullish Phase

Crypto analyst Javon Marks also recently provided a bullish outlook for the Cardano price, stating that ADA may be entering its most bullish phase. He noted that ADA is now returning with “major strength,” proving that a price breakout could be imminent. The analyst further provided insights into how high the Cardano price could rise. 

Javon Marks stated that the first breakout target remains a price rally of over 531% to $2.7709. Meanwhile, based on historical trends in the previous bull cycles, he claimed that the Cardano price could enjoy a price rally of over 1,700% and rise to $7.77. His accompanying chart showed that any price rally to $7 will likely occur in 2025. 

At the time of writing, the ADA price is trading at around $0.43, up almost 2% in the last 24 hours, according to data from CoinMarketCap. 

Cardano price chart from Tradingview.com