Bitcoin’s Next Stop: $75,500? Analyst Reveals Historical ‘Magnet’ Level

An analyst has pointed out how the 50-week moving average (MA) of Bitcoin has historically acted as a sort of magnet for the asset’s price.

50-Week MA Is Currently Situated At $75,500 For Bitcoin

In a new post on X, analyst Ali Martinez has discussed about the 50-week MA of Bitcoin. An “MA” is a technical analysis indicator that calculates the average value of any asset’s price over a given period of time and as its name suggests, moves in time, updating its value according to the changes in the price itself.

MAs can be useful tools for studying long-term trends in an asset, as they smooth out the price curve to remove any local deviations. An MA can be taken over any window of time, but there are some particularly popular choices like the 200-day.

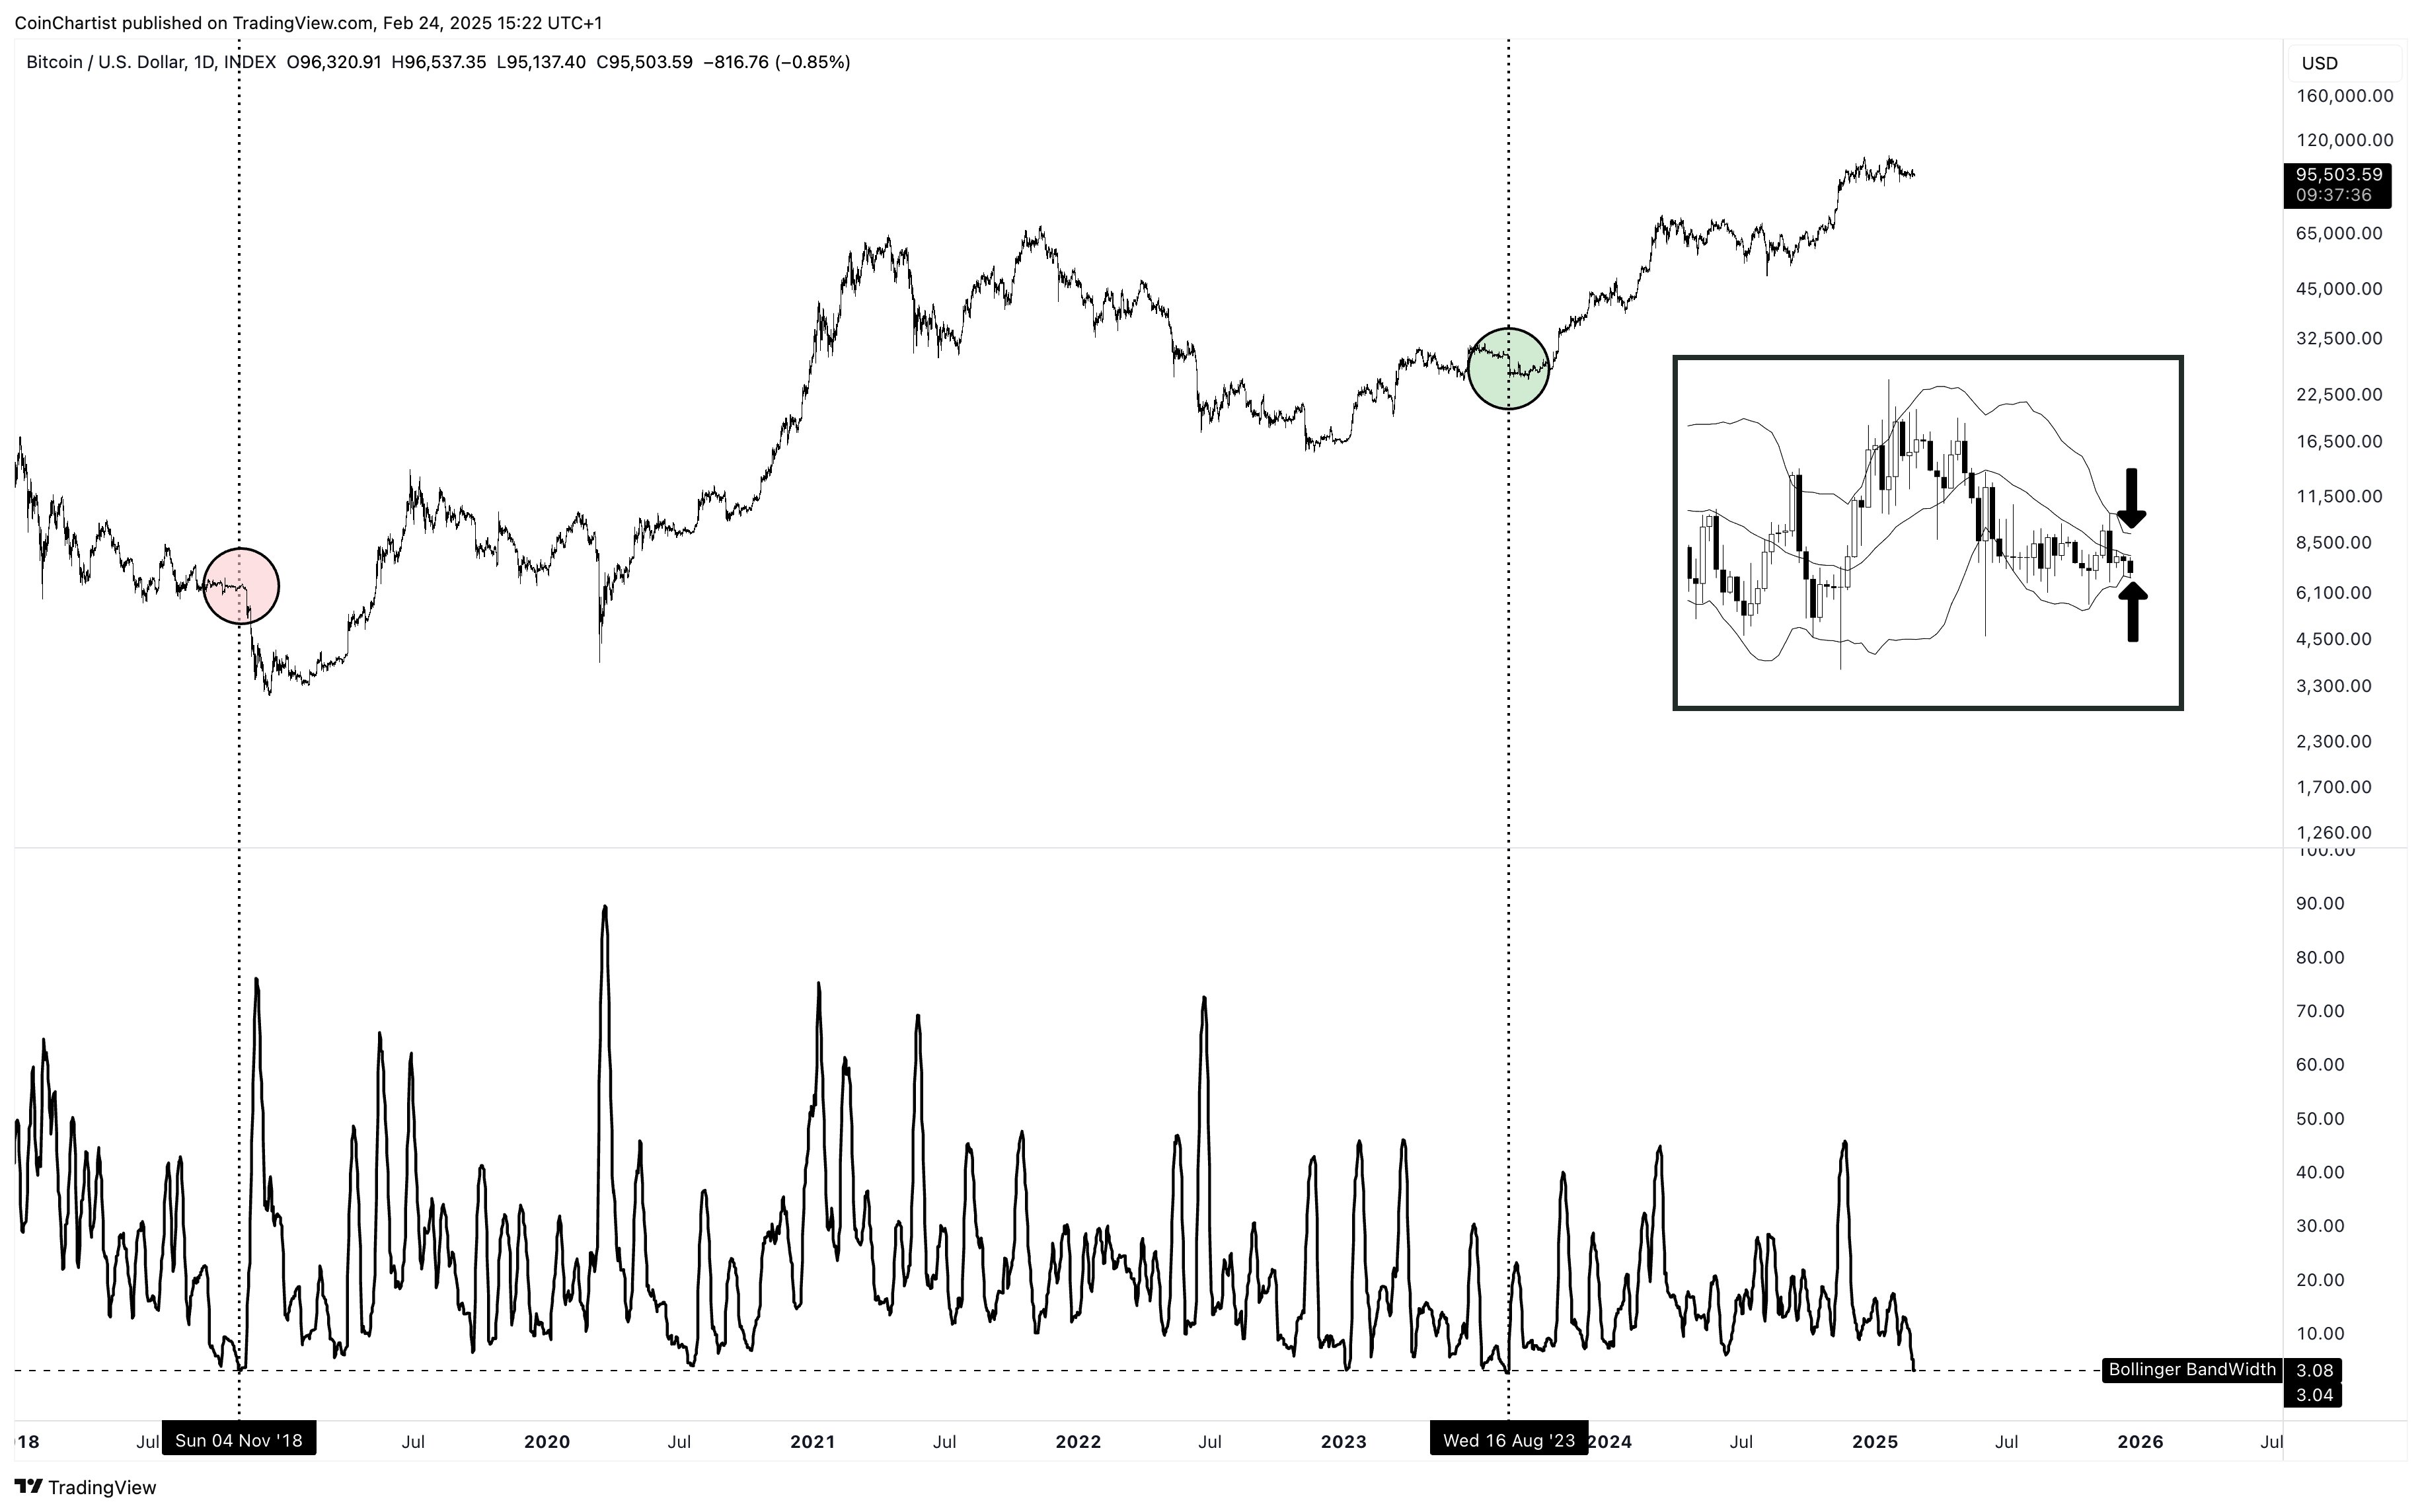
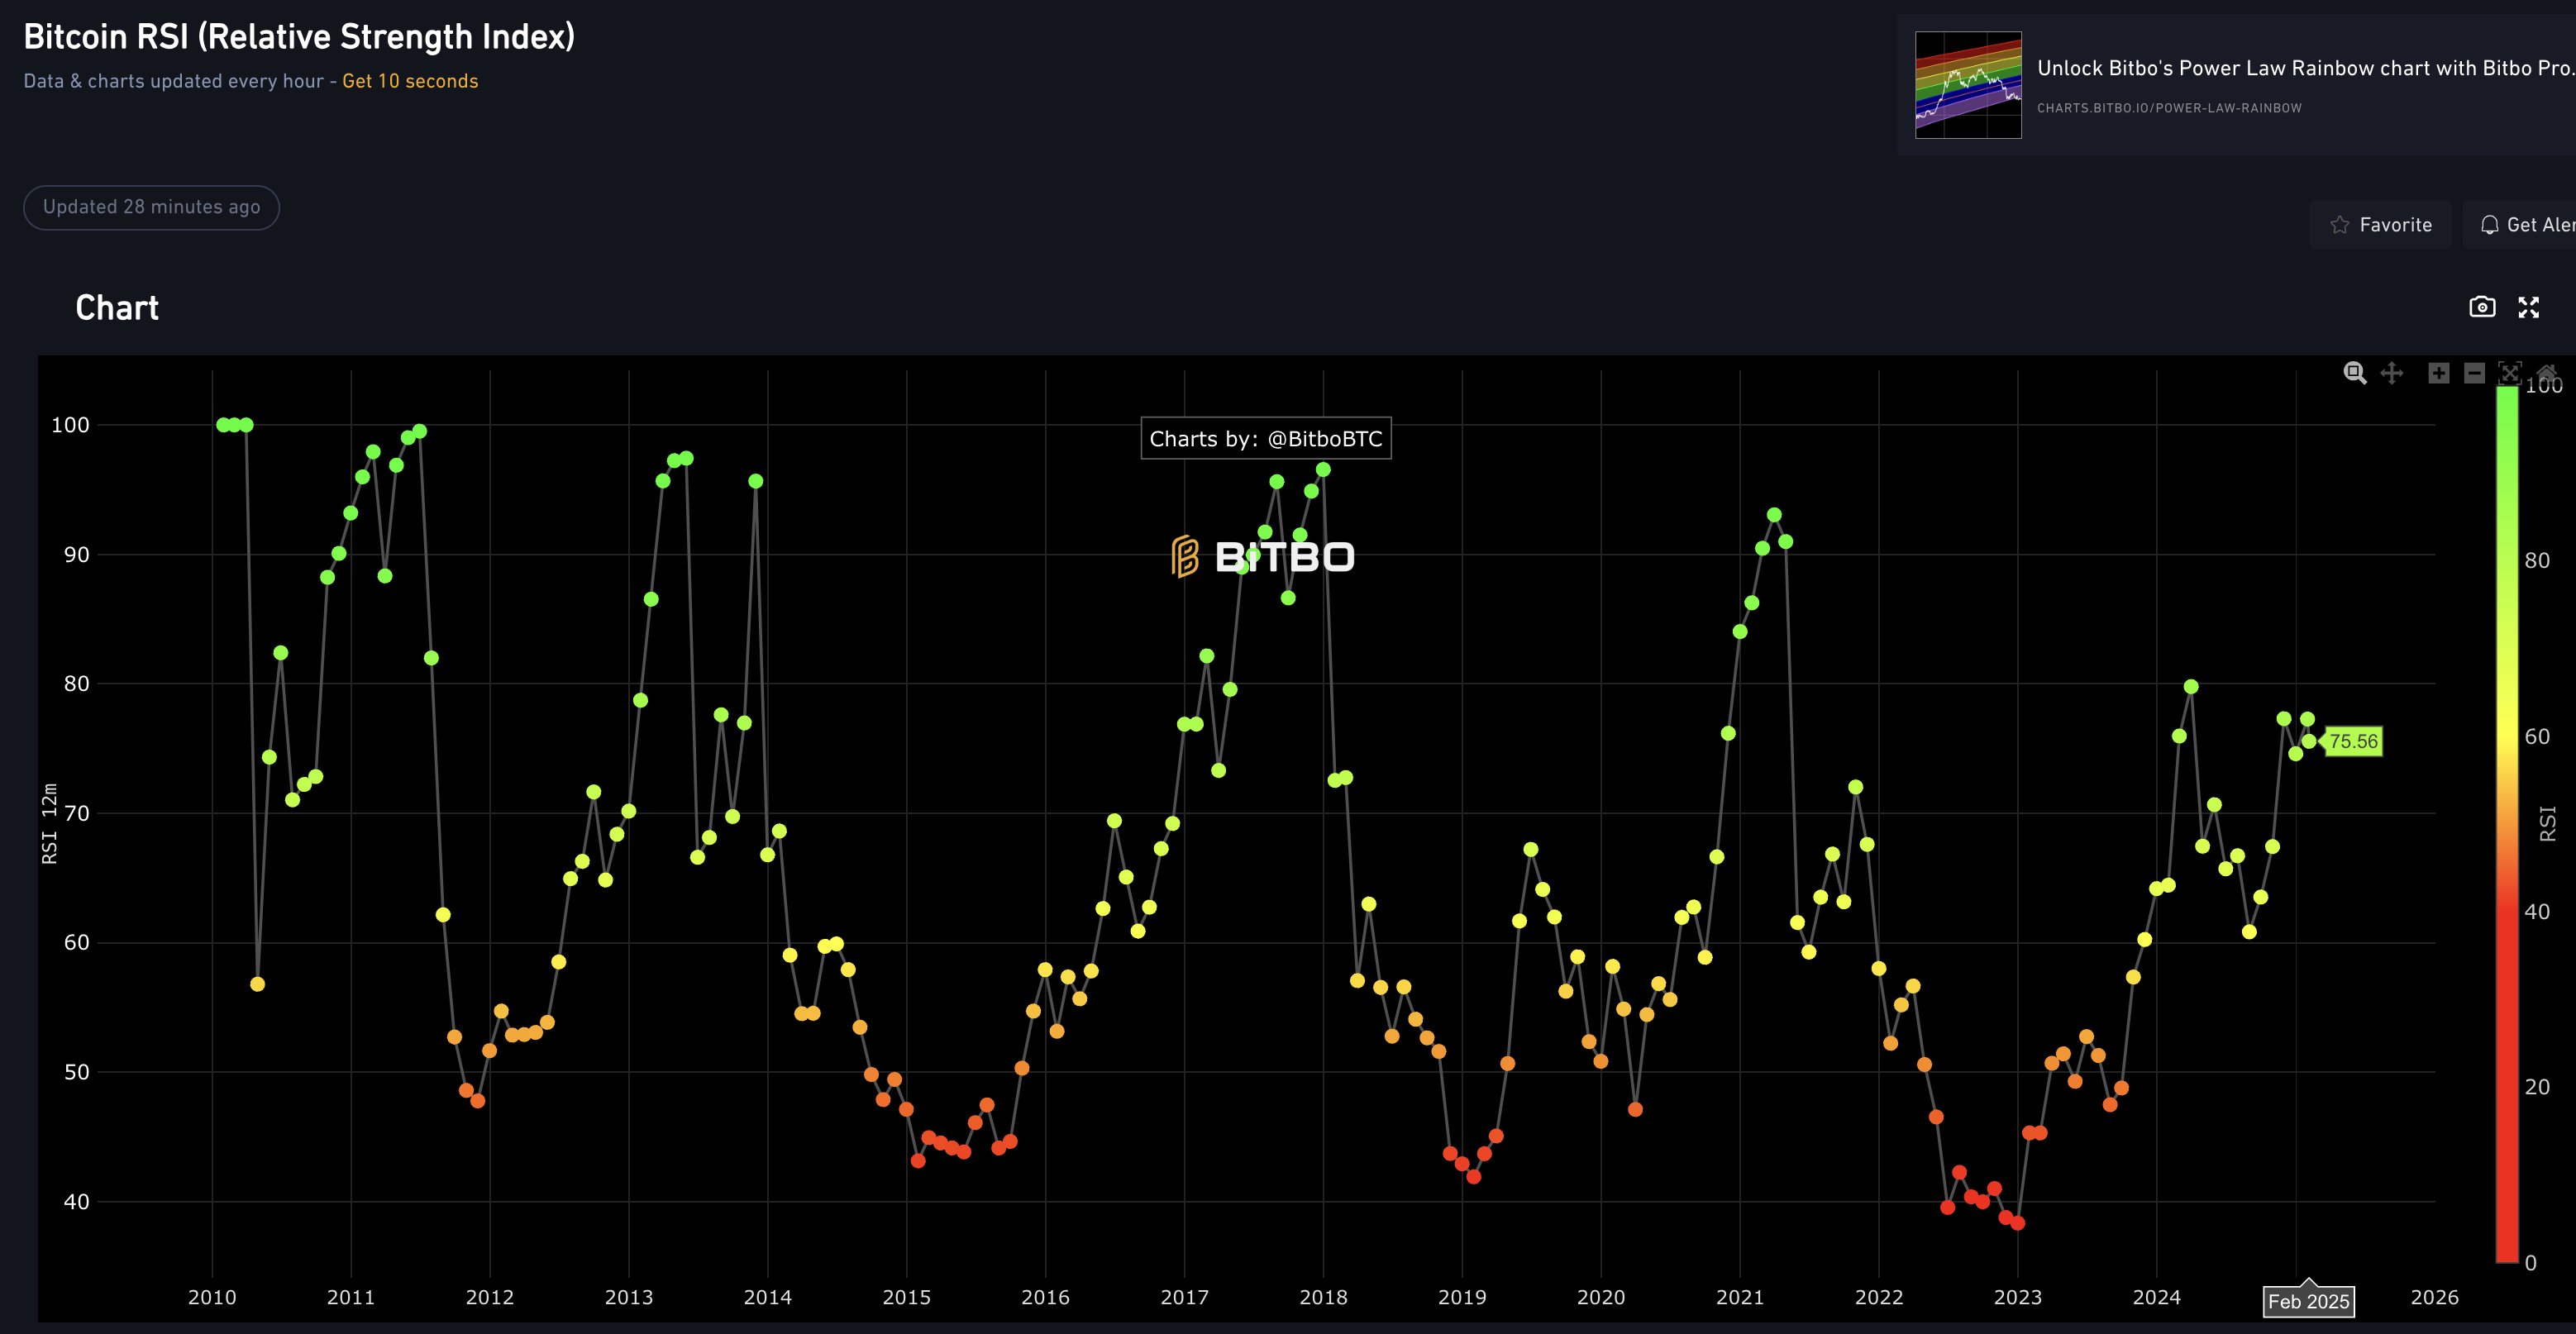
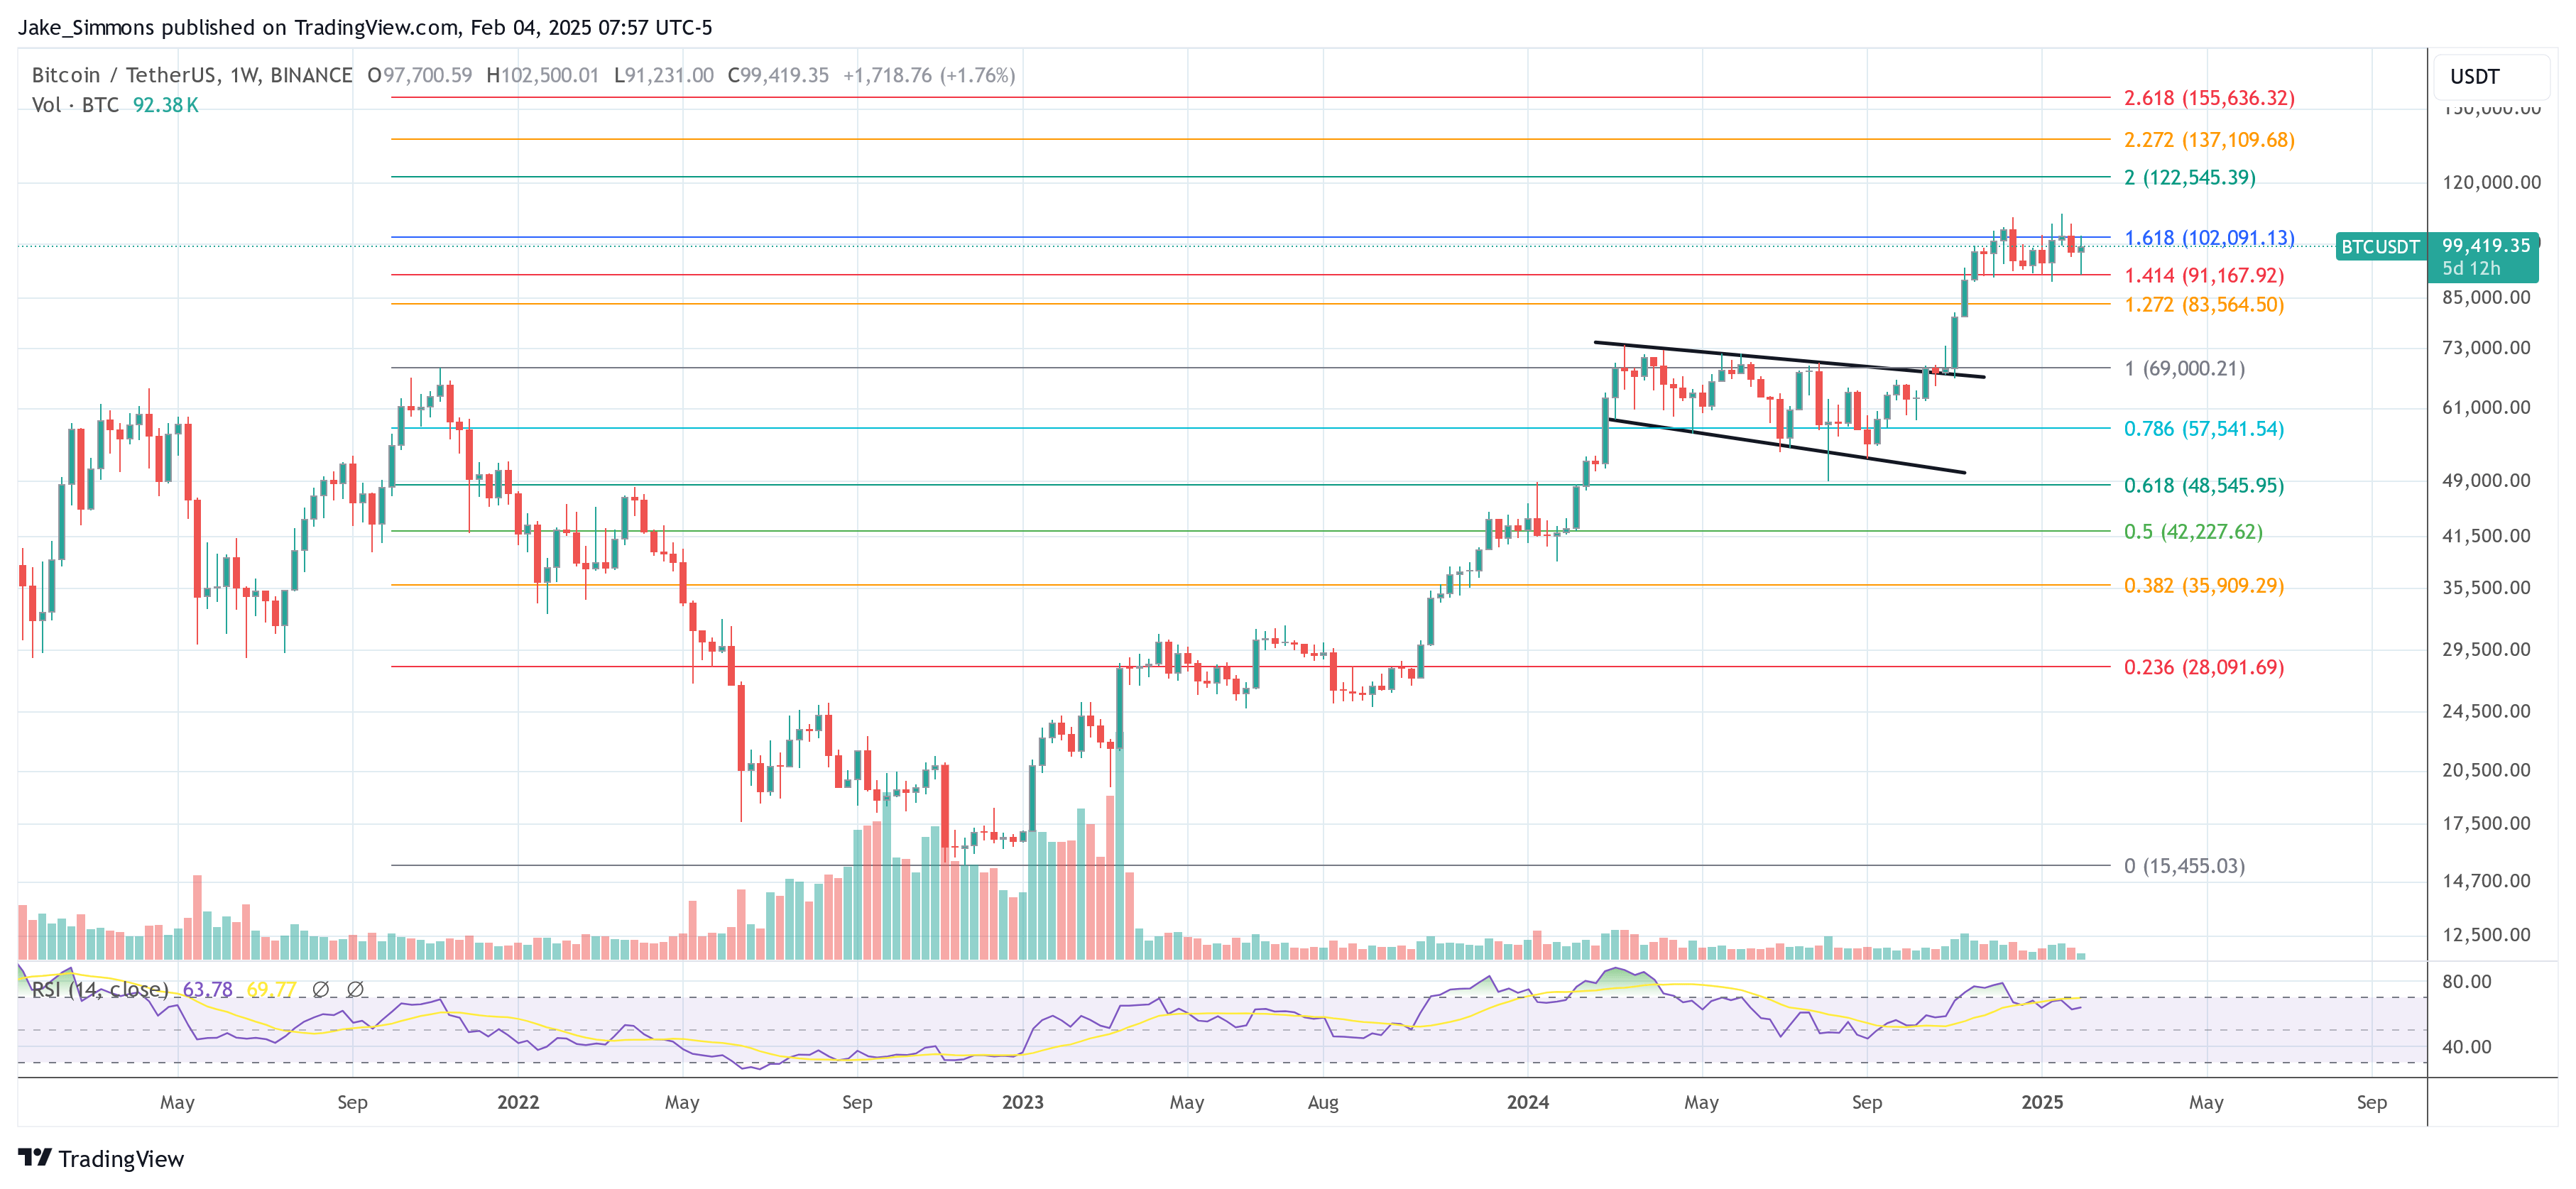
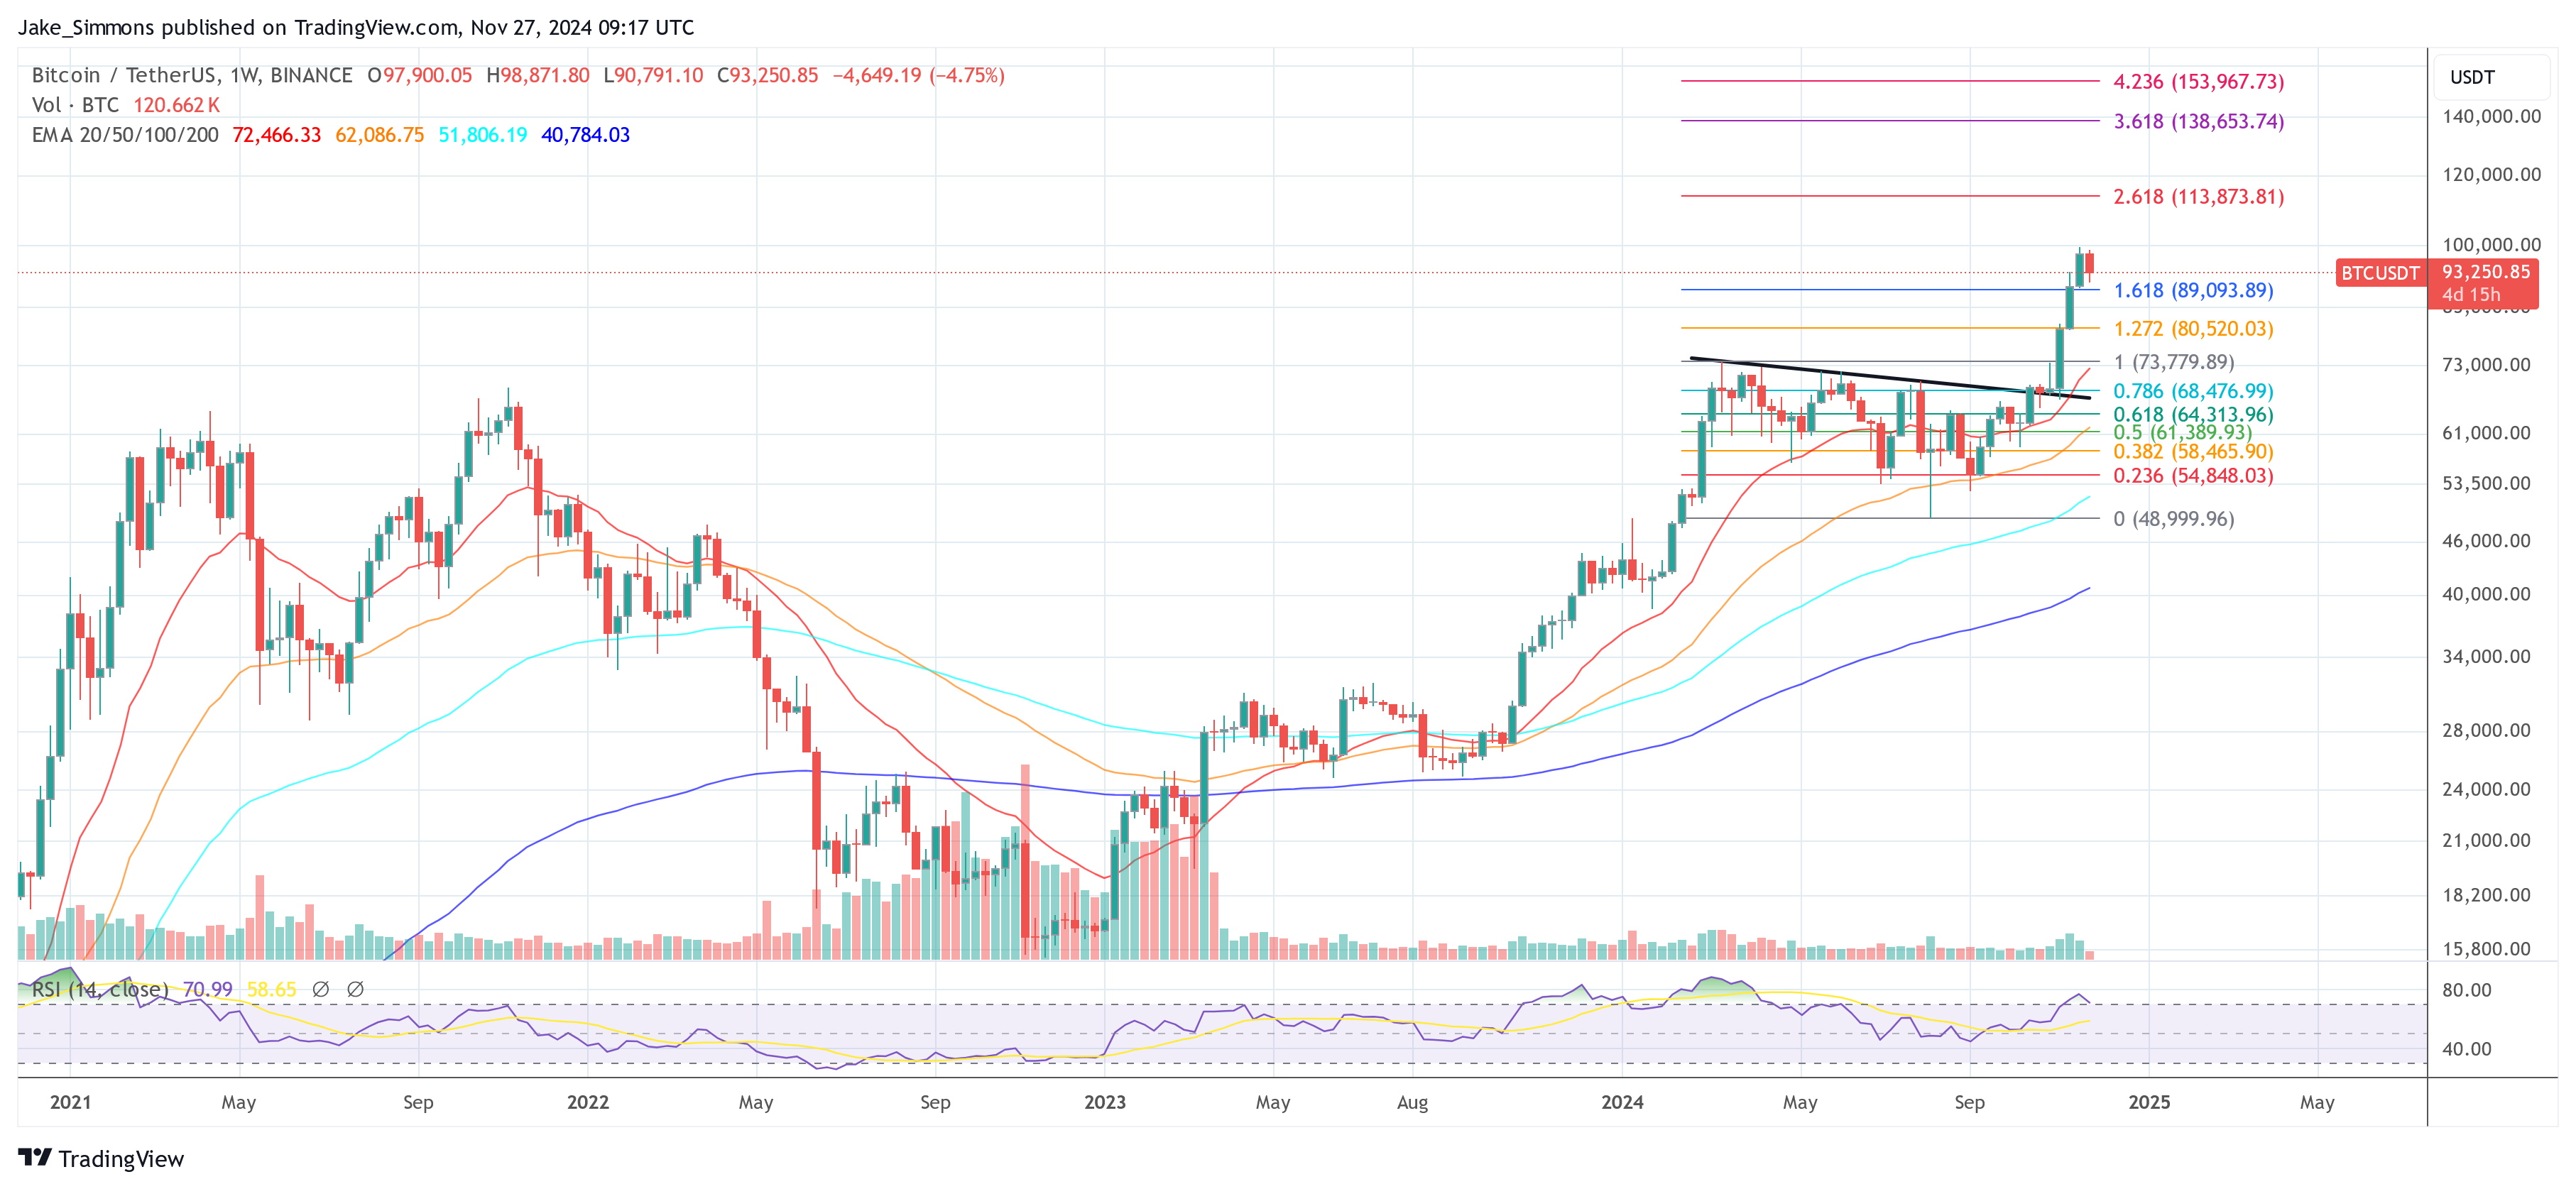
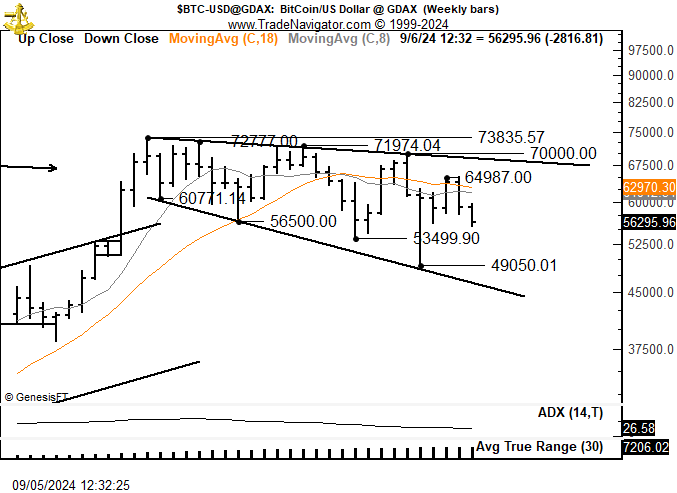
In the context of the current topic, the time-range of focus is the 50-week. Here is the chart shared by the analyst, that shows the trend in this MA for Bitcoin over the past decade or so:

Bitcoin MA

As is visible in the above graph, Bitcoin has been approaching this line following the latest market downturn. The asset has previously shown several retests of this level over the years.

“The 50-week moving average has historically acted as a magnet for Bitcoin $BTC during trend shifts,” explains Martinez. So far in the current cycle, the line has acted as support for the cryptocurrency, helping prevent the bull run from running out of steam.

At present, the 50-week MA is situated at $75,500. Given the current trajectory of the asset, it’s possible that a retest of the level may end up taking place once more. It only remains to be seen, though, whether the level would again provide support to Bitcoin, or if it would usher in the bear market.

In some other news, sentiment among the US investors has plummeted recently, as CryptoQuant founder and CEO Ki Young Ju has revealed in an X post.

Bitcoin Coinbase Premium Index

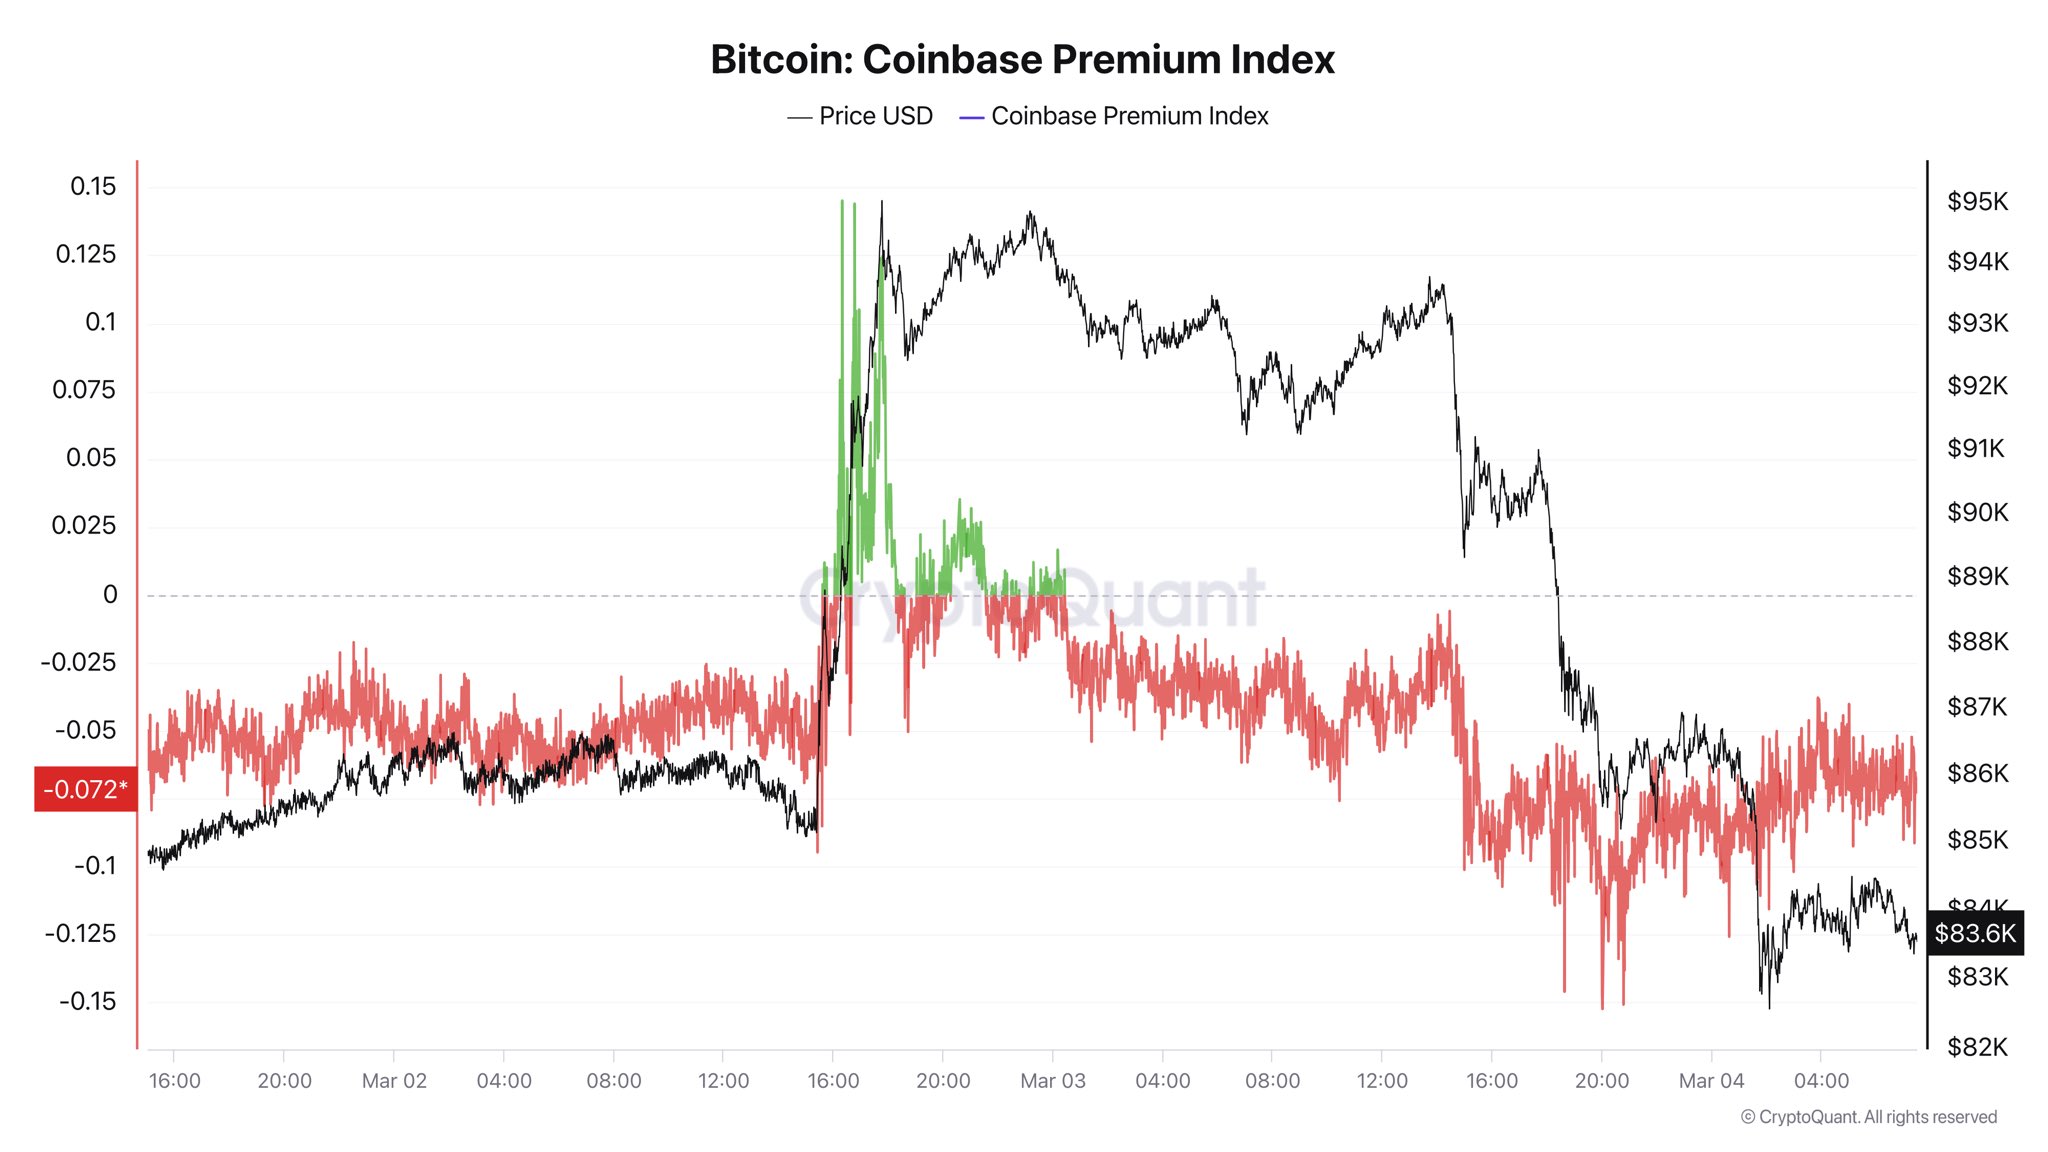
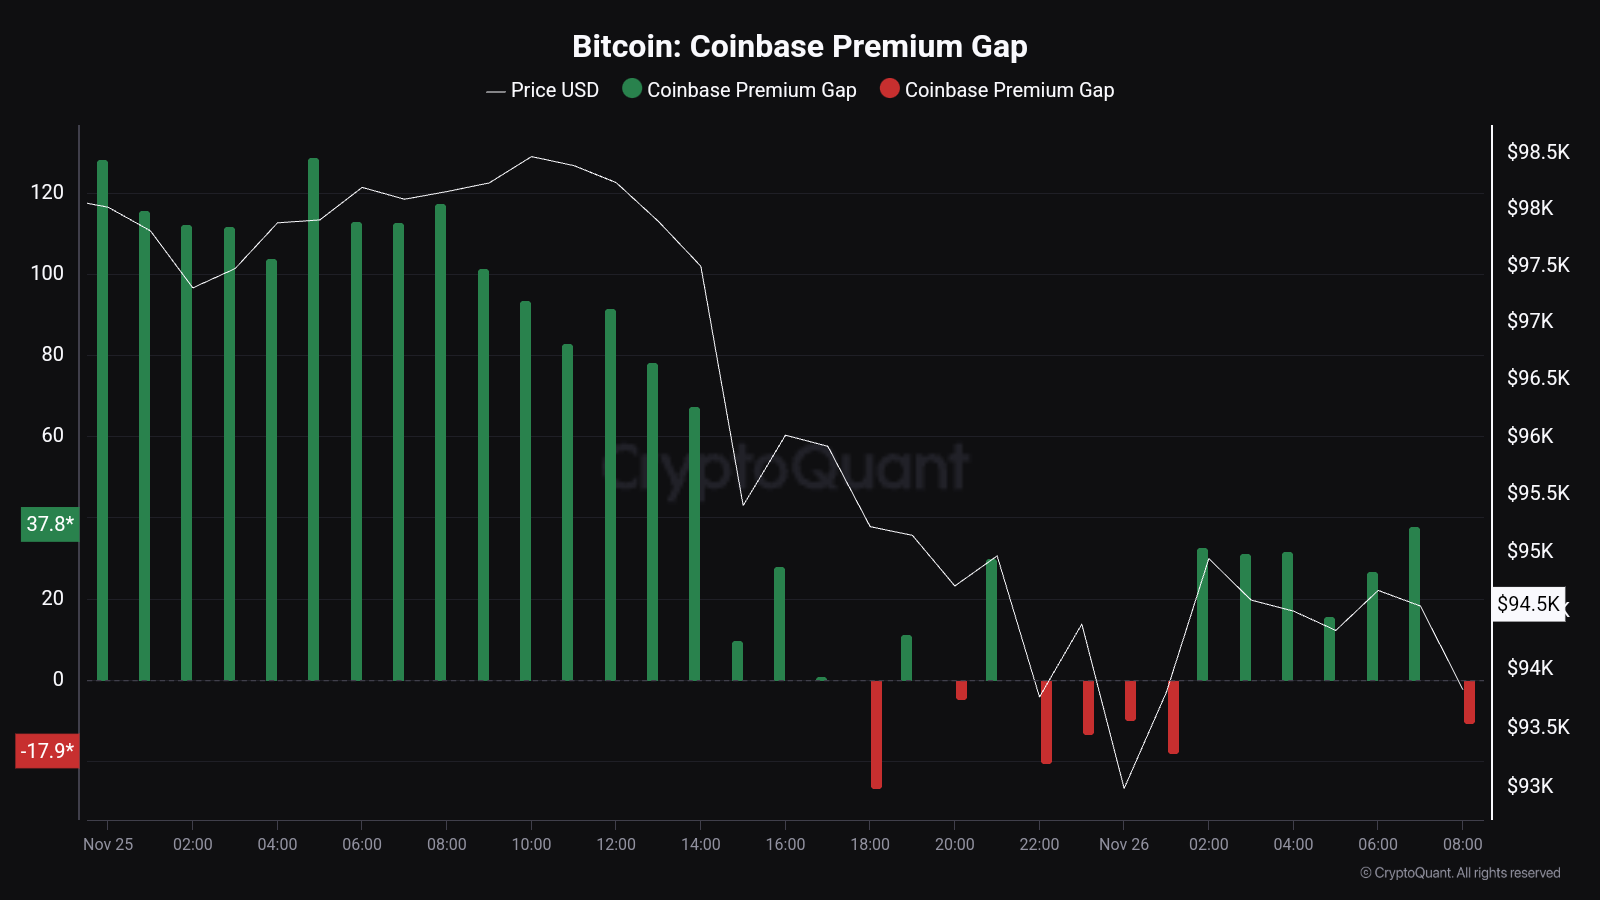
In the chart, the data of the “Coinbase Premium Index” is displayed. This metric measures the difference between the Bitcoin price listed on Coinbase (USD pair) and that on Binance (USDT pair).

The former platform is mainly used by American investors, while the latter serves a global traffic, so the indicator’s value essentially tells us about how the behavior differs between the two demographics.

During the rally earlier, the Bitcoin Coinbase Premium Index spiked to a sharp positive level, suggesting the US-based whales were buying. Shortly after, though, it dipped back into the negative and has since plunged deeper into the zone, implying users on the exchange are doing some heavy distribution.

“Bitcoin market will likely remain slow until sentiment in the U.S. improves,” notes the CryptoQuant founder.

BTC Price

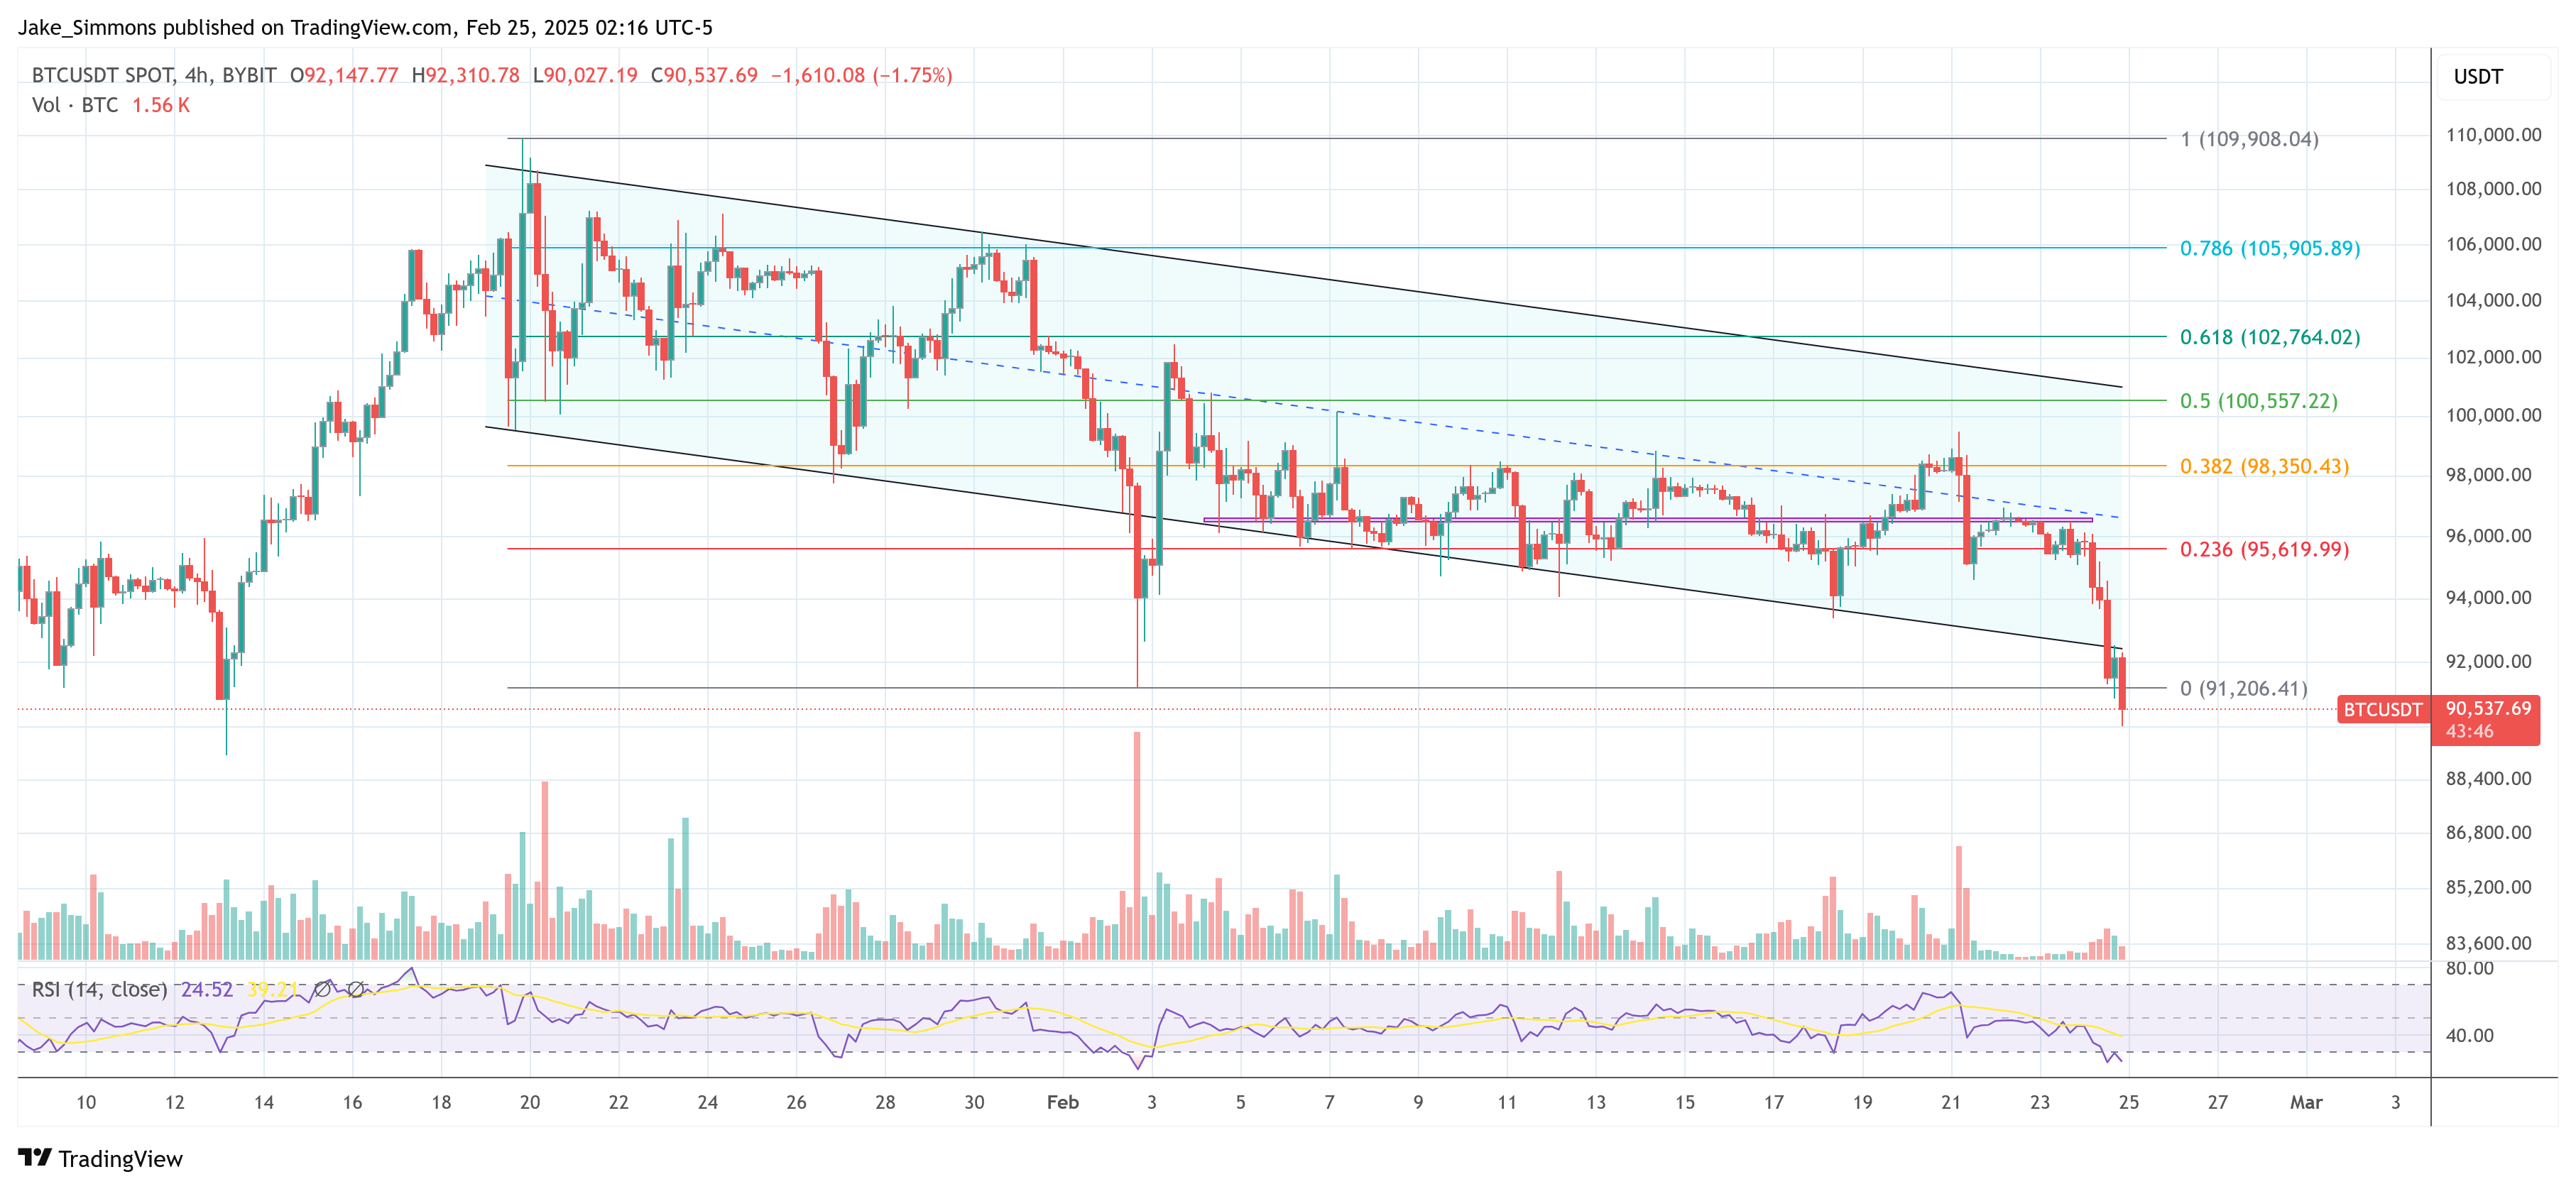
At the time of writing, Bitcoin is floating around $85,700, down more than 4% over the last 24 hours.

Bitcoin Price Chart

Bitcoin Mega Whales The Primary Sellers During Price Crash, Analytics Firm Reveals

The market intelligence platform IntoTheBlock has revealed how the largest of Bitcoin holders have been the ones applying selling pressure amid the price decline.

Bitcoin Mega Whales Have Been Reducing Their Supply Recently

In a new post on X, IntoTheBlock has discussed the latest trend in the Bitcoin supply held by the whales. The ‘whales‘ broadly refer to the entities who own more than 1,000 tokens of the cryptocurrency.

At the current exchange rate, this amount converts to a whopping $88.9 million, so the only investors who would qualify for the cohort would be the big-money ones.

In the context of the current topic, the holders of focus aren’t just any ordinary whales, but in fact the largest among them: those carrying more than 10,000 BTC ($889 million) in their balance. This group may be termed as the ‘mega whales.’

Now, here is the chart shared by the analytics firm that shows the trend in the holdings of the Bitcoin mega whales over the past week:

Bitcoin Mega Whales

As displayed in the above graph, the Bitcoin mega whales sold some of their supply during the price crash. More interesting, though, is the detail that these investors already began their selloff a few days back, a potential indication that they saw the price plunge coming.

According to IntoTheBlock, this cohort was the primary seller in this window. In fact, the analytics firm has pointed out that the rest of the groups have shown combined accumulation at the same time, meaning the smaller entities are looking at the plummet as an opportunity to buy.

In total, the mega whales have sold 25,740 BTC (almost $2.3 billion) over the last seven days. The behavior of the cohort could now be to keep an eye on in the coming days, as with the rest of the market buying, what these humongous investors do could tip the balance one way or the other for Bitcoin.

Holder balance is just one way to classify BTC cohorts. Another is through exchanges, as different platforms can host a different demographic of investors. Two exchanges in particular are generally of relevance in this type of analysis: Coinbase and Binance.

Coinbase is mainly used by entities from the US, especially large institutional traders, while Binance serves global investors. An indicator that can be used for tracking the difference in behavior between the two user bases is the Coinbase Premium Index.

This metric measures the percentage difference between the Bitcoin price listed on Coinbase (USD pair) and that on Binance (USDT pair). As CryptoQuant founder and CEO Ki Young Ju pointed out in an X post, the Coinbase Premium Index has been negative recently.

Bitcoin Coinbase Premium Index

This trend, alongside the fact that Coinbase’s spot volume dominance has shot up recently (left chart), would suggest the American whales have been the main drivers during the crash.

BTC Price

Bitcoin approached the $86,000 mark during yesterday’s dip, but the coin has since seen a rebound as its price is now trading around $88,700.

Bitcoin Price Chart

Bitcoin Loss Holders Highest Since October As BTC Crashes To $87,000

On-chain data shows the number of Bitcoin loss addresses has shot up following the cryptocurrency’s dive toward $87,000.

Bitcoin Market Delivered Shock As Price Plummets 7% In Past Day

Bitcoin had already been following a bearish trajectory during this month, but it appears the asset’s decline has seen an acceleration in the last 24 hours as its price has dropped by more than 7%.

Below is a chart that shows how the coin’s crash has looked:

Bitcoin Price Chart

From the graph, it’s visible that BTC briefly dipped under the $87,000 mark during the plummet, but it would appear it has since found a small rebound back to $89,000. Bitcoin hasn’t been alone in this bearish price action, as the rest of the digital asset sector has taken a dive inside this window as well. Most of the altcoins have also in fact printed worse returns than BTC.

Severe liquidations have occurred over at the derivatives side of the sector as a result of this sector-wide drawdown, according to data from CoinGlass. In total, liquidations have reached a whopping $1.5 billion in the last 24 hours.

Bitcoin & Crypto Liquidations

Naturally, a consequence of the crash was that BTC’s profit-loss distribution saw a notable change.

More Than 12% Of BTC Addresses Are Now Underwater

In a new post on X, the market intelligence platform IntoTheBlock has discussed about the latest trend in its Historical In/Out of the Money indicator. This metric basically tells us about the percentage breakdown of BTC addresses between profit, loss, and break-even.

The indicator works by going through the transaction history of each address on the network to see what average price it received its coins at. If this cost basis is greater than the current price, then the metric puts the address into the loss category, which the analytics firm terms as ‘out of the money.’

Similarly, holders of the opposite type fall into the profit category, or ‘in the money.’ The addresses that have an average acquisition price equal to the BTC spot value can be assumed to be just breaking even on their investment, or ‘at the money.’

Now, here is the chart for the indicator shared by IntoTheBlock, which specifically shows the trend in the Out of the Money portion of the Bitcoin userbase:

Bitcoin Loss Addresses

As displayed in the above graph, the metric has gone up alongside the latest crash in the BTC price, as a large amount of addresses have entered into a state of loss. In total, over 12% of the cryptocurrency’s holders are underwater now, which is the highest level since October of last year.

Bitcoin Crashes: Experts Warn Of 6-Month Slump To $73,000

The Bitcoin price has fallen more than -8.8% since Friday when Bybit suffered the biggest crypto hack in history. The flagship digital asset reached a peak of $99,493 late last week, only to retreat to roughly $91,500 at press time, marking a -5.5% decline since Monday. This downturn not only shatters Bitcoin’s attempt to hold above $95,000 but also places it on the verge of losing its critical 97-day trading range between $91,000 and $102,000. Notably, Bitcoin’s price has broken below the descending trend channel that has been in play since January 20.

What’s Next For Bitcoin?

Ari Paul, co-founder and Chief Investment Officer of BlockTower Capital, offered a wide-ranging view on Bitcoin’s trajectory and the broader macroeconomic environment. In a post on X, Paul touched on the potential for continued equity-market weakness and its knock-on effect on digital assets: “My market take: equities in for 4-15 months of pain (I’ll guess 9 months) tied to deflationary government policies (tariffs and mass layoffs mostly). Then it’s a political question – does Trump admin ‘capitulate’ and turn severely inflationary? In vast majority of similar cases in history the answer was yes, but just a low confidence guess to me currently.”

Shifting focus to crypto, Paul emphasized that while cryptocurrencies may still display short-term correlations with equities, they are inherently on different cyclical rhythms: “What does that mean for crypto? I continue to think crypto and equities are on different cycles rhythms, but that doesn’t negate shorter term correlation. Alts probably follow equities down at least at first (but they’re already down so much, even versus 2021 prices, they may bottom well before equities.)”

Speaking on Bitcoin, Paul predicts that the leading cryptocurrency will “act like a blend of gold and S&P 500,” adding, “if gold remains strong, than that would suggest Bitcoin would outperform losing equities, but maybe not by much. A retrace to ~$73k-$77k seems plausible, I’d probably add there.”

Despite the near-term volatility, Paul remains optimistic: “I remain confident crypto bull market not over, but this is looking increasingly different from prior cycles, maybe substantially slower and longer. My base case is that crypto will lead the general macro inflation turn, so maybe crypto bull run resumes in 6 months and equities turn up in 9. The dates given are just indications of my guesstimates. I place no weight on the exact timeframes.”

BitMEX founder Arthur Hayes also took to X to warn of an imminent downward push. He pointed to the mechanics of Bitcoin Exchange-Traded Funds (ETFs) and futures market arbitrage as potential drivers of increased selling pressure.

“Bitcoin goblin town incoming: Lots of IBIT holders are hedge funds that went long ETF short CME future to earn a yield greater than where they fund, short term US treasuries. If that basis drops as BTC falls, then these funds will sell IBIT and buy back CME futures. These funds are in profit, and given basis is close to UST yields they will unwind during US hours and realise their profit. $70,000 I see you mofo,” he writes.

Notably, research firm 10x Research published an analysis on Monday indicating that while Bitcoin ETFs—led by BlackRock’s IBIT product—have garnered $38.6 billion in net inflows since their January 2024 launch, much of this capital may not represent straightforward bets on rising BTC prices, aligning with Hayes’ statement.

“Although Bitcoin ETFs have attracted $38.6 billion in net inflows since their January 2024 launch, our analysis suggests that only $17.5 billion (44%) represents genuine long-only buying. The majority—56%—is likely tied to arbitrage strategies, where short Bitcoin futures positions offset inflows,” the firm noted.

Prior to the ongoing price drop, market technician Tony “The Bull” Severino, warned of looming volatility in Bitcoin, noting that the daily Bollinger Bands were hitting extreme tightness—a pattern often followed by a significant price swing: “A decision will be made soon in Bitcoin, as the daily Bollinger Bands reach the third-tightest reading since 2018. In late 2018, record tightness led to a 50% decline in just over a month. In mid 2023, record tightness led to a 200% climb in just over 200 days. Which direction does volatility release?”

Bitcoin Bollinger Bands reach the third-tightest reading since 2018

With Bitcoin teetering just above $91,000 and the market still reeling from Bybit’s historic hack, the market is at a pivotal juncture. Chart signals, macroeconomic uncertainties, and the unwinding of complex trading strategies collectively draw a clouded outlook with a possible extension of this slump to the $73,000–$77,000 range in the coming months.

Meanwhile, this does not have to herald the beginning of the bear market. Chris Burniske, partner at Placeholder VC, commented via X: “In the middle of 2021:BTC drew down 56%, ETH drew down 61%, SOL drew down 67%, many others 70-80%+. You can come up with all the reasons for why this cycle is different, but the mid-bull reset we’re going through isn’t unprecedented. Those calling for a full blown bear are misguided.”

At press time, BTC traded at $90,537.

Bitcoin price

Bitcoin Could End Up Plummeting To $80,100 If This Support Fails

On-chain data shows Bitcoin is currently retesting an important support level. Here’s where the next important line lies, should this level fail.

Bitcoin Is Currently Trading Around 1-Year MVRV Mean

In its latest weekly report, the on-chain analytics firm Glassnode has discussed about a Bitcoin pricing model that’s based on the Market Value to Realized Value (MVRV) Z-Score.

The MVRV Z-Score is an indicator that basically compares the market cap of BTC with its realized cap. The metric differs from the popular MVRV Ratio in that it also applies a standard deviation test to pull out the extremes from the data.

More formally, the indicator is calculated as,

the ratio between the difference of market cap and realized cap, and the standard deviation of market cap, i.e. (market cap – realized cap) / std(market cap)

The “realized cap” here refers to a capitalization model for Bitcoin that calculates the asset’s total valuation by assuming that the ‘true’ value of any token in circulation is equal to the price at which it was last moved on the blockchain.

The last transaction of any token can be assumed to be the last price at which it changed hands, so the price at its time could be considered as its current cost basis. Thus, the realized cap is a sum of the cost basis of all coins on the network.

In this context, the MVRV Z-Score essentially tells us about how the value held by the investors (that is, the market cap) compares against the capital that they initially put in (the realized cap).

Now, here is the chart for the Bitcoin Pricing Bands model based on this metric shared by the analytics firm in the report:

Bitcoin MVRV Extreme Deviation

As displayed in the above graph, the model consists of three lines related to the standard deviations (SDs) of the 1-year MVRV Z-Score. The lines being the metric’s mean, +1 SD, and -1 SD.

At present, the middle pricing band of the model is situated around $96,300. This is the same level that BTC has been falling back to as support during the recent market downturn.

As the report explains,

At the moment, price has found strong support near the Mean level. Should prices break lower, the -1σ may mark a key threshold for the bulls next major line of defensive support. Conversely, the +1σ level may act as resistance, as investors come into a meaningful amount of unrealized paper profit, and may seek to realize them into market strength.

The -1 SD support level stands at $80,100 right now, while the +1 SD resistance line is at $118,000. It now remains to be seen which of these this retest of the mean level would lead Bitcoin to.

BTC Price

At the time of writing, Bitcoin is trading around $97,400, down more than 2% over the last week.

Bitcoin Price Chart

After The Bitcoin Crash: Will It Rise Or Drop Again? 5 Key Indicators

In the aftermath of yesterday’s Bitcoin crash, market participants are closely examining whether the leading cryptocurrency by market capitalization can rebound or if it faces the prospect of another decline. In a post shared on X today, February 4, on-chain analysis data provider Lookonchain offered insights into five critical indicators that may help traders and investors assess Bitcoin’s current position.

“The price of Bitcoin experienced a major crash yesterday! Will it continue to rise or fall from the top? Let’s use 5 indicators to see if BTC is at its peak now,” Lookonchain writes.

#1 Bitcoin Rainbow Chart

Described by Lookonchain as “a long-term valuation tool that uses a logarithmic growth curve to forecast the potential future price direction of BTC,” the Rainbow Chart is often employed to gauge whether Bitcoin might be undervalued, overvalued, or approaching a key turning point. “The NEW Bitcoin Rainbow2023 Chart shows that you can still hold BTC, and BTC will top above $250K this cycle.”

While this chart suggests a bullish long-term trajectory, its forecasts are based on historical price patterns and may not account for unforeseen market events. Nonetheless, Lookonchain’s data indicates a view that Bitcoin has yet to reach its cycle peak.

Bitcoin Rainbow Chart
#2 Relative Strength Index (RSI)

The RSI is a technical indicator measuring the magnitude of recent price changes to evaluate overbought or oversold conditions.“≥ 70: BTC is overbought and may soon fall. ≤ 30: BTC is oversold and may soon increase. The current RSI is 75.56, compared with previous data, it seems that BTC has not yet reached its peak.”

An RSI reading above 70 typically raises concerns that a correction may be due. However, Lookonchain’s observation underscores their view that despite the high RSI, historical data does not necessarily confirm a definitive market top.

Relative Strength Index (RSI)
#3 200 Week Moving Average (200W MA) Heatmap

Traders often reference the 200W MA as a foundational support or resistance level. Its heatmap variation charts the broader momentum and potential inflection points over a multi-year period. “The 200 Week Moving Average Heatmap shows that the current price point is blue, which means that the price top has not been reached yet, and it is time to hold and buy.”

A “blue” reading on the heatmap implies the market has not displayed the peak signals observed in prior cycles. While some might view this as indicative of further potential upside, others remain cautious given macroeconomic uncertainties.

200 Week Moving Average Heatmap
#4 Bitcoin Cumulative Value Coin Days Destroyed (CVDD)

Coin Days Destroyed is a long-standing on-chain metric that focuses on how long BTC has remained in a particular wallet before being moved. CVDD aggregates this data over time, aiming to pinpoint points where Bitcoin might be undervalued or overvalued. “When the BTC price touches the green line, the $BTC price is undervalued and it is a good buying opportunity. The current CVDD shows that the top of $BTC does not seem to have been reached yet.”

According to Lookonchain, Bitcoin’s position relative to this metric implies that the market has not encountered the historically observed top conditions, suggesting the possibility of further upward momentum.

Cumulative Value Coin Days Destroyed (CVDD)
#5 2-Year MA Multiplier

The 2-Year Moving Average Multiplier is another widely referenced model that compares Bitcoin’s current price to its two-year moving average. “The 2-Year MA Multiplier shows that the price of $BTC is in the middle of the red and green lines. It has not touched the red line and the market has not reached the top yet.”

Historically, Bitcoin’s price nearing or surpassing the upper red line has often coincided with cycle peaks. Since Bitcoin remains in a mid-range position, the data suggests that a top may not have materialized yet—though this does not eliminate the risk of further volatility.

2-Year MA Multiplier

Overall, Lookonchain’s analysis, based on these five indicators, points to a conclusion that the top of Bitcoin’s current market cycle may remain undiscovered.

At press time, BTC traded at $99,419.

Bitcoin price

Despite Bitcoin Crash, Bitwise Predicts ‘Violent’ Surge Amid Trump’s Tariffs

The Bitcoin price sank by more than 13.5% over the weekend, dropping as low as $91,201 on Binance. The sell-off followed US President Donald Trump’s announcement of new trade tariffs. The administration levied a 25% tariff on most imports from Canada and Mexico, added a 10% tax on Chinese goods, and imposed a 10% tariff on Canadian energy resources.

While market observers typically view such aggressive moves as a negative for risk assets, one prominent voice at Bitwise Invest sees a wildly different scenario, predicting that these tariffs could fuel a “violent” long-term rally in Bitcoin.

Why Tariffs May Supercharge Bitcoin

Jeff Park, Head of Alpha Strategies at Bitwise Invest, argues that these tariffs cannot be understood simply as a response to trade imbalances but should be viewed against the broader backdrop of the so-called Triffin dilemma. In Park’s words, “The US wants to keep its ability to borrow cheaply, but rid its structural overvaluation and constant trade deficits—enter tariffs.”

He suggests that, by using tariffs as a bargaining chip, the White House is looking to create a new multi-lateral agreement—akin to a “Plaza Accord 2.0”—aimed at weakening the US dollar. This would potentially oblige foreign governments to reduce their US dollar reserves or to hold longer-duration Treasuries, thereby keeping yields low without officially enacting yield curve control.

Park also ties this strategy to the president’s personal incentives. He believes Trump’s “#1 goal” is to drive down the 10-year Treasury yield, in part because cheaper long-term financing would benefit real estate markets. According to Park, such a push for lower yields dovetails with a deliberate move to weaken the dollar—two conditions that, in his view, create a perfect environment for Bitcoin to flourish.

“The asset to own therefore is Bitcoin. In a world of weaker dollar and weaker US rates, something broken pundits will tell you is impossible (because they can’t model statecraft), risk assets in the US will fly through the roof beyond your wildest imagination, for it is likely a giant tax cut will have to accompany the higher costs borne by the loss of comparative advantage,” Park writes.

His thesis is that the “online and onchain” nature of today’s economy will funnel frustrated citizens across the globe toward alternative stores of value—namely Bitcoin. He believes both sides of any prolonged tariff war will discover that BTC offers a refuge from the fallout, leading to what he describes as a much higher price trajectory.

“So while both sides of the trade imbalance equation will want Bitcoin for two different reasons, the end result is the same: higher, violently faster—for we are at war. TLDR: You simply have not yet grasped how amazing a sustained tariff war is going to be for Bitcoin in the long run,” Park claims.

Tariffs As A Risk Asset Drag

Not all analysts share Park’s optimism. Alex Krüger, an economist and trader from Argentina, disagrees with the notion that tariffs of this magnitude inherently favor Bitcoin. He warned that “Bitcoin is mainly a risk asset.”

He added: Tariffs this aggressive are very negative for risk assets. And the economy will take a hit. The tariffs announced are considerably worse than what was expected by the market, as gradual tariffs or delayed implementation were seen as alternatives. So the S&P futures will open deeply in the red tonight and flush.”

In Krüger’s view, Bitcoin remains a high-beta asset often correlated with equity markets. When a major macro shock—like a sudden hike in tariffs—hits, investors typically rotate into safe havens rather than riskier holdings such as stocks or cryptocurrencies. He pointed out that the sell-off in crypto over the weekend might be explained by the market reacting to an “unexpectedly harsh” tariff announcement.

“The hope for crypto is that it has already dropped a lot in anticipation,” Krüger observed, hinting that digital assets may find a local bottom if the initial shock has been fully absorbed. However, he emphasized the persistent uncertainty ahead, including the possibility of retaliation by targeted nations. A swift resolution to the trade dispute could trigger a bounce, whereas an escalation could deepen market jitters.

Krüger also cautioned that the Federal Reserve might turn hawkish if tariffs stoke inflation—an outcome that rarely bodes well for high-growth or risk-prone assets. Still, he hasn’t ruled out fresh all-time highs in equities later this year:

“I still don’t think the cycle top is in, and expect equity indices to print ATHs later in the year. But the probability of being wrong has increased. Particularly on the latter. As I said a week ago, I’ve taken my long-term hat off. This is a traders’ market.”

At press time, BTC traded at $94,000.

Bitcoin price

Trader Greed Strikes Again: Bitcoin Corrects To $102,000 After FOMO Spike

Bitcoin has observed a retrace from its new all-time high after users on the major social media platforms displayed overexcitement.

Bitcoin FOMO On Social Media Spiked During Recent Rally

In a new post on X, the analytics firm Santiment has talked about how social media reacted to the recent Bitcoin rally to the new all-time high. Whenever volatility emerges in the market, users on these platforms start sharing about which levels they think the price would visit next. This latest one was naturally no exception.

To gauge how many users called for which price levels, the analytics firm has made use of the “Social Volume” indicator. This metric keeps track of the total number of posts/threads/messages on the major social media platforms that are making at least one mention of a given term or topic.

The reason that the indicator doesn’t simply count up the mentions themselves is so that a few outlier posts containing thousands of mentions don’t skew the data by themselves. In order to narrow the data down to posts related to Bitcoin price calls, Santiment has entered certain price levels alongside BTC-related terms into the Social Volume.

The analytics firm has divided the price targets into three groups: levels above the current one, levels below it, and levels around it.

Below is a chart showing the trend in the Bitcoin Social Volume for these over the past month and a half:

Bitcoin Social Volume

As is visible in the graph, the combined Bitcoin Social Volume for the prices between $110,000 and $119,000 witnessed a large spike alongside the price rally, suggesting that the social media users were optimistic about the cryptocurrency continuing its bullish momentum and exploring the higher levels next.

The bets of these users have failed so far, though, as the asset has seen a retrace since their mentions have appeared. From the chart, it’s apparent that this is actually a trend that BTC has shown in the past as well.

“Prices historically move the opposite direction of the crowd’s expectation, particularly in the short-term,” notes Santiment. “Being a contrarian continues to be a profitable way to swing trade, and an easy way to do so is to look at mentions of lower prices, current prices, and higher prices.”

Just like how market hype leads to tops for Bitcoin, pessimism can result in bottoms. The price recovery run during the past week kicked off after social media users started expecting a bearish outcome.

Thus, the Social Volume of these terms could be to keep an eye on in the coming days, as another spike in posts mentioning the lower price targets could end up being a positive sign for the rally.

BTC Price

At the time of writing, Bitcoin is floating around $104,500, up almost 9% in the last seven days.

Bitcoin Price Chart

Crypto Liquidations Near $690 Million As Bitcoin, Ethereum Crash

Data shows the cryptocurrency derivatives market has suffered a high amount of liquidations in the past day as Bitcoin and other assets have crashed.

Bitcoin, Ethereum Saw Notable Plunges During Past Day

The last 24 hours have been red for digital assets, with a bulk of the market observing a drawdown of more than 5%. Bitcoin has been no exception, as its price has slipped under the $95,000 level.

Bitcoin Price Chart

It was only a couple of days back that the asset had shown a sharp recovery above the $102,000 mark. The steep crash since then would suggest the investors didn’t believe the rally would have legs, so they decided to take their profits while they could.

Ethereum, the second largest cryptocurrency by market cap, has had it even worse than Bitcoin, with its price coming down to $3,350 after a drop of almost 8% during the past day.

Ethereum Price Chart

With its plunge, Ethereum has basically retraced all the bullish momentum that had come with this new year of 2025. Bitcoin still retains some of its gains, but if the current trajectory continues, it wouldn’t be long before it meets the same fate as well.

With all the carnage that the digital asset sector has seen, it would be expected that the derivatives side of the market would likewise have gone through some chaos.

Crypto Longs Have Just Taken A Massive Beating

According to data from CoinGlass, a mass amount of liquidations have piled up on derivatives exchanges during the past day. “Liquidation” refers to the forceful closure that any open contract undergoes after it has amassed losses of a certain degree (the exact percentage of which may differ between platforms).

Below is a table that breaks down the relevant numbers related to the latest cryptocurrency liquidations.

Bitcoin & Crypto Liquidations

As is visible, a total of $689 million in contracts have been flushed in the last 24 hours. Out of these, over $609 million of the positions involved were long ones. This means an overwhelming 88% of the liquidations affected the traders betting on a bullish outcome for the market.

Given the crash that the cryptocurrency sector has gone through during this window, it’s not exactly a surprise to see this disparity between long and short liquidations.

In terms of the contributions to the squeeze by the individual symbols, Bitcoin has interestingly not topped the charts this time around. Instead, Ethereum has been king with almost $152 million in liquidations.

Bitcoin & Other Cryptos

The fact that Ethereum’s drawdown has been more significant than Bitcoin’s has part to play in this, but it may not be the full story. It’s possible that the trend is an indication that the speculative interest around ETH has been particularly pronounced recently.

Bitcoin Could Crash To $70,000, Warn Leading Financial Analysts

The recent rejection at the $100,000 has prompted a wave of warnings from leading financial analysts, who caution that Bitcoin could be poised for a significant pullback toward the $70,000 region or, in some cases, even $60,000. Ali Martinez (@ali_charts), a crypto analyst, compiled the viewpoints of several market veterans on X , offering a multi-perspective take on the likelihood of an impending correction.

Bitcoin Price Crash Incoming?

One of the voices in this discussion is Tone Vays, a well-known trader who has expressed grave concerns about Bitcoin’s trajectory. Vays conveyed that Bitcoin trading below $95,000 is “very, very bad” as it heightens the likelihood of a correction to around $73,000.

In a shared video, Vays elaborated, “We’re now opening the month day trading below $95,000, […] getting too close to the $92,000 range literally opens like Pandora’s box into a massive crash down to $73,000. Now, I’m not saying it’s going to crash $73,000. I’m saying the possibility has significantly increased that we can easily go to $73,000. You are sitting at the last line of support.”

Peter Brandt, another prominent analyst, added to the growing concern by discussing the formation of a “broadening triangle” in Bitcoin’s price chart. According to Brandt, this pattern could potentially project a retracement toward the $70,000 zone. Although Brandt was careful to clarify that his statements are not definitive predictions, he emphasized the increased possibility of such a movement.

“Hey trolls — this is not a prediction. Just always pointing out possibilities, not probabilities, not ‘certainties’. No screen shot is necessary, BTC right angled broadening triangle could project back into the $70,000s and a test of the parabolic modality,” Brandt stated.

Contrasting with these bearish viewpoints, Fundstrat maintains a more optimistic long-term perspective, predicting that Bitcoin could reach $250,000 by 2025. However, Fundstrat’s Global Head of Technical Strategy, Mark Newton, acknowledges the potential for short-term volatility, suggesting that Bitcoin might experience a downswing to $60,000 before embarking on its ascent.

In a video shared by Martinez, Fundstrat CEO Tom Lee elaborated on this outlook: “Bitcoin, one year from now, I think is something around $250,000. […] it is hyper volatile. People don’t like the volatility. Yeah, Mark Newton, our technician, thinks that the cycle of Bitcoin turns a little bit down early next year, so maybe Bitcoin gets to the $60,000s.”

Adding to the chorus of caution, Benjamin Cowen, CEO and Founder of Into The Cryptoverse, posits that Bitcoin’s price action could mirror that of the Nasdaq 100 (QQQ). According to Cowen, this alignment could precipitate a “flash crash” to $60,000, potentially coinciding with Donald Trump’s inauguration day.

From an on-chain analysis standpoint, Martinez confirms the bearish possibilities. He notes that if Bitcoin falls below $93,806, the path to $70,085 becomes increasingly plausible, describing the area below as “open air all the way down to $70,085.” Martinez identifies the critical support zone between $97,041 and $93,806, emphasizing that failure to maintain these levels could trigger a sharp decline.

He observes that market dynamics indicate some investors are preparing for such a downturn, evidenced by the transfer of over 33,000 BTC (valued at more than $3.23 billion) to exchanges in the past week. Additionally, profit-taking appears to be intensifying, with more than $7.17 billion in Bitcoin profits realized on December 23 alone.
The proportion of Binance traders with open long positions on BTC has also decreased from 66.73% to 53.60%, suggesting a shift in market sentiment towards a more bearish stance.

Ultimately, Martinez underscores the importance of Bitcoin reclaiming the $97,300 support zone to invalidate the bearish forecasts. “Bitcoin recently broke below one of its most significant support zones at $97,300. So, for the bearish outlook to be invalidated, BTC must reclaim this critical area of support and, more importantly, sustain a daily close above $100,000,” he states.

Should Bitcoin manage to sustain a daily close above $100,000, Martinez posits the potential for a significant upswing, possibly reaching $168,500 based on the Mayer Multiple. However, the failure to do so leaves the door open for the predicted corrections to materialize.

At press time, BTC traded at $96,905.

Bitcoin price

Bitcoin Crashes: Here’s Where The Nearest On-Chain Support Is

Bitcoin has observed a plunge during the past day. Here’s the nearest on-chain level that the asset would end up retesting if the drawdown elongates.

1 Week To 1 Month Bitcoin Holders Have Their Realized Price At $97,900

As pointed out by CryptoQuant author Axel Adler Jr in a new post on X, the Realized Price of the 1-week to 1-month-old BTC investors is the closest support for the asset right now.

The “Realized Price” here refers to an on-chain indicator that, in short, keeps track of the cost basis or acquisition price of the average holder on the Bitcoin network.

When the metric’s value is lower than the spot price of the cryptocurrency, it means the investors as a whole can be considered to be holding a net amount of profit. On the other hand, it being under the BTC value suggests the dominance of loss in the market.

In the context of the current topic, the Realized Price of only a particular segment of the sector is of interest: the 1-week to 1-month-old holders. This cohort includes the addresses that have been holding their coins for at least one week and, at most, one month.

Now, here is the chart shared by the analyst that shows how the Realized Price of this Bitcoin group has changed over the past year:

Bitcoin STH Realized Price

As displayed in the above graph, the Realized Price of the 1-week to 1-month-old Bitcoin investors has been climbing up alongside the price rally. This is naturally due to the fact that the cohort’s cost basis has been getting repriced to higher levels as new investors have been purchasing at the rally highs.

Currently, the indicator’s value sits at $97,900, so these investors would be in profit at the current price. Earlier in the past day, however, the asset came dangerously close to retesting the level as its price saw a brief dip below $99,000.

The 1 week to 1 month old investors make up a section of a larger cohort known as the short-term holders (STHs). The STHs are broadly defined as the holders who bought their coins within the past 155 days.

Statistically, the longer an investor holds onto their coins, the less likely they become to sell. So, the STHs, and especially the 1-week to 1-month-old segment, would contain the holders with the least amount of resolve in the sector, owing to their low holding time.

Because of how fickle they are, the STHs generally show some kind of reaction whenever their average cost basis gets retested by the Bitcoin price. This reaction may come in the form of buying when the retest occurs from above, as these holders could believe the decline to be just a ‘dip.’

As such, the Realized Price of the 1-week to 1-month-old STHs, which is below the current price, could be looked at as a support level for the cryptocurrency. The level has also already helped the asset out once this month.

So far, Bitcoin has been making a recovery from the plummet, but should the bearish momentum return, the retest of the line may be to watch for, considering the past pattern.

BTC Price

At the time of writing, Bitcoin is trading at around $102,200, down almost 3% in the last 24 hours.

Bitcoin Price Chart

Will Bitcoin See Another ‘Thanksgiving Day Massacre’? Experts Weigh In

Almost four years ago to the day, Bitcoin experienced a dramatic 17% plunge from $19,500 to $16,200 in 2020, an event that became infamously known as the “Thanksgiving Day Massacre.” As the holiday approaches once again, market participants are questioning whether history might repeat itself.

On Monday and Tuesday, Bitcoin’s price underwent an 8% correction, dropping from $98,871 to a low of $90,791. This sudden downturn has sparked discussions among analysts if history could be repeating for the BTC price.

Bitcoin ‘Thanksgiving Day Massacre’ 2024?

Alex Thorn, Head of Research at Galaxy Digital, took to X to draw parallels between the current market and the events of 2020. “Who remembers the Thanksgiving dump of 2020? Bitcoin dumped 17% between Wednesday, Nov 25, and Friday, Nov 27, 2020. BTCUSD later went on to more than 3x over the next 5 months. Does history rhyme?”

A potential catalyst for the crash could be the global M2 money supply. Currently, a chart illustrating the correlation between Bitcoin and global M2 is circulating on X.

Bitcoin & Global M2

Joe Consorti, an analyst at Theya, observed that since September 2023, “Bitcoin has closely tracked global M2 with a ~70-day lag.” Over the past two months, global M2 has declined from $108.3 trillion to $104.7 trillion, driven by factors such as a strengthening US dollar—devaluing foreign currency-denominated M2 when converted into dollars—and economic slowdowns dampening lending and deposit creation.

Consorti cautions, “If it continues to follow the current contraction in M2, a 20-25% correction could materialize, potentially pulling bitcoin down to roughly $73,000—not a price prediction, but a stark reminder of Bitcoin’s tether to the global money supply.” However, he also acknowledged that Bitcoin might defy this trend, as it has in the past, particularly “from 2022-2023 due to the FTX collapse and interest in the space evaporating as a result.”

He suggests that structural ETF inflows and corporate buying pressure could help Bitcoin resist the current M2 deflation. Consorti concludes, “Either way, a correction at this point seems about right. As mentioned before, these rapid run-ups in Bitcoin’s price always have pitstops along the way, […] it’s vital to understand the asset you hold, the macro environment it exists in, and the forces driving it higher long-term. If you truly understand bitcoin, you don’t panic sell.”

Despite the cautious outlook, some analysts believe the dip may be short-lived. Jamie Coutts, Chief Crypto Analyst at Real Vision, points out via X that “a Bitcoin bid has overshadowed tightening liquidity over the past month.” While acknowledging that Bitcoin appears “overstretched vs. global M2” and that his liquidity model suggested caution, especially with leverage, Coutts highlights potential policy shifts that could favor risk assets.

He references insights from economist Andreas Steno, indicating that the Federal Reserve is “in effect, discussing a put for USD liquidity—changes to support liquidity developments as early as December.” Coutts concludes: “DXY could have topped here. The lag effect that Fintwit is focused on atm is still real, but ultimately, the Fed is waving the bull flag for risk assets again. Bullish 2025. Bullish BTC.”

DXY topped here?

At press time, BTC traded at $93,250.

Bitcoin price

Bitcoin Crashes Under $93,000: What’s Behind It?

Bitcoin has observed a plunge under the $93,000 level during the past day. Here’s what the trend in an indicator suggests about what could be behind this downturn.

Bitcoin Coinbase Premium Gap Has Gone Cold

As pointed out by CryptoQuant community analyst Maartunn in a new post on X, the Coinbase Premium Gap has returned to neutral levels recently. The “Coinbase Premium Gap” here refers to an indicator that keeps track of the difference between the Bitcoin price listed on Coinbase (USD pair) and that on Binance (USDT pair).

This metric essentially tells us about how the buying or selling behaviours differ between the user bases of the two cryptocurrency exchanges. Coinbase’s main traffic is made up of American investors, especially large institutional entities, while Binance serves investors around the world.

When the Coinbase Premium Gap has a positive value, it means the US-based whales are participating in a higher amount of buying or a lower amount of selling than the Binance users, which is why the asset is more expensive on Coinbase. Similarly, it being negative implies a net higher buying pressure on Binance.

Now, here is a chart that shows the trend in the Bitcoin Coinbase Premium Gap over the past couple of days:

Bitcoin Coinbase Premium Gap

As displayed in the above graph, the Bitcoin Coinbase Premium Gap had been at notable positive levels earlier, but during the past day, its value has declined to the neutral zero mark.

According to Maartunn, the source of the positive premium was Microstrategy’s latest buying spree. Indeed, the cooldown in the indicator matches up with the timing of the completion of the $5.4 billion purchase by Michael Saylor’s firm. The significant accumulation from the company had helped the cryptocurrency maintain its recent highs, but with the buying pressure depleted, Bitcoin has retraced to price levels under $93,000.

BTC and the Coinbase Premium Gap have held a close relationship throughout 2024, so the metric could be to keep an eye on in the near future, as where it goes next may once again foreshadow the asset’s next destination. Naturally, a decline into the negative region could spell further bearish action for its price.

In some other news, the Bitcoin Active Addresses indicator has observed a sharp jump recently, as Maartunn has shared in another X post. This metric keeps track of the daily number of addresses that are participating in some kind of transaction activity on the network.

Below is the chart shared by the CryptoQuant analyst for the 14-day simple moving average (SMA) of the Active Addresses:

Bitcoin Active Addresses

With this latest surge, the 14-day SMA of the Bitcoin Active Addresses has reached its highest point in eleven months. This suggests that a lot of activity has recently occurred on the network. Given that the asset has gone down in the past day, though, the most recent user interest has certainly not come for buying.

BTC Price

At the time of writing, Bitcoin is floating around $92,400, down almost 6% over the last 24 hours.

Bitcoin Price Chart

Robert Kiyosaki Warns Of A Bitcoin Crash To $5,000: Here’s Why

Robert Kiyosaki, the renowned author of “Rich Dad Poor Dad,” has issued a stark warning about an impending financial crisis that he believes will lead to a significant market downturn, including a potential Bitcoin crash to $5,000 per coin. In a post on X today, Kiyosaki elaborated on his views regarding the current economic climate, drawing parallels to the 2008 Global Financial Crisis (GFC).

Why Bitcoin Could Crash To $5,000

Kiyosaki revisited the events of 2008, referring to the GFC as a pivotal moment when, in his view, “the criminals at the Fed and Treasury began printing trillions of fake dollars in an attempt to stop a Global ‘F-ing’ Depression.” He argued that these measures were taken to save “their ultra-rich friends,” while the general public was left to suffer the consequences.

According to Kiyosaki, the massive influx of newly printed money led to what he describes as “The Everything Bubble,” a phenomenon where all markets began to rise artificially, “floating on a sea of fake money.” He believes that this bubble is unsustainable and is on the verge of transforming into “The Everything Crash.” He warns that “everything will crash, including gold, silver, and Bitcoin,” suggesting that the market is approaching a critical point akin to a “blow-off top.”

Kiyosaki emphasizes that this impending crash could be detrimental for most people, potentially leading to a global depression that was narrowly avoided in 2008. He urges individuals not to be complacent or comfortable in what he considers a “fake bubble,” and to instead prepare for the forthcoming economic downturn.

He points out that prominent investors are already taking action by selling “overpriced” assets and converting them into cash. The best-selling author cites Warren Buffett as an example, noting that Buffett has reportedly been selling his Apple shares and accumulating large reserves of US dollars.

Despite the grim outlook, Kiyosaki sees the anticipated crash as an opportunity for those who are prepared. He encourages people to take proactive steps, even if they currently lack financial resources. “After the everything crash….that follows the everything bubble….the prepared will get really rich…I plan on being one of the prepared…I plan on becoming even richer….and I want you to become richer too,” Kiyosaki remarked.

Specifically regarding Bitcoin, Kiyosaki predicts that the cryptocurrency could plummet to $5,000 during the crash. However, he also forecasts a dramatic rebound, with Bitcoin potentially soaring to $100,000 or even $250,000 and beyond after the market stabilizes.

“Take Bitcoin for example… it may crash to $5000 a coin….then boom to $100,000 to $250,000 and higher. Obviously, I will be buying all the Bitcoin I can, as well as other assets, at bargain basement prices,” he stated.

Throughout his post, Kiyosaki maintains a critical stance toward the Federal Reserve and the US Treasury, whom he accuses of perpetuating a flawed financial system that benefits a select few at the expense of the majority. He concludes, “I want you to be one of the rich…not one of the victims of the criminal Fed and Treasury.”

At press time, BTC traded at $65,657.

Bitcoin price

Bitcoin Hype Bites Back As BTC Crashes Under $64,000

Data shows social media users had become overly excited about Bitcoin after the recent rally, which may be why BTC has retraced.

Bitcoin Topped Out As Hype Around The Coin Shot Up

According to data from the analytics firm Santiment, crowd sentiment around BTC has noted a sharp surge recently. The indicator of relevance here is the “Positive vs. Negative Sentiment Ratio,” which keeps track of the difference between the positive and negative comments related to Bitcoin that are being made on social media platforms.

The indicator separates posts related to negative and positive sentiments by putting them through a machine-learning model devised by the analytics firm.

When the value of this metric is greater than 0, it means the social media users are participating in more positive talks than negative ones. On the other hand, it being under this threshold suggests the dominance of bearish sentiment on these platforms.

Now, here is a chart that shows what the Positive vs. Negative Sentiment Ratio’s recent trajectory has been like:

Bitcoin Sentiment

As displayed in the above graph, the Bitcoin Positive vs. Negative Sentiment Ratio had observed a significant surge during the cryptocurrency’s earlier run toward the $66,000 level.

Yesterday, when Santiment shared the post, social media users made 1.8 bullish posts for every 1 bearish post. Thus, the traders had become quite optimistic after the price surge. This, however, may not have been an ideal development for the coin.

Historically, BTC has tended to move in the direction opposite to what the crowd is expecting, with the probability of a contrary move only rising the more lopsided the sentiment gets.

Today, Bitcoin has retraced back under the $64,000 level, a possible indication that the earlier hype that the social media users had shown has backfired, just like it has done many times.

It’s also not just the social media users that have been excited recently, as the Fear & Greed Index, an indicator created by Alternative that considers more factors than just social media, has also been showing a rising optimism in the sector.

Bitcoin Greed

The Fear & Greed Index currently sits at a value of 61, which suggests that the investors are leaning towards being bullish around Bitcoin and the cryptocurrency sector in general.

The sentiment-related indicators could follow in the coming days, as they may dictate whether BTC can regain its bullish momentum. The crowd calming down would be a sign in the right direction if history is to go by.

BTC Price

After the latest plunge, Bitcoin has returned to the $63,400 level.

Bitcoin Price Chart

Bitcoin Recovery: Has BTC Prevented A Fall To $41,000 With This Surge?

Bitcoin has made some recovery over the past 24 hours, which may have prevented this deep fall that the asset was previously at risk of.

Bitcoin Has Recovered Back Towards The $57,000 Level

Bitcoin witnessed a plunge a few days ago, but it has started this new week with bullish momentum, seemingly rejuvenated as its price has recovered to $57,000.

The below chart shows what the coin’s recent performance has looked like.

Bitcoin Price Chart

This 4% jump in the last 24 hours has completely retraced the price above plummet. Perhaps more importantly, the surge has helped the asset gain some distance over an important pricing level of an on-chain model.

BTC Hasn’t Yet Lost This MVRV Pricing Band Support Level

In a post on X, analyst Ali Martinez had yesterday discussed how BTC was retesting a support level part of the MVRV Extreme Deviation Pricing Bands model.

As its name suggests, the model is based on the popular Market Value to Realized Value (MVRV) ratio. This indicator tells us how the value held by the Bitcoin investors (that is, the market cap) compares against the value they put into the asset (the realized cap).

When the ratio has a value greater than 1, the investors are in a state of net profit. On the other hand, it being under the threshold implies the dominance of loss in the market.

The MVRV Extreme Deviation Pricing Bands model takes this metric’s mean value and relates standard deviations (SDs) to the price of the cryptocurrency. Below is the chart for the model that the analyst shared yesterday.

Bitcoin MVRV Pricing Bands

As displayed in the graph, Bitcoin had been retesting the $54,200 level yesterday, which corresponded to the price at which the MVRV ratio would attain the same level as its historical mean.

In the scenario that BTC had found rejection at this level and had dropped under it, the next important level from the perspective of the model would have been $41,100. At this level, BTC’s MVRV ratio would assume a value of -0.5 SD from its mean.

Ali had noted that BTC could have, therefore, been at risk of facing a correction to this level. With the recovery in the last 24 hours, though, the immediate threat of such a drop may no longer loom over the cryptocurrency’s head.

In terms of potential resistance levels ahead, the next Bitcoin MVRV Pricing Band is located at around $67,400, so there is still quite a while to go before a retest of it can happen.

Arthur Hayes Predicts Bitcoin Price Crash Below $50,000 This Weekend

Arthur Hayes, the co-founder of BitMEX, today expressed a bleak outlook for the Bitcoin price’s immediate future. On his X profile, Hayes revealed his personal market maneuver, stating, “BTC is heavy, I’m gunning for sub $50k this weekend. I took a cheeky short. Pray for my soul, for I am a degen.”

Why Hayes Possibly Expects A Bitcoin Price Crash

While Hayes refrained from providing explicit reasons for his prediction, the timing of his statement closely aligns with significant US economic indicators set to be released this Friday. The US jobs data has been a critical factor for market analysts lately. The Kobeissi Letter analysts, commenting on the situation, noted the increasing influence of unemployment data on Federal Reserve policies.

They explained via X that, “Prediction markets are now pricing in 4 rate cuts in 2024, or 100 bps of cuts, for the first time since the August 5th crash, according to Kalshi. Over the last 2 days, prediction markets have priced-in an additional rate cut in 2024. This comes as labor market data has deteriorated around the board. It’s clear that unemployment data is quickly becoming the primary driver of Fed policy, along with inflation.”

According to the analysts, today’s jobs report will be the key factor in determining if the US Federal Reserve (Fed) will cut interest rates by 50 bps or 25 bp. The next FOMC meeting takes place from September 17-18, 2024. “If the jobs report is in-line with expectations, or better, we believe a 25 bps rate cut is coming. Interest rate expectations appear to be shifting too dovish again,” The Kobeissi analysts believe.

Notably, the deteriorating labor market scenario was just highlighted by data released earlier in the week. US job openings, as reported by the JOLTs survey, fell to 7.67 million in July from the previous 7.91 million in June, marking the lowest level since January 2021. Analysts had anticipated a figure around 8.09 million, making the actual data a significant miss from expectations.

Since March 2022, job openings have declined by an alarming 4.51 million, or 38%, a reduction that The Kobeissi Letter describes as “MASSIVE.” They added, “The most notable drop was seen in construction openings which fell to 248,000 in July, their lowest since October 2020. Meanwhile, the ratio of job vacancies to unemployed workers fell to 1.07 in July, in line with 2018 levels.”

This backdrop of weakening job data and revised economic forecasts has undoubtedly contributed to the bad sentiment on the Bitcoin market. Hayes seems to expect more bad macro data, which he believes could push the Bitcoin price below $50,000.

Is $46,000 The Bottom?

Adding to the chorus of bearish outlooks, renowned trader Peter Brandt also provided his technical analysis, observing what he terms an “inverted expanding triangle or a megaphone” pattern in Bitcoin’s weekly chart. Brandt highlighted the potential for Bitcoin to test a lower boundary around $46,000, underscoring a dominance of selling pressure over buying interest in the market.

Bitcoin price analysis

He pointed out, “This is called an inverted expanding triangle or a megaphone. A test of the lower boundary would be to 46,000 or so. A massive thrust into new ATHs is required to get this bull market back on track BTC. Selling is stronger than buying in this pattern.”

At press time, BTC traded at $55,767.

Bitcoin price

Bitcoin Plummets To $59,000, On-Chain Data Reveals Why

Bitcoin has observed a plunge to the $59,000 level during the past day. Here’s what could be behind it, according to on-chain data.

Bitcoin Exchange Inflow Spiked Just Before The Crash

In a new post on X, CryptoQuant Head of Research Julio Moreno discussed the latest trend in Bitcoin Exchange Inflow. Exchange Inflow is an on-chain metric that tracks the total amount of assets being transferred into the wallets of centralized exchanges.

Investors deposit many coins on these platforms when this indicator’s value is high. One of the main reasons holders may transfer to exchanges is for selling-related purposes so this trend can have bearish consequences for BTC’s value.

On the other hand, the low metric implies holders aren’t moving that many coins from self-custody into exchanges, which, depending on whether outflows are also occurring, can potentially be bullish for the cryptocurrency.

Now, here is the chart shared by Moreno that shows the trend in the Bitcoin Exchange Inflow over the past few days:

Bitcoin Exchange Inflow

As displayed in the graph at the top, the Bitcoin Exchange Inflow saw some notable spikes in the lead-up to the latest price plunge. The version of the indicator in the chart is specifically for the spot platforms, so selling was likely the goal of the investors making these deposits.

The CryptoQuant head has also attached the data for another metric: the Spent Output Value Bands version of the Exchange Inflow, under the chart for the Exchange Inflow.

This indicator shows how the Exchange Inflow breaks down according to the transactions’ size. In the graph, Moreno has specifically highlighted the 1,000 to 10,000 BTC value band, corresponding to addresses carrying between 1,000 and 10,000 tokens in their balance.

Investors of this scale are popularly known as the whales and are considered among the market’s most influential entities. As the chart shows, the Exchange Inflow for these large Bitcoin holders also spiked alongside the spikes in the general metric, implying that the whales contributed to some of the deposits.

Given the timing of the inflows made by these humongous investors, it’s probable that this selling was partially responsible for the bearish price action the cryptocurrency witnessed during the past day.

As such, the indicator could be worth monitoring shortly, as more large deposits could suggest that the Bitcoin sellers aren’t done yet.

BTC Price

At the time of writing, Bitcoin is floating around $59,900, down almost 4% over the last 24 hours.

Bitcoin Price Chart