Analyst Predicts Bitcoin And Crypto Market Crash Of Epic Proportions, Here’s When

Bitcoin and the entire crypto market are currently in an uptrend which has been a cause for celebration for investors all across the space. However, not everyone expects this uptrend to continue. One crypto analyst has made a case for why Bitcoin and the crypto market at large could be headed for an epic crash.

Why Bitcoin And Crypto Will Crash

A crypto analyst who goes by Shelby on the TradingView platform has put forward an analysis of why the price rally will end in a massive crash. The analysis which began on October 24, 2023, starts out with expectations of a price rally for Ethereum to the $3,200 level before a breakdown to $200-$600.

A follow-up comment shows the expectation for ETH to actually reach $2,100. Or in special circumstances, reach $3,200 while Bitcoin runs up to $36,000 if the ETHBTC pair reaches 0.088 BTC. The second part of this has since played out in that the Bitcoin price has now crossed $36,000 but Ethereum continues to lag behind below $2,000.

This bullishness ends in 2023, however, as the analyst expects a crash to happen sometime between Q1 and Q2 2024. They liken this crash to the early 2020 crash that sent crypto rallies spiraling to new lows before the bull market began.

The price targets for this predicted crash would see the likes of Bitcoin and Ethereum fall more than 50% from their current levels. For Bitcoin, the analyst puts it at sub-$15,000 for the first half of 2024 and Ethereum at sub-$500.

However, it is not all gloom as the crypto analyst expects both assets to rally quite well leading up to 2025. “Given my expectation is BTC will top ~70k in 2025, ETH perhaps will top $ 5 – 10k. So buying altcoins in the looming crash will end up very lucrative.”

Bitcoin price chart from Tradingview.com (Crypto)

What Happened In 2020?

The trend pattern for Bitcoin in 2019 is eerily similar to that of 2023 so far. Just like November 2023, the Bitcoin price had recovered in November 2019, taking the rest of the crypto market with it as well. This rise in price would continue on into the early parts of 2020, but that run would be cut short not long after.

Historical data shows that BTC’s price peaked just above $10,000 in February 2020, before the crash began. By March, the price of the asset had fallen almost 50% to $5,400 before the halving took place. This kind of crash is what the analyst is pointing to.

If there is a repeat of this, then the current Bitcoin rally could continue on to early 2024, likely reaching a peak of $40,000. But the market bottom might already be marked in November 2022, as a 50% fall would not bring the BTC price below $15,000.

Bitcoin Whales Buy Dip, Addresses Now At Pre-Crash Levels

On-chain data shows the Bitcoin whales have been buying the dip, as their addresses have surged back towards pre-crash levels again.

Bitcoin Whales Have Fully Recovered To Their Pre-Crash Number

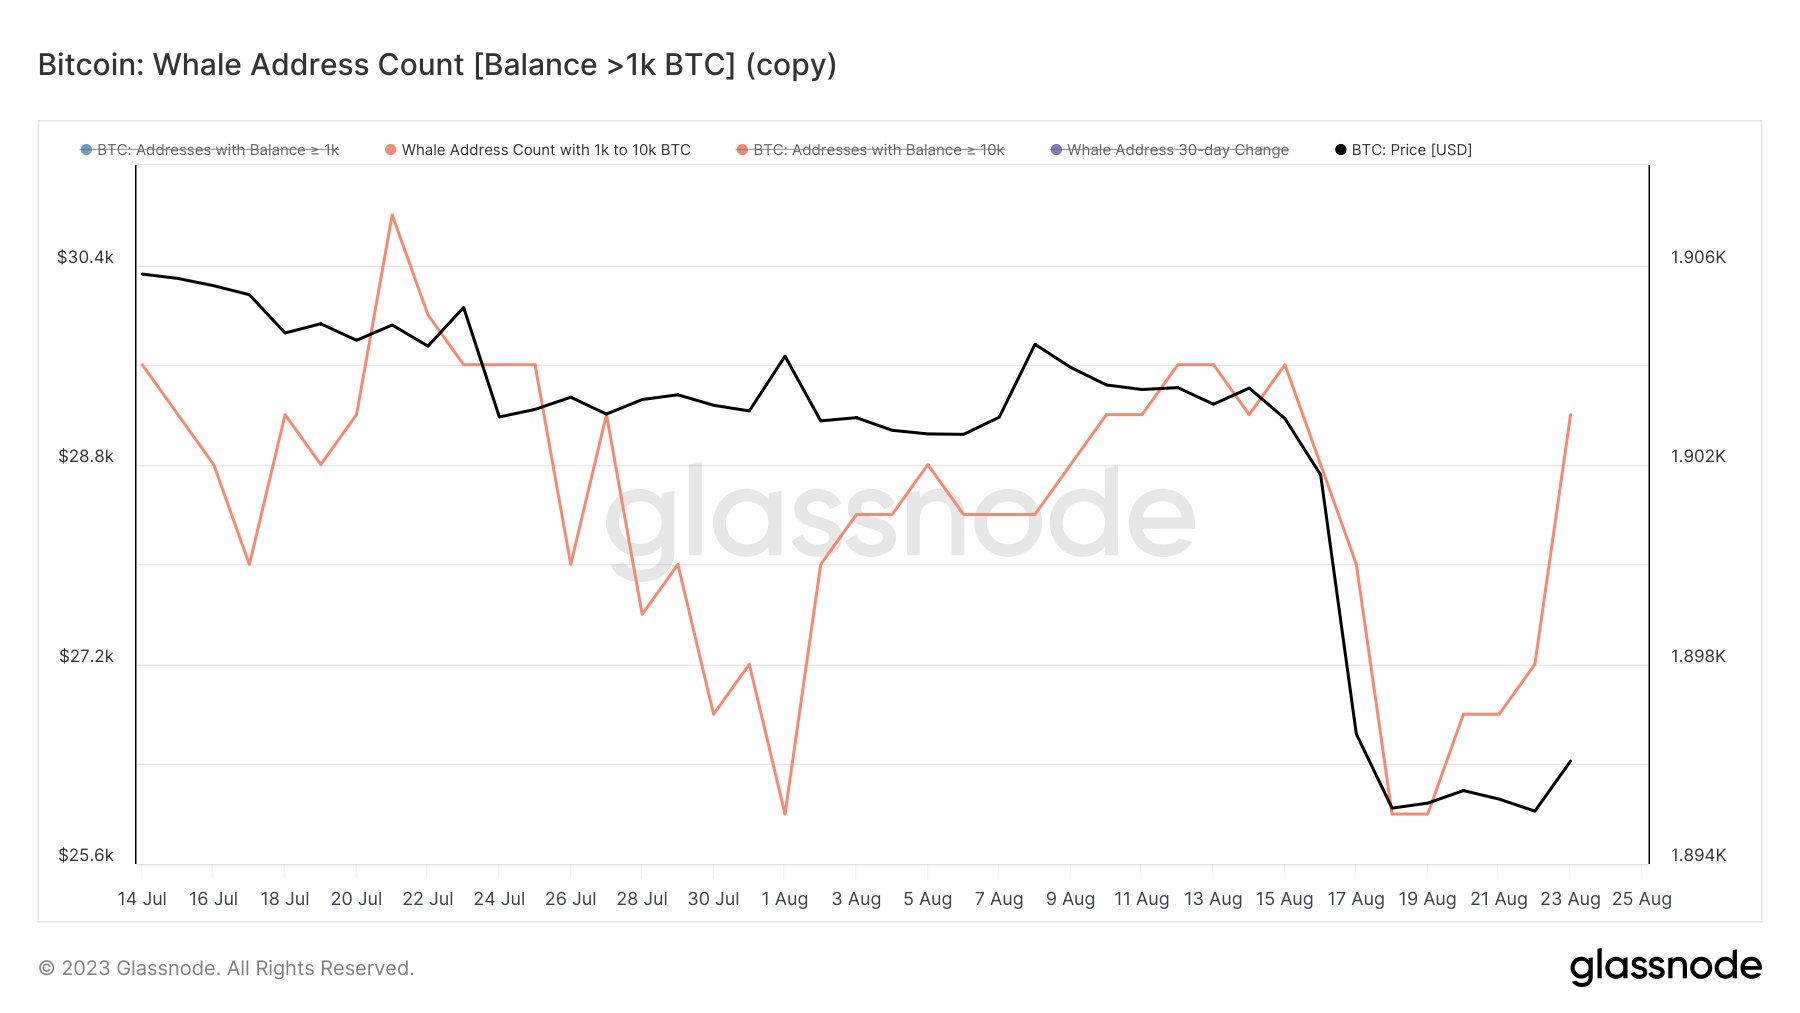
As pointed out by an analyst in a post on X, the whales appear to have been accumulating recently. The relevant indicator here is the “whale address count,” which measures the total number of Bitcoin addresses that hold at least 1,000 BTC and at most 10,000 BTC.

At the current exchange rate, this range converts to approximately $26 million at the lower bound and $260 million at the upper bound. These are clearly very significant amounts and the only investors large enough to be owners of these addresses would be the whale entities.

The whales naturally carry some influence in the market, due to the fact that they hold a notable part of the total circulating supply of the asset. Thus, their movements can be worth keeping an eye on, as they can influence the price of the asset.

Another version of the indicator tracks the addresses with balances upwards of 10,000 BTC (that is, this range’s upper bound), but at those levels, the wallets become more likely to belong to central entities like exchanges, so the trend in their addresses may not hold the same significance as what that of the normal whales would.

Now, here is a chart that shows the trend in the Bitcoin whale address count over the past month or so:

Bitcoin Whale Address Count

As displayed in the above graph, the whale address count observed a large drop around the time of the asset’s crash a few days back, where the price plummeted from the $29,000 level to below the $26,000 mark.

This decline in the number of addresses of these humongous investors would imply that some members of this cohort participated in distribution during the crash.

These whales who participated in the selloff didn’t necessarily clear out their entire holdings and exit the market, though, as distribution just enough to bring their address balances below the 1,000 BTC mark would still lead to a drawdown in the indicator.

Initially, following the crash, the number of these large Bitcoin holders remained flat, implying that there wasn’t any significant accumulation or distribution taking place.

In the past few days, however, the BTC whale address count has registered a sharp spike, suggesting that more whale-sized addresses have popped up on the network. With this uplift, the indicator has returned back to about the same values as it was before the price crash had occurred.

The whales participating in buying at the current price lows is naturally a positive sign for the cryptocurrency, as it could provide a more solid foundation for a rebound in the asset’s value.

BTC Price

At the time of writing, Bitcoin is trading near $26,021, down 1% in the last seven days.

Bitcoin Price Chart

Will Bitcoin Show A Repeat Of The March Rebound?

Will Bitcoin observe a repeat of the rebound that took place after the crash back in March? Here’s what this on-chain metric suggests.

Bitcoin Short-Term Holder SOPR Is Showing A Pattern Similar To March

As an analyst in a CryptoQuant post explained, if the BTC short-term holder SOPR crosses above 1 in the coming days, a rebound might occur. The “Spent Output Profit Ratio” (SOPR) here refers to an indicator that tells us whether the investors are selling their Bitcoin at a profit or a loss right now.

When the value of this metric is greater than 1, it means that the average holder is currently moving their coins at a profit. On the other hand, values under this threshold imply that loss-taking is the dominant behavior in the market.

The SOPR being precisely equal to one naturally suggests that the investors are just breaking-even on their selling currently, as the total amount of profits realized in the market is precisely canceling out the losses.

In the context of the current discussion, the SOPR for only a specific market segment is of interest. Namely, the short-term holder (STH) SOPR is the relevant metric.

Here is a chart that shows the trend in the 7-day simple moving average (SMA) Bitcoin STH SOPR over the past few months:

Bitcoin STH SOPR

The STH group includes investors who purchased their BTC less than 155 days ago. This cohort makes up one of the two main segments of the market, the other side being the “long-term holders” (LTHs).

As displayed in the graph, the 7-day Bitcoin STH SOPR had been floating around the neutral mark before the recent crash, but following it, the metric has plunged into the loss territory. This would suggest that the STHs have been panic-selling at a loss after they witnessed the cryptocurrency register a deep drawdown.

The chart shows that the crash back in March of this year also pushed the STHs into selling at a loss. The lowest value that the 7-day STH SOPR has seen in the current crash so far has been similar to what the March crash observed.

Historically, capitulation has allowed the asset to form bottoms, as in such events, the weak hands exit the market, and the more persistent investors may pick up their coins.

This effect seems to have worked in March, as the coin hit its bottom during the STHs’ capitulation. As the loss selling slowed down, Bitcoin rebounded in speculator fashion, as its price jumped below $20,000 to near the $30,000 mark.

Currently, the STHs’ loss selling is slowing down, as the metric’s value is gradually rising. The latest capitulation may have also allowed BTC to form a bottom this time. It remains to be seen whether that was the case, and if Bitcoin can show a rebound similar to back in March.

BTC Price

At the time of writing, Bitcoin is trading around $26,000, down 11% in the last week.

Bitcoin Price Chart

Bitcoin Investors Fall Into Fear As BTC Crashes To $26,500

Data shows the Bitcoin market sentiment has plunged into fear as the cryptocurrency’s price has observed a crash to the $26,500 level.

Bitcoin Fear & Greed Index Points At “Fear” In The Market

The “Fear & Greed Index” is an indicator that tells us about the general sentiment among investors in the Bitcoin and wider cryptocurrency market. This metric uses a numeric scale that runs from 0-100 for displaying the sentiment.

All values above the 54 mark suggest the presence of greed among the investors, while those below 46 imply a majority mentality of fear. The region between these cutoffs reflects the neutral sentiment.

As for how the index calculates the sentiment, Alternative.me, the creator of the metric, explains that it takes into account several different factors. Namely; volatility, trading volume, social media sentiment, market cap dominance, and Google Trends are what the indicator currently makes use of to pinpoint the market mentality.

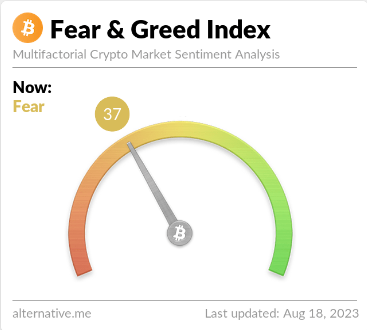
Now, here is what the Bitcoin Fear & Greed Index’s value looks like right now:

Bitcoin Fear & Greed Index

As you can see above, the index’s value is 37 currently, which suggests that the majority of the investors are fearful. This latest value of the indicator reflects a new shift in the sector, as prior to today, the indicator had been stuck inside the neutral territory for more than three weeks straight.

The below chart displays the trend in the fear and greed index over the past year.

Bitcoin Fear

From the graph, it’s visible how sharp this latest drop in the metric has been. In a flash, the market sentiment went from being completely neutral (50), to firmly inside the fear territory (37).

The reason behind this hit to the investor mentality has been the sharp crash that Bitcoin has observed during the past day, as the cryptocurrency’s price has now slumped below $26,500.

Earlier, when the index was consolidating in neutral territory, investors had been hesitant and undecided. But with this price action, it would appear that their mind has been made up, and they think that the asset would go down even lower.

Historically, the market has actually tended to make moves that the majority of the holders aren’t expecting. The harder investors lean toward any one direction (fear or greed), the more probable price action of the opposite type becomes.

The Bitcoin Fear & Greed Index also has two sub-sentiments inside fear and greed called extreme fear and extreme greed. These take place at values below 25 and above 75, respectively. Cyclical bottoms and tops in the asset have usually always formed whenever the market has been inside these zones, showcasing the aforementioned effect in action.

As the market hasn’t yet dipped too deep into the fear region, the probability of a bottom is likewise not raised too much yet. Back in March, however, Bitcoin did manage to find its bottom when the investors were fearful to a degree not much greater than right now.

It now remains to be seen how the market sentiment will develop in the coming days, and if BTC will be able to find its bottom off the back of this fearful situation.

BTC Price

At the time of writing, Bitcoin is trading around $26,400, down 10% in the last week.

Bitcoin Price Chart

Bitcoin Now Trading 24% Below Realized Price, How Deeper Can It Go?

On-chain data shows Bitcoin is now trading 24% below the realized price, here’s how much deeper the crypto went during historical cycles.

Bitcoin Has So Far Declined 24% Under The Realized Price

As pointed out by an analyst in a CryptoQuant post, drawdowns below the realized price have been shrinking with each cycle.

A popular capitalization model for Bitcoin is the “realized cap,” which measures the cap by weighting each coin in the circulating supply against the price at which it was last moved.

This is different from the usual market cap, where every coin in circulation is simply multiplied with the latest BTC price.

Now, from this realized cap, a “realized price” can be derived by dividing the metric with the total number of coins in circulation.

The usefulness of this price is that it signifies the cost basis of the average holder in the Bitcoin market. This means that whenever the normal price dips under this indicator, the average investor enters into a state of loss.

Here is a chart that shows the percentages below the realized price BTC has gone during each cycle:

Bitcoin Realized Price

Looks like the value of the metric has plunged in recent days | Source: CryptoQuant

As you can see in the above graph, the latest crash in the price of Bitcoin has taken the crypto 24% below the realized price, the deepest value observed in the current cycle so far.

It’s apparent from the chart that the previous bear market of 2018/19 saw an even larger drawdown, as the price had declined about 30% below the metric at the bottom.

Comparing the two cycles in isolation would suggest the current bear market still needs to see a notable amount of decline before the same bottom values are hit.

However, things change when the 2015 and 2012 bottoms are also taken into account. In 2012, Bitcoin went as low as 60% below the realized price, while in 2015 the decline was around 41%.

There seems to be a pattern here, and it’s that the percentage of fall below the indicator has been shrinking with each cycle.

If this trend continues to hold this time as well, then Bitcoin may in fact already be near a bottom for this cycle.

BTC Price

At the time of writing, Bitcoin’s price floats around $16.5k, down 1% in the last week. Over the past month, the crypto has lost 14% in value.

The below chart shows the trend in the price of the coin over the last five days.

Bitcoin Price Chart

The crypto continues to show stale price movement | Source: BTCUSD on TradingView
Featured image from Traxer on Unsplash.com, charts from TradingView.com, CryptoQuant.com

This Indicator Hints US Investors Sold Bitcoin Harder Than Others During Crash

The Bitcoin Coinbase Premium Index suggests US investors have been selling more heavily than others during the latest crash in the crypto.

Bitcoin Coinbase Premium Index Has Turned Deep Red Recently

As pointed out by an analyst in a CryptoQuant post, whales on Coinbase Pro seem to have been behind the latest dump.

The “Coinbase Premium Index” is an indicator that measures the percentage difference between the Bitcoin price listed on Coinbase Pro (USD Pair) and the one listed on Binance (USDT pair).

Coinbase Pro is popularly known to be used by investors based in the US (especially large institutionals), while Binance gets a more global traffic.

Therefore, the price gaps listed on these two crypto exchanges can hint at which investors are selling or buying more.

When the metric has a positive value, it means the value of BTC on Coinbase is higher than on Binance right now, suggesting that US investors have provided more buying pressure recently.

On the other hand, negative values of the premium suggest American holders are dumping more than global investors at the moment.

Now, here is a chart that shows the trend in the Bitcoin Coinbase Premium Index over the past year:

Bitcoin Coinbase Premium Index

The value of the metric seems to have been red in recent days | Source: CryptoQuant

As you can see in the above graph, the Bitcoin Coinbase Premium Index has plunged into negative values recently along with the crash.

This means that US investors have been dumping more aggressively than investors from the rest of the world in the past week.

Also, as is clearly visible in the chart, a similar trend was also seen back in early May, when BTC’s price crashed from $40k to $30k.

The quant notes that while Coinbase observed this selling, the Bitcoin Korea Premium Index showed an interesting behavior. The below chart highlights this trend.

Bitcoin Korea Premium Index

Looks like this metric had a green value recently | Source: CryptoQuant

The Korea Premium Index measures the gap between the prices listed on South Korean crypto exchanges, and that on other exchanges.

From the graph, it’s apparent that during both the current crash as well as the one in May, the indicator showed positive spikes.

This implies that while the US investors were dumping, the Korean investors were focusing on “buying the dip.”

BTC Price

At the time of writing, Bitcoin’s price floats around $16.8k, down 15% in the last week. Over the past month, the crypto has shed 11% in value.

Bitcoin Price Chart

BTC has been stuck in consolidation under $17k in the last few days | Source: BTCUSD on TradingView
Featured image from Unsplash.com, charts from TradingView.com, CryptoQuant.com

Bitcoin On-Chain Data: Selling From Whales Holding 1k+ BTC Behind Crash

On-chain data shows Bitcoin whales with more than 1k BTC were the main sellers in the latest crash, as other cohorts displayed muted activity.

Bitcoin Spent Output Value Bands Shows Spike From 1k-10k Group

As pointed out by an analyst in a CryptoQuant post, unlike in the previous declines, the 10-100 BTC and 100-1k BTC cohorts didn’t show any spikes in activity during the latest crash.

The relevant indicator here is the “Spent Output Value Bands” (SOVB). which displays the number of coins being moved by each value band in the Bitcoin market.

These “value bands” or groups are divided based on the amount of coins moved in each transaction on the chain. For example, the 1k-10k BTC value band includes all transfers that involved between 1k and 10k BTC.

The Spent Output metric for this value band then specifically measures the total amount of Bitcoin that was shifted using transactions of size falling in this range.

Now, here is a chart that shows the trend in the Bitcoin SOVB for 10-100 BTC:

Bitcoin Spent Output Value Bands

The value of the metric seems to have been normal recently | Source: CryptoQuant

As you can see in the above graph, during the previous selloffs, the Bitcoin Spent Output chart for the 10-100 BTC value band spiked up, suggesting that investors with at least 10 to 100 BTC were heavily selling their coins.

A similar trend was also seen for the 100-1k BTC value band, as the below chart displays.

Bitcoin Sharks

Looks like this metric has also not significantly gone up in recent days | Source: CryptoQuant

In the most recent crash, however, while there was a spike in these indicators, it was nowhere near as sharp as in the previous instances. This suggests that these value bands didn’t see much dumping this time.

The 1k-10k BTC cohort, though, has showed a different behavior. Below is the Spent Output graph for this value band.

Bitcoin Whales

The indicator has shot up | Source: CryptoQuant

As is apparent from the chart, the 1k-10k BTC value band registered a large amount of movement in the crash, suggesting that transactions worth more than 1k BTC accounted for the majority of the selling this time around. Such big transfers belong to the whales, meaning that whales drove this crash.

While whale dumping is negative for the market, the quant notes that the decline in the other two cohorts could be a sign that selling pressure is now almost exhausted in the Bitcoin market.

BTC Price

At the time of writing, Bitcoin’s price floats around $17.1k, down 15% in the last week.

Bitcoin Price Chart

BTC plummets down | Source: BTCUSD on TradingView
Featured image from Georg Wolf on Unsplash.com, charts from TradingView.com, CryptoQuant.com

This On-Chain Metric Suggests Bitcoin Not In Danger Of Another Sharp Drawdown

Historical data of an on-chain indicator could suggest Bitcoin may not be in danger of another sharp crash right now.

Bitcoin Spot Exchange Depositing Addresses Stay At Very Low Values

As pointed out by an analyst in a CryptoQuant post, signs are that another crash similar to Q3 2018 isn’t likely to happen currently.

The relevant indicator here is the “spot exchange depositing addresses,” which is a measure of the total number of Bitcoin wallet addresses that are making send transactions to centralized spot exchanges right now.

Generally, investors deposit their coins on spot exchanges for selling purposes. Thus, a spike in this metric can be bearish for the price of the crypto as it could be a hint at dumping behavior from a large number of addresses.

On the other hand, low values imply not many holders are adding to the selling pressure in the market at the moment.

Now, here is a chart that shows the trend in the Bitcoin spot exchange depositing addresses over the last few years:

Looks like the value of the metric has been going down in recent months | Source: CryptoQuant

As you can see in the above graph, the quant has marked the relevant zones of trend for the Bitcoin spot exchange depositing addresses.

It seems like usually around periods where this indicator has sharply risen up to local tops, the price of BTC has also observed a top and subsequently declined.

Since the bull run top last year, the spot exchange depositing addresses have been overall winding down, seeing only a couple of peaks in the period.

Some investors have recently been wondering whether another sharp drawdown is coming for Bitcoin in the near future, just like the one the 2018 bear market saw after months of sideways movement similar to now.

Looking at the chart for the trend during the 2017/2018 cycle, it’s apparent that the metric declined following the bull run top and then plateaued at low levels as the bear market went on.

However, in Q3 2018, the indicator suddenly jumped up. A couple of months or so after this happened, the price observed a crash.

As during recent weeks there has been no such sharp increase in the indicator, the analyst believes there is no indication that a decline similar to then would take place now.

BTC Price

At the time of writing, Bitcoin’s price floats around $18.8k, down 4% in the last week.

The value of the crypto seems to have dipped below the $19k level again | Source: BTCUSD on TradingView
Featured image from André François McKenzie on Unsplash.com, charts from TradingView.com, CryptoQuant.com

Why Single-Digit Gains Is The Best Case Scenario For Bitcoin This September

Bitcoin gains for the month of September have been less than encouraging for investors. The month has historically been bearish for the digital asset, which makes it no surprise when multiple dips had begun to rock it. Now, as the month draws to a close, it continues to follow the trend for most of the month. This means that it is likely not to be any significant recovery, and single-digit gains may be the best it can do.

September Proves To Be Deadly

The month of September has not been kind to the digital assets that currently play in the crypto market. From the beginning of the month to the present day, the crypto market has been wracked by dips and crashes, which has left most assets barely holding their heads above others.

For Bitcoin, the effects of the September trend have been quite pronounced. Data shows that for the entirety of the month, the digital asset has only seen low single-digit gains. At this point, the gains of the cryptocurrency sit at 1%, but with the price continuing to succumb to the bear trend, it is possible that bitcoin may dip below this level.

BTC suffers in September | Source: Arcane Research

Bitcoin is also not the only cryptocurrency to suffer such dreary fates. Other indexes, such as the Large and Small Cap Indexes, have all come out even worse. The Small Cap index was slightly below bitcoin in the fact that it was down -1% for the month of September, while the Large Cap Index had seen losses of -2%.

The Mid Cap Index was the only one to see some form of encouraging return. It did about 300% better than bitcoin, with gains of 4% this month, making it the best performer so far.

Bitcoin Doesn’t Get Better

September has been historically bearish, and the events that took place this month did nothing but drive that point further home. With the CPI data release and the FOMC meeting ending with another hike in interest rates, the short-term future does not look too bright for bitcoin.

BTC remains volatile | Source: BTCUSD on TradingView.com

The present single-digit gains that the digital asset is seeing have been much more than anticipated. Even with this, the likelihood that the price of the digital asset would close in the red remains quite high, especially given the sell-offs that have been rocking the market.

Presently, bitcoin is barely holding above $19,000 but is seeing significant resistance at this point. The BTC dominance over the past week has been up, which could lead to a rise in the value. However, even with this, it is unlikely that bitcoin finishes the month with anything more than single-digit gains, if at all.

Featured image from Analytics Insight, charts from Arcane Research and TradingView.com

Follow Best Owie on Twitter for market insights, updates, and the occasional funny tweet…

Bitcoin Perpetual Open Interest Suggests Short Squeeze Led To Crash

The Bitcoin crash of last week was a brutal one for the market. It saw the digital asset lose its footing from where it had been trending just below $30,000 to crash to the mid $17,000s before a recovery had begun. With the new week, the market had started to emerge into the green. But as bitcoin struggles to hold above $20,000, the question remains what had triggered such a crash.

A Short Squeeze

The bitcoin open interest in perps had been up over the last couple of weeks. This has continued to be the case through the market crash and the subsequent recovery. However, the open interest levels, mainly the rise and falls, leading up to and during the bitcoin crash have all of the makings of a short squeeze.

Related Reading | By The Numbers: The Worst Bitcoin Bear Markets Ever

On Wednesday, the open interest in bitcoin perps had eventually peaked at a new all-time high of 335,000 BTC after a week of unpredictable movements. This was when bitcoin had declined below $21,000. As the price of the digital asset had begun its recovery, the open interest in perps had quickly declined. Movements like these are associated with a short squeeze, which was the same in the case. One that preceded another crash during the weekend.

Open interest remains elevated | Source: Arcane Research

The same was the case over the weekend. The open interest in perps had once again surged, to 325,000 BTC this time, after erratic movement when the price declined to the mid $17,000s. Another decline in the open interest has since been recorded as the price of BTC has recovered, albeit slower this time around.

Bitcoin Perps Trading At A Discount

Bitcoin perps are still trading at a discount compared to the spot prices. This is no surprise given that the bitcoin funding rates have stayed neutral to below neutral even through the crash and the massive sell-offs. Additionally, there has been nothing significant that has happened in regards to the bitcoin perps through the crash and eventual recovery,

Funding rates below neutral | Source: Arcane Research

Interestingly, the funding rates have now remained below neutral with the price of BTC struggling above $20,000. One place where funding rates have had the most impact has been on Deribit. Since it is rumored to be closely intertwined with Three Arrows Capital (3AC), the decline in funding rates triggered insolvency fears and rumors tied to the crash of 3AC.

Related Reading | Bitcoin Miner Liquidations Threaten Bitcoin’s Recovery

However, it is important to note that Deribit has assured the public that it remains financially healthy even if the 3AC debts were forfeited. As the market has begun to move on from last week’s crash, the funding rates have begun to stabilize, although they remain slightly below neutral.

BTC declines to mid-$20,000s | Source: BTCUSD on TradingView.com
Featured image from CNN International, charts from Arcane Research and TradingView.com

Follow Best Owie on Twitter for market insights, updates, and the occasional funny tweet…

Bitcoin Derivatives Exchange Reserve Surges Up As BTC Continues To Plunge

On-chain data shows the Bitcoin reserve of derivative exchanges has surged up recently as the price of the crypto has continued to crash down.

Bitcoin Derivatives Exchange Reserve Observes Sharp Uptrend

As explained by an analyst in a CryptoQuant post, the crashing BTC price may be forcing whales and long-term holders to open short positions in order to hedge their portfolios.

The “derivative exchange reserve” is an indicator that measures the total amount of Bitcoin currently present on wallets of all derivative exchanges.

When the value of this metric goes up, it means coins are entering into derivative exchanges right now. Such a trend may mean investors are opening leveraged positions at the moment, which can result in higher volatility in the value of the crypto.

On the other hand, a downtrend in the indicator implies investors are withdrawing their coins from these exchanges currently.

Now, here is a chart that shows the trend in the Bitcoin derivative exchange reserve over the past year:

The EMA 7 value of the metric seems to have observed some uptrend recently | Source: CryptoQuant

As you can see in the above graph, the Bitcoin derivative exchange reserve had been heading down for quite a while, until recently when the indicator’s value once again started rising up.

Recent data suggests that the crash in the coin’s price has pushed around 50% of the total BTC supply into loss. Based on this, many long-term holders and whales are also bound to be underwater right now.

Related Reading | Bitcoin Breaches $19K Level – Will Selloff Continue? What’s The Next Bottom?

The quant believes that the uplift in the derivative reserve is because of these long-term holders and whales panicking about their portfolios losing value.

These holders are looking to hedge their portfolios and reduce risk by opening short positions on derivative exchanges.

The analyst points out, however, that such aggressive shorting would create even more selling pressure, causing the price to see further drawdown.

Related Reading | Bitcoin Long-Term Holders Now Own Nearly 80% Of Realized Cap

But another possibility also arises from this situation, and that would a huge short squeeze. A lot of demand and a sudden reversal in the price of Bitcoin will need to occur before such an event can take place.

The quant thinks it may take more time and further decline in the value of the crypto for the correct conditions to align for it.

BTC Price

At the time of writing, Bitcoin’s price floats around $19.3k, down 29% in the last seven days. Over the past month, the crypto has lost 33% in value.

Looks like the value of BTC has rebounded back a little after a dip below $18k | Source: BTCUSD on TradingView
Featured image from Unsplash.com, charts from TradingView.com, CryptoQuant.com

Has Bitcoin Hit Bottom Yet? Here’s What On-Chain Data Says

Bitcoin continued to crash down yesterday, with the coin hitting as low as $21k before rebounding to current values. Has the crypto made the bottom yet?

Bitcoin NUPL Indicator Assumes Negative Values For First Time Since 2020

As pointed out by an analyst in a CryptoQuant post, the NUPL metric has declined below zero, which could be a sign that the crypto may be approaching a bottom.

The Bitcoin “net unrealized profit and loss” (NUPL) is an indicator that’s defined as the difference between the market cap and the realized cap, divided by the market cap.

In simpler terms, what this metric tells us is whether the overall market is currently holding an unrealized profit or a loss.

When the NUPL’s value is greater than zero, it means the investors as a whole are in a state of profit at the moment.

On the other hand, values of the metric less than zero imply the Bitcoin market as a whole is now holding an unrealized loss.

Now, here is a chart that shows the trend in the BTC NUPL over the last few years:

The value of the indicator seems to have plunged down recently | Source: CryptoQuant

As you can see in the above graph, the Bitcoin NUPL has sharply decreased in value over the past couple of days as the price of the crypto has observed a crash.

The indicator now has a negative value, suggesting that the overall BTC market is now holding some unrealized loss.

Related Reading | Bitcoin Long-Term Holders Realize March 2020-Like Losses As BTC Crashes

The last time the indicator dropped this low was back in March 2020, following the crash caused by the onset of COVID-19.

Historically, Bitcoin has approached a bottom whenever the NUPL metric has reached a negative value of around 0.2.

This is because as the indicator decreases further in value, investors start going deeper into red, and the motive to sell starts dying down.

Related Reading | Bitcoin Weekly RSI Sets Record For Most Oversold In History, What Comes Next?

While the Bitcoin NUPL has now gone below zero, the metric’s value is still larger than it was during the previous bottoms.

So, if a similar trend as those past instances follows now as well, then BTC may have room to decline further still before the bottom is in.

BTC Price

At the time of writing, Bitcoin’s price floats around $22k, down 33% in the last seven days. Over the past month, the crypto has lost 27% in value.

The below chart shows the trend in the value of the coin over the last five days.

The price of BTC has crashed down over the last few days | Source: BTCUSD on TradingView
Featured image from Unsplash.com, charts from TradingView.com, CryptoQuant.com

Bitcoin Slips Below $33k As Exchange Inflows Reach Highest Value Since July 2021

Bitcoin on-chain data shows exchanges this week have observed the largest inflows since July 2021, taking the price of the crypto to $33k.

Bitcoin Exchange Inflows Spike Up To Highest Value Since July 2021

As pointed out by an analyst in a CryptoQuant post, the BTC exchange inflows have observed a sharp increase recently.

The “all exchanges inflow” is an indicator that measures the total amount of Bitcoin moving into exchange wallets.

When the value of this metric rises, it means an increasing number of coins are moving into exchanges. Such a trend may be bearish for the price of the crypto as investors usually deposit their BTC to exchanges for selling purposes.

Related Reading | TA: Ethereum Bears Aim Big After Recent Breakdown Below $2.5K

On the other hand, low values of the indicator suggest that not much selling on exchanges is going on right now. This trend, when prolonged, can prove to be bearish for the value of the coin.

Now, here is a chart that shows the trend in the Bitcoin exchange inflows over the past several months:

Looks like the value of the metric has shot up recently | Source: CryptoQuant

As you can see in the above graph, the 7-day average value of the Bitcoin exchange inflow has observed a spike this week.

The current value of the indicator is the highest it has been since July of last year, around when the coin bottomed around $29k.

Related Reading | Terra Beats Tesla As Second-Largest Corporate Bitcoin Holder After $1.5B Purchase

Looking at the chart, it seems like in the last few months whenever the inflow has spiked up, the price has also declined with it.

This time as well it looks like the heavy selling on exchanges has played a part in the current plunge of Bitcoin below $33k.

The metric’s value still looks to be rising, so it’s possible the coin may observe further decline in the near term, until the 7-day MA inflow tops out.

BTC Price

At the time of writing, Bitcoin’s price floats around $32.9k, down 14% in the last seven days. Over the past month, the crypto has lost 22% in value.

The below chart shows the trend in the price of the coin over the last five days.

The price of BTC seems to have plummeted down over the last few days | Source: BTCUSD on TradingView

Bitcoin’s seemingly endless consolidation looks to have finally broken down as the coin has observed some sharp downtrend in the past week.

At the moment, it’s unclear whether the crypto is nearing a bottom or if more decline is coming. If the inflows continue to increase, then the latter scenario is more likely to play out.

Featured image from Unsplash.com, charts from TradingView.com, CryptoQuant.com

Bitcoin On The Way To $38,000 Amid Global Uncertainty

With the cryptocurrency space being such an angsty place, it’s no surprise that patience is rare. Only two weeks ago, Bitcoin rose 15%+ to near $42,000 only for traders, and retail investors alike become frustrated at how rangebound this world’s most significant digital currency has been in recent days with not much movement up or down since then aside from some tiny fluctuations here and there.

“Do something!” the crowd cried out in unison as they watched their investments plummet towards $43,000. But be careful what you wish for because yesterday’s latest pullback has put Bitcoin on the reverse track. The cryptocurrency could test resistance at $38,000, potentially sending ripple effects throughout all other markets.

Related Reading | Bitcoin Data Shows Profit Taking From Long-Term Holders Behind Decline To $40k

The markets are closely monitoring the ongoing situation in Eastern Europe, with Russia playing chicken at their borders. This is leading investors and traders alike into a state of panic as they await further developments on how this will resolve itself; however, it’s not just Bitcoin that’s affected either. The S&P 500 closed down 2% yesterday due to fears about war becoming increasingly likely across there too. All because one man won’t back down from what he believes his country needs – even if its means risking everything else.

Russia Is The Key Factor Behind Bitcoin Trend

With the probability of World War III, plus potential rate hikes coming into fruition – it’s the last call at an already fading party. The Federal Reserve has been incredibly generous with their entertainments budget over these past couple of years as they endure economic struggles not seen since 1982.

Fear is gripping the crypto markets as investors watch their investments fleeing debasing fiat currencies. However, with Fed Chairman Jerome Powell signaling an aggressive turn toward inflation. Bitcoin’s prime narratives are coming undone, and it’s no longer a haven for escaping this ever-debasing world of currency.

Bitcoin went down to $39,474, breaking its $40,000 support | Source: BTC/USD Chart on Tradingview.com

When everyone else is panicking, it’s an excellent time to buy. A famous quotation from Warren Buffet goes, “Be fearful when others are greedy and be greedy when others are fearful” – well, that seems pretty appropriate right now with Bitcoin closing in on $38,000. That high resistance off-of-$43,000 looks like such an impossible task right now, though.

Related Reading | Crypto Bulls Struggles To Defend Bitcoin’s $40,000 Level

Russia is a very unpredictable factor when it comes to Bitcoin. If Russian President Putin says something, the price of bitcoin can quickly go down or up by several thousand dollars in just minutes from his statement. The country’s leader has constantly been making headlines for years. And will continue doing so as long as there are new updates on what he might say next regarding international issues. Such ​​as alliances with other countries’ leaders.

Featured image from Pixabay and chart from Tradingview.com

Bitcoin Data Shows Profit Taking From Long-Term Holders Behind Decline To $40k

As the Bitcoin price declines to $40k, on-chain data shows long-term holders have harvested some profits recently.

Bitcoin Long-Term Holder SOPR Shows Some Spikes Recently

As pointed out by an analyst in a CrypoQuant post, some BTC long-term holders seem to have participated in profit taking over the past day.

The relevant indicator here is the spent output profit ratio (or the SOPR in brief), which tells us about the profit ratio of the whole Bitcoin market.

The metric works by checking the past history of each coin being sold on the chain to see what price it was moved at before. If this previous price was less than the current one, then the coin moved at a profit.

Similarly, if the current price is higher, then the investor sold this coin at a loss. When the value of the SOPR is above one, it means investors are, on average, selling at a profit right now.

Related Reading | Bitcoin Sentiment Reaches Local High, But Can’t Shake Recent Fear

On the other hand, when the indicator’s value is less than one, it implies investors are selling at a loss overall at the moment. SOPR value exactly equal to one naturally means the market is just breaking even right now.

A version of this Bitcoin indicator takes into account only those coins that hadn’t moved for at least 155 days before being sold. This supply belongs to the long-term holders, and the metric is called LTH SOPR.

The below chart shows the trend in the BTC LTH SOPR over the course of the month so far:

The indicator’s value seems to have spiked up recently | Source: CryptoQuant

The quant has marked the especially large spikes of the Bitcoin LTH SOPR in the above graph. At those points, the long-term holders look to have harvested some profits.

Such a trend has often been bearish, as can be seen in the chart that the price struggled following these large spikes.

Related Reading | Here Are Two Scenarios For Bitcoin A Month Prior To FED Announcing Possible Interest Rate Hike

So, it’s not surprising that the price of the crypto crashed down to $40k shortly after the latest spike in the indicator.

BTC Price

At the time of writing, Bitcoin’s price floats around $40.3k, down 7% in the last seven days. Over the past month, the crypto has lost 5% in value.

Below is a chart that shows the trend in the price of the coin over the last five days.

BTC’s price seems to have plunged down over the past twenty-four hours | Source: BTCUSD on TradingView

Just a couple of days back, the price of Bitcoin seemed to be approaching another retest of $45k, but over the past day, the price has fallen down hard to $40k instead.

Featured image from Unsplash.com, charts from TradingView.com, CryptoQuant.com