Crypto Analyst Predicts $10,000 ATH For Ethereum This Cycle, Here’s Why

Crypto analyst XForce has predicted that Ethereum could reach a new all-time high (ATH) of $10,000 in this market cycle. He acknowledged that there is yet to be a macro fundamental that supports this bullish outlook, but remarked that it remains “ideal.”

Ethereum Eyeing Rally To As High As $10,000

In an X post, XForce stated that Ethereum is still looking to shoot for a new ATH this cycle and could end around $9,000 to $10,000. This followed his remarks that ETH’s move up on the shorter timeframes was objectively impulsive. In other words, these rallies were bullish with real-time technical indicators. 

As to what could drive this Ethereum rally to $10,000, XForce noted that there is no macro scenario providing a good look. However, he remarked that this rally to this ambitious target remains only ideal in nature, given the context. The analyst added that this idea remains his primary prediction for now. 

Ethereum

Crypto analyst Venturefounder also recently predicted that Ethereum could reach this $10,000 price target in this market cycle. However, the analyst declared that ETH’s run to this ambitious target depends on whether the altcoin is able to flip $4,000 into support by the fourth quarter of this year. 

Crypto analyst Titan of Crypto also recently suggested that Ethereum was ready for a lift-off. In an X post, he stated that after a failed breakout, ETH deviated below and found support right on the cloud. Now, the altcoin is back within the range. For a bullish momentum to resume, Titan of Crypto claimed that ETH must clear the cloud and reclaim the Kijun around $2,500. The analyst had previously predicted that Ethereum could rally to $8,500 in this market cycle. 

An Ultra Bullish Scenario For ETH

In response to his initial X post, XForce provided an alternative scenario for Ethereum, in which it could rally to as high as $150,000. The analyst remarked that it would be wild to see this play out, but that it remains an option based on an idealized 5-wave structure. ETH is expected to reach the $150,000 target on Wave 5. 

XForce’s accompanying chart showed that Ethereum could reach this $150,000 target by July 2028. The analyst remarked that the uber bullish scenario remains his alternative because there seems to be no logical approach for ETH to reach such levels. He again warned that neither scenario provides the proper context on the macro, but only remains ideal. As such, based on logic, XForce remarked that it is best to choose the best of the worst. 

At the time of writing, the Ethereum price is trading at around $2,400, down in the last 24 hours, according to data from CoinMarketCap.

Ethereum

Ethereum Daily Transactions Just Hit Its Highest Level Since January 2024, Will Price Follow?

Ethereum has seen a notable spike in its daily transactions after a week filled with uncertain market movement. While the rise in the daily transactions has caught attention, what is really essential to point out is that it has been a long time since the daily transactions have been this high. In fact, the spike has led to the highest level that Ethereum’s daily transactions have been in over 16 months, showing a return to the blockchain that seemed previously abandoned.

Ethereum Daily Transactions Cross 1.7 Million

According to data from the on-chain data aggregation website, Nansen, the Ethereum daily transaction count has spiked by almost 50% over the last few days. The week had begun with the daily transaction count sitting at 1.2 million on Monday. However, by Wednesday, this figure was already changing rapidly to reach new yearly peaks.

As the Ethereum price rose above $2,400, so did participation on the blockchain, leading daily transactions to rise to 1.729 million. This sharp spike has led to the highest level so far in 2025, and is the first time since January 2024 that the daily transactions has crossed the 1.7 million mark.

At the same time, there was also an unusual spike in the daily active addresses, which rose by almost 50% as well in the same time period. The daily active addresses rose from 345,406 addresses to 593,637 addresses in the space of four days.

Ethereum daily transactions

All of these have happened as the Ethereum price has recovered, suggesting that the spike in on-chain participation is actually more from investors buying than selling. If this trend continues, then it could send the Ethereum price soaring higher from here.

Sell Volume Begins Dominating ETH Price

In contrast to the rise in Ethereum on-chain participation, there has also been an increase in the on-chain sell volume compared to the buy volume. Nansen data points out that in the $168.37 million on-chain buy volume recorded in a 24-hour period, approximately $78.15 million was going toward buys, while a little over $90 million was from sellers.

Furthermore, when it comes to individual transactions involved in buying and selling Ethereum, the sellers remain in the lead. There were more than 52,000 buy transactions recorded during this period, with around 24,300 buyers. While the sell transactions ran up towards 74,000, with sellers at more than 32,000. This shows a higher percentage of sellers compared to buyers, which would explain why the price has been unable to reach other support levels.

Ethereum

This rise in the selling volume suggests that the buys are not enough to absorb the selling volume. This could fight off any buying momentum that could lead to a price recovery and keep the Ethereum price down while the crypto market struggles to find its footing.

Ethereum price chart from TradingView.com

Ethereum Not Out Of The Woods Yet: Why Another 30% Crash To $1,800 Is Coming

Crypto analyst Crypto Wave has indicated that Ethereum could witness another significant price crash, presenting a bearish outlook for the altcoin. This price crash is expected to mark Wave C of a corrective move, with ETH dropping to as low as $1,800.

Why Ethereum Could Still Drop To As Low As $1,800

In an X post, Crypto Wave declared that the primary expectation remains that Ethereum will see one more leg down in wave c of wave 2, targeting the zone between $1,950 and $1,700. Specifically, his accompanying chart showed that the largest altcoin by market cap could drop to around $1,800

The crypto analyst revealed that Ethereum has already hit the 0.5 fib retracement at $2,100, which is the minimum target for a Wave 2 correction. However, structurally, he claimed that this drop still looks like wave A only. Crypto Wave further explained that these ABC corrections are always three-part moves, and that is what he sees forming now for ETH. 

Ethereum

The broader crypto market, led by Bitcoin, has bounced back following the ceasefire between Israel and Iran. Ethereum has also rebounded, having dropped to as low as $2,100 last week. However, Crypto Wave suggested that the current market sentiment doesn’t invalidate this bearish setup for ETH and that it could still witness a deeper sell-off. 

The crypto analyst alluded to the fourth quarter of last year when Ethereum was underperforming heavily while many altcoins rallied. In line with this, he remarked that there could be a repeat of this scenario. However, on the other hand, Crypto Wave claimed that if ETH breaks above $2,880 impulsively, especially in one clean wave, then the correction could be over. He added that this would also put the altcoin in the early stages of a new bull cycle.

2021 Pattern Playing Out For ETH

In an X post, crypto analyst Merlijn drew similarities between the current Ethereum price action and that of 2021. He stated that the 2021 playbook is repeating, with ETH having a dead count bounce, then a final retest before the parabolic leg. The analyst expects the altcoin to retest the $2,000 level before the massive move to the upside. 

His accompanying chart showed that Ethereum could rally to as high as $11,000 on this uptrend. Merlijn had remarked that ETH has more firepower this time around than in 2021, which is why the altcoin could witness such a parabolic move to the upside. Interestingly, based on the chart, this rally is expected to happen between now and year-end.

At the time of writing, the Ethereum price is trading at around $2,480, up over 2% in the last 24 hours, according to data from CoinMarketCap.

Ethereum

The Ethereum Waiting Game: Breakout To $2,800 Or Crash To $2,000?

After suffering a major price crash back during the weekend, the Ethereum price has enjoyed an over 10% bounce that has put it back above major support levels. However, even with the recovery, the altcoin sits on shaky ground with geopolitical and macroeconomic factors still unstable. On the charts, there is also uncertainty as the second-largest cryptocurrency by market cap has failed to make any definitive moves from here, showing inconsistencies in movement.

Ethereum Price Struggling At EMA

Crypto analyst Swallow Academy noted that the Ethereum price has returned to trading at its Exponential Moving Average (EMA) earlier in the week after bouncing from its weekend lows. This has been referred to as the level of interest and sits around the $2,400 level, which has served as major support in the past.

The harsh drop from the weekend that pushed ETH from $2,500 to $2,150 has no doubt dented sentiment and sparked caution among investors. But the retest of the EMA at $2,400 suggests that buyers are still exerting their force and have been pushing up the price.

Given these recent developments, the crypto analyst explains that it is currently a waiting game for the Ethereum price. From here, it could go either way, as confirmation is needed for which direction it is headed next. A breakout from here could move it back above the $2,800 resistance. However, a crash could be confirmation of rejection, sending Ethereum spiraling back toward lows at $2,000.

Ethereum price

Mapping Out Next Steps

As the Ethereum price continues to show signs of continuation, crypto analysts have begun to map out where the altcoin might be headed next. Mister Spread pointed to the fact that Ethereum had actually shown a bullish Power of 3 (PO3), consisting of accumulation, deviation, and expansion.

The accumulation phase has been completed, and is now in the phase of deviation, explaining the price crash. Now, the price seems to already be breaking out of the deviation box, suggesting that the expansion phase will be coming sooner than expected.

Ethereum price 2

Once the expansion phase is in motion, the crypto analyst expects the Ethereum price to move back into the supply area of $2,800-$3,000. However, if the price fails to climb and falls back below $2,100, then this bullish thesis would be invalidated.

Ethereum price chart from TradingView.com

Ethereum Price Crash To $2,100 Triggers Fear, But Why Are Analysts Predicting A Rally To $6,000?

Ethereum’s price action in the past 24 hours has been characterized by a fall toward $2,100 before rebounding to the upside very quickly. Ethereum’s price dropped to $2,130 in the past 24 hours on crypto exchange Coinbase amidst a broader fall in the crypto industry, which also saw Bitcoin break below $100,000 very briefly. 

Despite the sudden Ethereum price correction, analysts have presented arguments that hint at a strong Ethereum rally once this current downturn is complete. Notably, their projections are not short-term, and one of them puts Ethereum’s next major target around $6,000.

Wave A Complete, But Downside Likely Before Rally

The first detailed analysis came from @CryptoWaveV, a trader who uses Elliott Wave Theory to forecast market structure. According to his recent post, Ethereum’s price has now completed what he considers to be wave A of a larger corrective structure. His chart shows Ethereum breaking down from a high around $2,900 and falling almost directly into a Fibonacci-based support zone between $2,134 and $1,957.

Now that the Wave A pattern is complete, the prediction is a short-term bounce to as high as $2,792 as part of a wave B retracement. However, this upward move would likely be temporary before another Wave C leg downward, which could drive the Ethereum price to as low as $1,706 before a meaningful bottom is confirmed. 

Ethereum

This level is what the analyst refers to as his “ideal buy zone” for long-term accumulation. Although the short-term view includes price crashes, a full bullish impulse will resume once this corrective phase is complete.

Wyckoff Structure Points $6,000 ETH Price

Merlijn, a popular analyst on X, shared a contrasting yet converging perspective. In this case, the analyst’s outlook is based on Wyckoff’s accumulation framework. Merlijn stated, “Ethereum: Wyckoff says go.” 

According to the daily price chart that followed his analysis, the analyst showed that the crypto had already completed the spring and test phases, which are both components of a Wyckoff accumulation pattern. What comes next, according to the Wyckoff method, is the markup phase. 

The chart Merlijn posted aligns with this outlook. The chart projected that Ethereum will reclaim a horizontal range between $2,150 and $2,450, followed by a steady progression above $3,850, and then another strong move past $4,800, before ultimately culminating around $6,800 to $7,000. This bullish setup suggests that while the recent dip to $2,100 might have shaken confidence, it may have served a larger structural purpose. The spring and test patterns imply a final shakeout of weak hands, clearing the path for long-term buyers to step in.

Finally, the outlooks from both analysts converge on a six-month to one-year trajectory that could see Ethereum breaking into the $6,000 range, if not higher. At the time of writing, Ethereum is trading at $2,420, up by 7.4% in the past 24 hours.

Ethereum

Ethereum Bounces Hard After Support Bluff, A False Alarm Or Fresh Rally?

Ethereum just pulled a surprise upward move after dipping below key support and its rising trendline. The sudden rebound caught bears off guard, fueling speculation about whether this was a mere fakeout or the start of a fresh rally.

Fakeout Fools The Bears: Ethereum Reclaims Critical Support

In a recent post on X, UniChartz drew attention to a classic fakeout move by ETH, where the price momentarily dipped below a significant support level and an ascending trendline, only to reclaim both shortly after. This sudden reversal disrupted bearish expectations, especially for those anticipating a deeper drop. Instead of confirming a breakdown, ETH snapped back above the key zone with notable strength, shaking up short-term sentiment.

According to UniChartz, this kind of false breakdown often traps bearish traders and can act as fuel for an upward move if momentum builds. The reclaim of the support zone is a strong technical signal, indicating that bulls are still in control for now. It not only invalidated the bearish thesis but also injected fresh optimism into the market, hinting at the possibility of a short-term rally.

Ethereum

Still, UniChartz cautioned that follow-through is critical. If ETH can hold above this reclaimed area and form higher lows, it could set the stage for continued upside. However, any weakness or failure to maintain the level could lead to another shakeout. 

From Breakdown To Breakout? Key Levels In Focus

After reclaiming the previously lost support level, Ethereum is showing signs of strength, but whether it can sustain this momentum remains the key question. The bounce has surprised many, especially after what looked like a clean break below a rising trendline and horizontal support. The current price action suggests bulls are regaining control, but the road ahead is lined with several resistance hurdles that could stall or reverse the advance.

The first level to watch lies around the $2,858 level, where Ethereum previously struggled to maintain traction. This area marks a confluence of short-term resistance from prior price rejections. A decisive close above this could open the door for a push toward $3,360, a level that has historically acted as a pivot zone and may attract both profit-taking and fresh short positions.

Beyond that, the $3,659 level stands as a key psychological and technical barrier. This region is where bears have previously reasserted control, and reclaiming it would be a statement of intent from the bulls. Only a sustained break above this zone, ideally on strong volume, would signal a shift back toward a more dominant uptrend, potentially eyeing $4,100 and beyond.

For now, the reclaimed support offers a solid base, but Ethereum’s upward journey depends on the bulls defending it convincingly and clearing these major resistance zones with strength and consistency.

Ethereum

Is Ethereum Staging A Repeat Of 2021? Here’s Why A 200% Surge Could Follow

Ethereum saw a notable decline in its price over the last week, and the weekend culmination pulled the price back towards levels not seen in over one month. The movement tracks with the established bearish trend of the month of June and continues to show mounting sell pressure on the cryptocurrency. However, with this decline has emerged a trend similar to what was seen back in 2021, right before the market picked up and saw the beginning of the altcoin season.

Ethereum Price Crash Similar To 2021

Looking at the current Ethereum price action and that of what was seen back in Q2 2021, there have been some striking similarities. Most especially, how the Ethereum price has performed in the month of June so far has been the same as what happened back in June 2021.

In 2021, the Ethereum price began the month of June trading above $2,600. However, as the month went on, the altcoin suffered multiple declines and crashed below $2,000 before it was over. Eventually, the price would find its bottom somewhere around $1,600 before the decline was over.

Ethereum price chart from TradingView.com

Fast forward four years to the year 2025, and the month of June is showing the same trend. June 2025 had begun with the Ethereum price trending above $2,600 before the bears took control. Since then, the altcoin has crashed by more than 20%, and looks primed for more.

Ethereum price chart from TradingView.com

Using the historical performance, it would suggest that the Ethereum price decline is far from over. If there is a repeat of June 2021, then Ethereum could suffer another 20% crash before the month of June is over, to find its bottom somewhere between $1,600 and $1,700.

The Trigger For Altcoin Season

Given that Ethereum is the largest altcoin in the market, it is naturally the trigger for the altcoin season. Looking back on 2021, the altcoin season began when the Ethereum price began to rally. But the recovery did not begin until the month of July, and eventually lasted into the month of November.

So far, investors are already looking positively toward July 2025, as there have been rumors of a rate cut. This is expected to trigger a market rally for risk assets such as Bitcoin and Ethereum, coupled with the fact that a resolution to the Iran-Israel war could be in the works.

If this trend holds, then it is possible that the Ethereum price would begin to rally in July. As seen in 2021, Ethereum would end up rising over 200% in the course of five months, to put in a new all-time high in the month of November.

$312M ETH Transfer Triggers Sell-Off Fears As Ethereum Price Crashes Below Support

Blockchain tracking service Whale Alert posted a major alert showing that 129,392 ETH was transferred from an unidentified wallet to Coinbase as the Ethereum price tumbled. On-chain data from Etherscan shows that this particular wallet had not been involved in the transfer of large ETH volumes since November 2022. This sudden reactivation and deposit into a centralized exchange opens up speculation of a looming selloff, especially given the timing of the transfer.

Massive ETH Transfer As Middle East Tensions Escalate

Whale transaction tracker Whale Alerts, which initially reported the transfer on the social media platform X, noted that at the time of the transfer, these 129,392 ETH were worth $312,981,377. The timing of the transfer is noteworthy because it occurred when the price of Ethereum failed to hold above $2,500 and had already begun to struggle to stay above $2,400. 

Etherscan’s tracking of on-chain transactions indicates that the unknown wallet “0xd47b,” which was involved in the transfer, has been relatively inactive since late 2022. Particularly, its last transaction was an inflow of 6,469 ETH from another wallet linked to Coinbase. 

The latest transfer into Coinbase leans more towards the possibility of a selloff through the exchange. Since then, the Ethereum price has lost a key support level at $2,450. Its price has fallen notably in the past 48 hours

Although other factors are clearly contributing to the dip, particularly new geopolitical tensions after the US launched attacks on Iran, this whale deposit into Coinbase may have increased the downward pressure. Exchange inflows of this magnitude are a precursor to liquidation, particularly now that investor sentiment is on edge.

Bearish Setup Confirms Downside Targets

The technical picture for Ethereum is now turning bearish, at least in the short term. Technical analysis of Ethereum’s 4-hour chart on the TradingView platform shows a clear bearish breakdown setup after Ethereum broke below a crucial support line at $2,362. That support level has now been breached, and confirmation of the breakdown amplifies a bearish case moving forward. 

Ethereum price

Chart Image From TradingView

The chart above, which includes overlays of the Ichimoku Cloud, shows a fading bullish momentum in the past few days. Previous failed attempts to break resistance have left Ethereum in a vulnerable zone, and the recent whale selloff may have delivered the final push needed to trigger this leg down. 

If the current trajectory continues, Ethereum could be on its way to retesting lows below $2,000. According to the TradingView analysis, potential reversal targets are at $2,151 and $1,954, with a third possible level at $1,750 if the selloff is more than expected. At the time of writing, Ethereum is trading at $2,290, down by 5.5% and 10% in the past 24 hours and seven days, respectively.

Ethereum price chart from TradingView.com

Analyst Predicts 20% Ethereum Price Crash Below $2,000, Here’s Why

While the Bitcoin price stays close to its all-time highs, the Ethereum price has done pretty much the opposite. This failure to perform has put intense bearish pressure on the altcoin market as a whole, and the resulting price action has triggered what is seemingly a bear market for altcoins. Even now, the Ethereum price has not shown any signs of a bullish recovery, with expectations remaining bleak at this level, and analysts predicting further crashes.

Why The Ethereum Price Is Headed Below $2,000

Crypto analyst Maddox Metrics has given the short and long-term outlook for the Ethereum price, and it seems the current market decline is nowhere near its end. In the short term, Maddox expects the Ethereum price to continue to decline and, in fact, fall below some major support levels.

As the crypto analyst explains, investors are already expecting the ETH price to actually fall lower toward the $1,900 target. And as shown in the analyst’s chart, this would actually be the second wave of the 5-wave count as Ethereum moves into its long-term potential.

While there has been a lot of buying, especially among institutional investors and ETF issuers, the Ethereum price continues to trend low. The analyst attributes this to the rising war tensions in the Middle East, as fears of World War 3 grow more intense.

At this level, the analyst cautions investors to look toward a more patient strategy, saying that “Money is made in the sitting, weathering volatility, not flipping in and out of trades on every bit of news and price movement.” Thus, it is better to hold positions until the market finds its stable point.

Ethereum price

ETH Still Bullish In The Long-Term

Despite the wave pattern pointing to a crash below $2,000 in the short term, the analyst says the long-term outlook for the Ethereum price remains bullish. The current decline, which is a Wave 2 retracement, the analyst explains, marked the end of a motif wave at the $2,700 resistance.

This suggests that once the current wave ends, there is the next wave, which is the bullish Wave 3. Once this is underway, the analyst’s chart shows a possibility of this wave carrying through to a new all-time high just under $5,000.

The 4th wave is naturally bearish and will trigger a crash, while the 5th and final wave will send the Ethereum price to $7,000. The timeline for this to happen, as shown in the chart, will be through the year 2025 and into the early months of 2026.

Ethereum price chart from TradingView.com

Ethereum Bullish Wave Towards ATH Coming? Here Are The Targets

Recent price action in the past 24 hours has seen Ethereum clawing back above $2,500 after a pullback that saw its price fall to a low of $2,440. This is a notable correction from Ethereum’s foray to $2,770 in the past seven-day timeframe, but according to crypto analyst KledjdiCuni, it aligns with one of the anticipated price scenarios.

Now, the analyst’s outlook is of a reversal into a bullish wave. In his latest update, KlejdiCuni laid out several upside targets that traders may want to keep in focus if Ethereum confirms a breakout.

Accumulation And Bullish Setup Toward $2,800 Breakout

Crypto analyst KlejdiCuni, posting on the TradingView platform, believes Ethereum may now be on the verge of initiating a much larger bullish trend. According to his analysis, the $2,440 region held up as expected, confirming it as a strong accumulation zone. 

In the daily candlestick price chart he shared, KlejdiCuni illustrated what he identifies as a bullish pattern. This pattern is a formation of higher lows and relatively stable resistance near the upper boundary. This setup resembles an ascending channel structure, which suggests that buyers are gradually taking control of Ethereum’s price action.

Ethereum

Ethereum’s rebound to $2,660 has formed a structure that could break above the current pattern, likely in the direction of $2,800. This aligns with the upper resistance boundary of the bullish pattern, and as such, it is the first immediate target to look towards for a breakout to higher price levels.

Price Targets For Ethereum

If Ethereum successfully breaks above the $2,800 resistance level, the bullish momentum could signal the start of the expected bullish trend, according to the analyst. In this case, the first major target in this sequence is $3,300. Ethereum’s reaction here would be one to watch, as it coincides with a resistance level in late January 2025 that eventually broke to the downside in early February 2025. If Ethereum manages to clear this zone, it would confirm a sustained buying interest. 

Should Ethereum maintain its upward pressure beyond $3,300, the next target is at $3,800. This level carries particular technical significance, as it coincides with an order block in early January that caused the initial rejection as it tried to push toward the $4,000 price level again. Breaking through $3,800 to the upside would be an indication that bullish sentiment has taken firm hold across higher timeframes again. 

Finally, if the bullish wave extends uninterrupted, the analyst projects a longer-term target of $4,500. This level is only a short distance from Ethereum’s all-time high of around $4,878, and reaching it would represent a near-complete recovery from the prolonged bear market. Hitting $4,500 would also place Ethereum at new price highs for this cycle

At the time of writing, Ethereum is trading at $2,521, having retraced by 0.7% in the past 24 hours.

Ethereum

Is Ethereum Price Set To Repeat History As 2017 Playbook Returns? Why This Time Could Be Bigger

The Ethereum price action is showing remarkable similarities to its 2017 market cycle, with analysts pointing to a near-identical technical setup and market behaviour. Crypto analyst Merlijn the Trader, who shared a side-by-side weekly chart comparison of 2025 and 2017 on X (formerly Twitter), suggests that Ethereum is now following the same breakout pattern that once led to a historic rally. This time, however, the analyst believes that the move could be even more significant. 

Ethereum Price Mirrors Historic Breakout Pattern

In the current 2025 chart, Ethereum has reportedly claimed the 50-week Moving Average (MA) after months of downward pressure and range-bound movement. Following a decisive breakout from support levels near $2,250, the price of the cryptocurrency is now consolidating below the 50 MA, forming a tight sideways pattern. 

According to Merlijn the Trader, this structure is visually and technically similar to price movements that occurred in late 2016 and early 2017, just before Ethereum began a powerful upward surge. The analyst’s 2017 Ethereum chart shows the altcoin breaking above the 50 MA, followed by a brief period of sideways action under resistance. Once momentum was built, the price launched into a parabolic rally that marked the beginning of its major bull cycle. 

Ethereum

Notably, the 2025 chart situated on the right panel displays an almost identical playbook to the 2017 setup, with Ethereum moving out of a prolonged accumulation phase and into a zone of consolidation beneath key resistance levels. However, this time, market conditions are significantly different. 

The analyst notes that the crypto space is far more developed, with increased institutional involvement, broader retail adoption, and growing infrastructure supporting Ethereum’s ecosystem. While the technical patterns align closely with the 2017 breakout, the scale and context suggest that the potential upside could even be greater. 

The similarities between Ethereum’s 2017 and 2025 price action lie in the timing of the 50 MA reclaim and the tight range of consolidation that follows. If ETH can maintain this trajectory and break above the current resistance zone, it could mark the beginning of a fresh macro rally, which the analyst predicts will not just repeat history but possibly amplify it. 

Ethereum Eyes $4,000 As 2017 Pattern Repeats

Based on Merlijn The Trader’s comparable chart analysis, Ethereum may be on the verge of a major breakout, with technical patterns pointing to a potential price target above $4,000. In the 2017 setup, Ethereum skyrocketed past $28 from a low between $6 and $7.5 after reclaiming the 50 MA.

If history is any guide, Ethereum’s next move could propel it from its current price of $2,541 to $4,000, which aligns with the upper red horizontal line on the 2025 price chart or above the line to fresh all-time highs, with no ceiling in sight, according to the analyst.

Ethereum

Ethereum Slows Down In June: Historical Data Says More Losses To Come

Ethereum is already seeing a slowdown for the month of June, suggesting that it is sticking to established historical trends for the month. With half of the month already gone, the altcoin is likely to finish out the month in the same trend, and the previous cycle data warns of further price crashes. But how far down will the Ethereum price go before it recovers?

Ethereum Fighting The Bears In June

According to data from the CryptoRank website, the month of June is the second-worst month for the Ethereum price historically. This comes down to its average and median returns, which sit at -6.56% and -5.65%, respectively, showing that returns for the month are likely to be red. It falls behind only the month of September, which has -10.7% average returns and -13.6% median returns.

In the decade that the Ethereum cryptocurrency has existed, only a total of three years have the month of June ended in green. In contrast, six years have closed in the red, including back in 2024 when the Ethereum price tumbled 8.64% in June.

So far, the month of June 2025 has seen very little gains, with CryptoRank data only showing a 0.20% increase at the time of writing. This suggests a continuation of the established bearish trend, especially with the bear still pushing down the price of Bitcoin, and the rest of the crypto market keeps going down with it.

If the altcoin does stick to its historical performance, then it is possible that the price could break below $2,500 before the month is over. However, there is still the possibility of a recovery if the Bitcoin price does continue to rise.

Bullish Sentiment Still Strong

Despite the bearish trend of June, crypto analysts are still calling for higher prices for Ethereum. One analyst, Crypto Patel, predicts a possible short-term crash if the Ethereum price drops below $2,500. Patel believes $2,000 is next if this happens. However, long-term remains bullish as the crypto analyst believes Ethereum is headed for $10,000.

Another crypto analyst, Ash Crypto, pointed out that ETH is forming a possible golden cross, just one month after Bitcoin did. But unlike Bitcoin, which usually takes months to play out a golden cross trend, the crypto analyst says Ethereum will begin immediately, and the target from here is $3,500.

Crypto analyst Lord of Alts also explained that Ethereum is actually playing out as expected, with three trends. The first is consolidation, then accumulation, before ending in a price expansion. Lord of Alts says ETH is entering this trend again and puts the price as high as $6,000 by 2026.

Ethereum price chart from TradingView.com

Ethereum’s $4K Target Within Reach, Here’s What Needs to Happen First

The crypto market has been experiencing a rebound during today’s session with Ethereum showing strong momentum. The second largest crypto by market cap has been trending sideways displaying an increasing selling pressure on higher timeframes, but today ETH holders seem hopeful of further gains.

At the time of writing, Ethereum is trading at around $2,600 with a 3.5% gain on the past 24 hours. Over the past week, the ETH price shows larger gains with 4.3% returns, the best performance on this timeframe amongst the biggest cryptocurrencies.

ethereum price ethusd eth price

Ethereum Price On Brink Of Massive Recovery

According to Daan Crypto, the current price action for Ethereum shows classical signs of compression. This action is usually recorded when an asset is about to experience a massive spike in volatility, either to the upside or the downside.

The analyst pointed out that Ethereum has been trading in a tight range, trapped between two critical levels. If buyers manage to push the price above the first of these levels, sitting at $2,851, then the second crypto by market cap is likely to trend to the upside.

Ethereum price ETHUSD

On the contrary, if sellers regain control over the ETH market, and price dips below its current levels, then the price is more likely to return to the bottom of its current range, sitting at $2,168.

Daan Crypto stated the following, warning his followers on taking positions as the Ethereum price consolidates:

ETH Price action is compressing right below this big $2.8K level. If we’d see a convincing break above $2.8K and hold there, that would be a good setup for a move to the cycle highs around ~$4K. If we do lose this current range then $2.1K is the big high timeframe level to watch. No reason to get over excited in either direction until this current consolidation/compression resolves.

ETH Price Rally to Ignite Massive Alt Season

On a separate note, analyst Cantonese Cat showed the Ethereum price dominance chart, used to gauge the percentage of the total crypto market cap represented by ETH. As seen in the chart below, this chart is tightly compressed according to the Bollinger Band indicator.

When these bands compressed, they hint at an upcoming violent move suggesting that Ethereum will abandon its current range soon. If the crypto rallies, then other altcoins are likely to follow and kickstart the beginning of a global upward trend for these assets.

Ethereum price ETH ETHUSD chart 2

On the upcoming alt season, Jameson Lopp, Co-Founder and Chief Security Officer at crypto custodian CASA, stated the following noting the potential new variables that will trigger it:

Altseason is coming, just not how you think. Instead of being driven by new tokens on crypto exchanges it will be from new equities on tradfi exchanges.

Cover image from Unsplash, ETH/USD chart from Tradingview

Ethereum Price Could Rally To $10,000 If This Major Resistance Is Broke

Ethereum’s price action this week has been very notable, with the leading altcoin breaking above $2,800 again for the first time in four months. Ethereum managed to break above the $2,800 mark for the first time since February, briefly touching $2,870 before pulling back slightly. 

Two separate analyses by crypto strategist Crypto Patel on the social media platform X suggests Ethereum is now on the right track. The first, based on an 8-hour chart, highlights a rally toward $4,000. The second, using a long-term two-week timeframe, outlines a bullish setup that could send Ethereum soaring to $10,000 and beyond.

Ethereum’s Breakout From Sideways Consolidation Zone

In a recent analysis shared on X, a crypto analyst known as Crypto Patel highlighted Ethereum’s attempt to break out of its established range. Using the 8-hour candlestick chart, he pointed out how the Ethereum had spent many weeks since early May trading between clear support at $2,366 and resistance around $2,734. The breakout seen on the chart occurred just above this resistance zone, when Ethereum briefly pushed past $2,800 before facing some rejection.

Ethereum

If this breakout holds above $2,800, Ethereum could initiate a steep upward rally toward the $3,500 to $4,000 region in the coming weeks. Crypto Patel noted the importance of watching whether Ethereum sustains above the $2,750 breakout line, as a successful confirmation could trigger an influx of bullish momentum.

Ethereum’s To $10,000 In The Long-Term

In a follow-up post analyzing a much larger timeframe, Crypto Patel shared a two-week candlestick chart that mapped Ethereum’s longer-term structure since 2018. The chart revealed a well-defined bullish setup, including a bounce from a key bullish order block around $1,400 in April. This bounce acted as a support level, with the resulting candlestick being a bullish one that broke through another order block between $1,700 and $2,500.

Patel pointed out that Ethereum is now showing signs of a long-term bullish continuation pattern. With support levels already locked in for the next bear market, the analyst projected a target above $10,000, citing a 438% upside potential from current price levels. The chart also marks $2,500 as a structural pivot point, with Ethereum’s ongoing upward trajectory expected to strengthen if this support level continues to hold.

Therefore, the path to $10,000 will depend on Ethereum’s ability to turn its recent resistance break into sustained momentum. The $2,800 region must now serve as a support base rather than a resistance ceiling. However, this has failed to really materialize in the past 24 hours, as Ethereum is currently down by a massive 9.6%. 

The ensuing price action has seen the leading altcoin now back trading within this consolidation range. Failure to hold above $2,500 could cascade to more losses over the weekend until it closes on $2,366 again and probably initiate another bounce from here.

Ethereum

Crypto Expert Puts Ethereum Price At $19,500 With Head And Shoulders Emergence

Ethereum reclaimed a significant technical level in the latest 24-hour trading session, with its price crossing above the $2,800 mark and briefly touching $2,870. This interesting cross makes it the first time since February 2025 that Ethereum has traded above the $2,800 threshold. The move comes amid rising bullish momentum flowing out from Bitcoin, and according to recent analysis from a crypto expert, this could be just the beginning of a much larger rally for Ethereum.

Technical Pattern Says Ethereum Could Be Close To $20,000

An interesting technical formation on Ethereum has now caught the attention of some traders: a classic inverse Head and Shoulders bottom. According to crypto expert Gert van Lagen, who shared his analysis on the social media platform X, this inverse head and shoulders is setting up on a long-term timeframe. 

Specifically, Ethereum’s two-week candlestick chart, shared by the analyst, reveals a fully formed structure with a left shoulder in mid-2021, a pronounced head that took shape during the bear market in late 2022 to early 2023, and a right shoulder forming throughout the 2024 correction into early 2025. 

Ethereum

The left shoulder emerged in mid-2021, when Ethereum’s price peaked around $4,870, then retraced into the year-end. The head was formed at the lows around $1,350 in 2022 and 2023. The right shoulder is currently in formation after the Ethereum price rebounded from roughly $1,600 in 2025. Finally, this pattern is also highlighted by a symmetry around the neckline drawn near the $4,200 price region. 

Keeping this in mind, the neckline of the pattern, which is anchored just below the $4,200 resistance level, is now the most important level to break above. A confirmed breakout above this zone could activate the full bullish target projected by the technical formation.

ETH Price Close To $20,000

According to Gert van Lagen, the two-week head-and-shoulders pattern suggests Ethereum may be “closer to $20K than most anticipate.” His price target calculation follows a classic technical methodology. By measuring the vertical distance from the head’s lowest point to the neckline resistance and then projecting that same distance upward from the neckline, he arrives at a target of approximately $19,500, which is more than a 600% gain from today’s price levels. 

In the same analysis, van Lagen also highlighted a descending broadening wedge pattern that has been forming since mid-2023. This secondary structure reinforces the notion that Ethereum may embark on a significantly larger breakout once $4,200 is cleared.

However, this projection of $19,500 is based on the technical symmetry of the inverse head and shoulders pattern, rather than fundamental shifts in Ethereum. Additionally, there is no clear timeline for this target; however, based on the multi-year nature of the inverse head and shoulders pattern, the price target may also take up to four years to materialize.

At the time of writing, Ethereum is trading at $2,772, having retraced slightly from $2,870.

Ethereum

Ethereum Staging A Repeat Of Bitcoin’s 2021 Cycle? Here’s The Target

With the recent Ethereum price trend, a crypto analyst has pointed out that the altcoin could be looking to stage a similar rally to what was seen with Bitcoin back in 2021. Crypto analyst TradingShot pointed out the similarities in a recent analysis and showing where the price could go if it does play out the same way.

Ethereum Looks Like Bitcoin Did In 2021

In the analysis posted on TradingView, crypto analyst TradingShot showed how this Ethereum cycle movement looked similar to Bitcoin’s 2021 cycle movement. The first of this was recovery from a major price crash that led to new cycle lows for the cryptocurrency, before staging a recovery that pushed it toward new highs.

For Bitcoin, the crash happened when the COVID-19 lockdown was announced. Following this, the Bitcoin price had fallen more than 50% from above $9,000 to less than $4,000 in less than one month. However, after this, the Bitcoin price rebounded from the cycle lows, crossing the 1-week MA50, and then breaking the lower high trendline, and going on to reach new all-time highs.

For Ethereum, the crypto analyst pointed to the price crash triggered by Donald Trump’s tariff wars as being similar to Bitcoin’s COVID crash. After Donald Trump announced tariffs on other countries, the Ethereum price also crashed by a large margin, going from above $2,400 to below $1,500 in less than a month. This has been dubbed the ‘Trade War Crash’, and the altcoin is still reeling from the decline.

Currently, the Ethereum price is stuck at the point where it is still trying to break above the 1-week MA50, which is now the major level to beat to confirm this trend. Just like Bitcoin, it has also seen the formation of major resistance at the lower highs, and this sits right at the $4,200 level. This means the Ethereum price still has around a 50% rally to complete before it confirms a similar trend to Bitcoin.

Ethereum Bitcoin

How High ETH Price Could Go If It Plays Out

If Ethereum does reclaim the 1W 50MA and then breaks the lower highs at $4,200, confirming this trend, then the resulting rally could be exceptional. For example, after breaking the lower highs, the Bitcoin price went on to reach new all-time highs of $69,000 in 2021. This means that the price went from below $4,000 to $69,000 in the space of a year.

A similar rally would mean that the Ethereum price would rise above $10,000. Taking the same timelines into position, it would put ETH at this price sometime in 2026, a year from when the Trade Wars crash had occurred. A closer parabolic rally and an imitation of Bitcoin’s 1,700% rally would mean a price tag above $15,000 for the second-largest cryptocurrency in the space.

Ethereum price chart from TradingView.com

Ethereum Charts Flash Rare Signal Not Seen in Years, Says Analyst

In his latest macro-technical analysis, crypto strategist Kevin (@Kev_Capital_TA) has flagged a potentially pivotal moment for Ethereum (ETH), arguing that a confluence of rare monthly chart signals—some not seen in years—could be laying the groundwork for durable altcoin outperformance. Speaking in a video posted June 9, the analyst described the current Ethereum setup across multiple timeframes as “something we’ve never seen before,” drawing comparisons to historical signals that preceded major rallies in 2016, 2018, and 2020.

Ethereum Primed For Macro Breakout

Kevin emphasized that Ethereum now exhibits strong bullish momentum across its USD pair, dominance chart, and ETH/BTC ratio, pointing to a simultaneous alignment of several high-time frame indicators. “These are things that just don’t pop up every day,” he said. “Matter of fact, these are things that have almost never popped up in such confluence throughout history for Ethereum.”

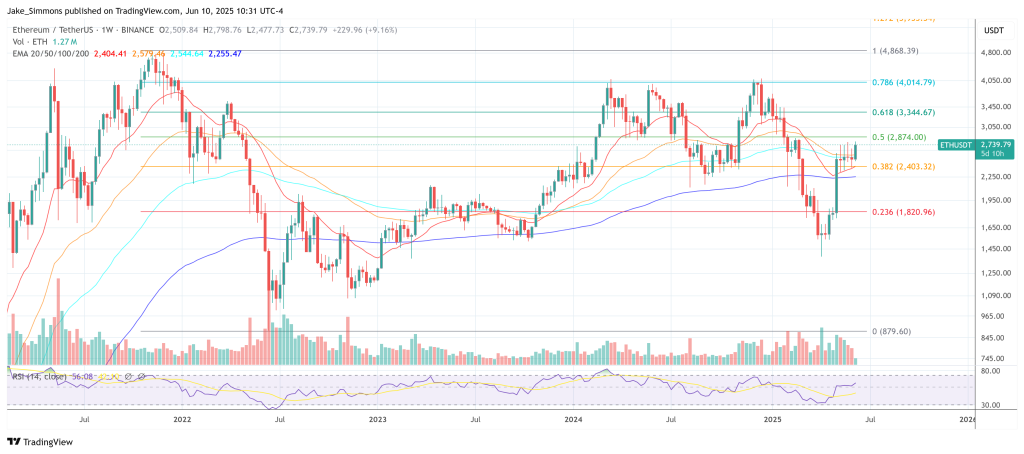
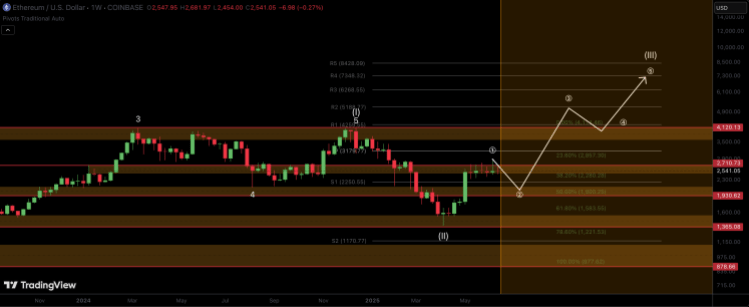
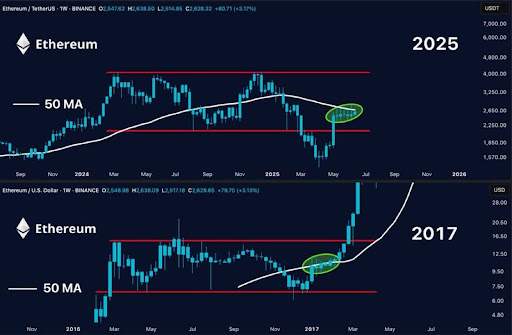
The core of Kevin’s thesis hinges on what he calls a “monthly demand candle”—a large, typically green candlestick that emerges after a protracted correction. Ethereum printed such a candle in May 2025 following nearly a year of sideways chop and five months of drawdown. Historically, these demand candles have marked the start of significant uptrends. Kevin cited analogous structures in 2016, 2018, and during the COVID-19 crash in 2020, all of which preceded multi-month rallies.

Ethereum price analysis

“This may be the most textbook demand candle we’ve ever had,” he noted, adding that “the last time we saw something like this was before ETH ran for nearly a year with barely any major correction.”

Supporting the candle analysis is a synchronized bullish turn in several technical indicators. The Market Cipher momentum wave has clipped into the oversold zone and printed a confirmed green dot buy signal. Simultaneously, the VWAP—volume-weighted average price—has crossed above the zero line, and money flow has started to trend upward. Kevin was explicit about the importance of this configuration: “Let me tell you something: this is a big deal.”

The monthly RSI, currently sitting at 51, has not yet broken the crucial 70-level that historically marks the onset of parabolic price action. According to Kevin, “ETH has never even broken 70 this cycle. You haven’t seen what’s possible yet for Ethereum—or for altcoins in general. You’ve seen nothing yet.”

He also highlighted the return of whale accumulation, measured through a proprietary “whale money flow” indicator. After exiting ETH positions for over a year—from March 2024 to May 2025—whale flows have shown a V-shaped bottom and are now turning up. “We are now starting to see accumulation durably here,” Kevin said. “You keep hearing that BlackRock’s buying ETH, and I don’t know if that’s reflected in this indicator, but we are definitely seeing whale activity occur on the monthly time frame.”

The analyst went further, showing that Ethereum’s stock RSI on the monthly timeframe has not only bottomed out but is now rebounding sharply—a pattern that historically precedes long-duration uptrends. “This is aggressive movement,” he explained, noting that for confirmation, the RSI still needs to cross the 20-level, but emphasized that the current shape of the rebound is stronger than in previous cycles.

Ethereum Shows Relative Strength

Another key piece of the puzzle is Ethereum’s dominance chart, which tracks ETH’s market cap relative to the rest of the crypto space excluding Bitcoin. Kevin pointed to a potential double bottom on the monthly chart and a newly confirmed MACD momentum shift, the first in over two years. “That’s two years and one month of downtrend finally reversing,” he said.

Related Reading: Ethereum Consolidates As Momentum Builds – Analyst Has $3K In Sight For June

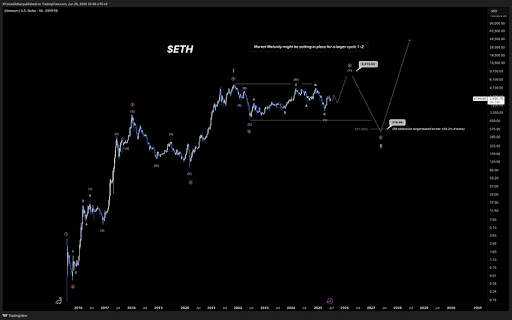
Finally, the ETH/BTC pair is showing a near-identical structure to Ethereum’s dominance chart. Kevin believes this confluence is key. “Look at that—wow, that’s funny—it looks the same. You find your major low right where you found it in 2020. The monthly indicators are all curling up.”

Still, he remained measured in his optimism, noting that macroeconomic conditions—particularly monetary policy—remain essential for confirming the bullish case. “It’s going to take some monetary policy shifting. We still need inflation to come in line. But the market is living four to six months ahead. If the market starts to sniff out that easing is coming, we’ll see that reflected in asset prices before it happens.”

Referencing cycle theory and historical post-halving performance, Kevin argued that ETH’s recent relative strength fits both narratives. “Typically, ETH and altcoins start to outperform Bitcoin in the post-halving year. We’re halfway through that window—and it looks like it’s finally starting.”

Looking ahead, he sees Ethereum as the “major key” that unlocks broad altcoin outperformance. “ETH opens the door to soaking up market cap, which will then leak down into mid-caps and small-caps. Everything starts with ETH.”

While reiterating that patience is crucial, Kevin concluded with conviction: “The monthly timeframe indicators have never been more historically on our side. I think we’re on the verge of something really big.”

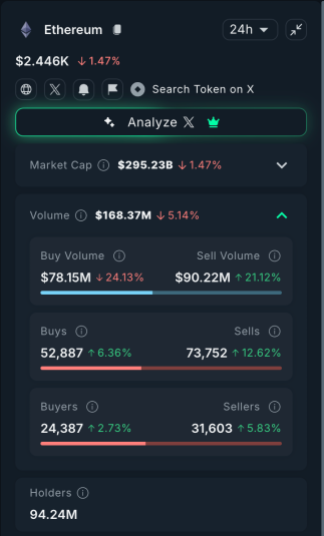
At press time, ETH traded at $2,739.

Ethereum price

Ethereum Price Eyes 38% Jump To $3,500 As 50EMA Swims Into View

Crypto analyst Crypto Bullet has raised the possibility of the Ethereum price surging by 38% soon. He alluded to the 50EMA as the only thing holding ETH from witnessing this price surge, but suggested that it could change soon with a breakout on the horizon. 

Ethereum Price Eyes 38% Jump To $3,500

In an X post, Crypto Bullet predicted that the Ethereum price could record a 38% surge to $3,500. This came following as he highlighted the ongoing battle between ETH and the 50EMA, noting that this indicator was the only thing holding the altcoin back from a parabolic surge. The analyst added that on average, a breakout results in a 38% pump, which puts Ethereum exactly at $3,500

As NewsBTC reported, Crypto Bullet also recently predicted that the Ethereum price could rally to $3,300 as a Morningstar Candle pattern formed. Back then, he noted that ETH was facing tough resistance at $2,500 but affirmed that the resistance would be broken in due time. He indicated that a breakout from that resistance will usher in the rally to $3,300. 

Ethereum

The Ethereum price has now broken above the $2,500 resistance, which provides a bullish outlook for the largest altcoin by market cap. Based on Crypto Bullet’s prediction, a rally to $3,300 may already be underway, which could then lead ETH to the $3,500 target. In a more recent X post, the crypto analyst commented on the recent break above $2,500. 

He stated that the Ethereum price is now trying to break the 200-day MA, which is between $3,000 and $3,300, for the fifth time. He indicated that a breakout above the range is likely to happen on this fifth attempt. His accompanying showed that ETH could rally to the $4,000 level if a successful breakout occurs. 

ETH About To Begin A New Bull Run

Crypto analyst Trader Tardigrade predicted that another bull run is about to start for the Ethereum price. He noted that ETH’s daily candle closed above the resistance level at $2,650 yesterday and also opened above this resistance level today. The analyst added that ETH is now moving above it, which signals the start of a new bull run.

His accompanying chart showed that the Ethereum price is breaking out of an ascending triangle, which could send the altcoin above the psychological $3,000 level. Crypto analyst Mikybull Crypto also declared that Ethereum’s breakout will be huge, with ETH still maintaining its current range between $2,400 and $2,600. 

At the time of writing, the Ethereum price is trading at around $2,670, up over 7% in the last 24 hours, according to data from CoinMarketCap.

Ethereum

Pundit Says Do Not Ignore Ethereum Amid New All-Time Highs In Major Metric

Ethereum is back in sharp focus across the crypto market following a recent rally to $2,800 that has added fresh layers of bullish momentum to its long-term narrative. At the time of writing, Ethereum is trying to register a footing above $2,500, but this subdued price action masks what an analyst is calling one of the most critical technical and on-chain moments in Ethereum’s recent history.

Ethereum Weekly Engagement Hits Record High

According to Crypto Patel, a crypto analyst on the social media platform X, Ethereum’s weekly engagement has reached an all-time high, surpassing all previous peaks seen since 2022. The accompanying chart below shows a steep rise in the number of unique addresses interacting with Ethereum’s ecosystem. 

According to the most recent data, the number of weekly active addresses stands at 17.4 million, representing an increase of almost 17% in just seven days. Notably, May 2025 saw the most significant growth in engagement, with each of the past three weeks witnessing at least 15 million active addresses. Meanwhile, the Layer 2 multiplier, which reflects adoption across Ethereum’s scaling solutions, has climbed to 7.55x, marking an 18.63% jump over the same period.

Ethereum

Crypto Patel described the development as impossible to ignore, adding that the momentum is building fast, and warned followers to stay ready as Ethereum prepares for what could be a dramatic next leg up. “It’s impossible to ignore $ETH right now,” he remarked. Despite a minor 4.31% decline in cross-chain activity in the past seven days, the overall engagement trend confirms that more users are entering the Ethereum ecosystem.

Analyst Predicts $9,000 To $10,000 ETH Price Target

Complementing this on-chain momentum is a broader technical perspective offered by another crypto analyst known as XForceGlobal on the social media platform X. In a detailed Elliott Wave analysis also shared on X, the analyst noted that Ethereum has successfully completed a complex corrective structure and is now poised to enter a powerful new impulsive phase. According to the chart, the bearish scenario has been invalidated by recent price behavior, and a new bullish cycle is now underway as Ethereum is currently playing out a bullish B wave.

If this bullish B wave plays out as expected, XForceGlobal projects a major price surge with a target range between $9,000 and $10,000 for Ethereum. Specifically, the analyst identified a $9,410 price target for sometime in the next year. 

However, the analyst outlines a hypothetical fallback to the $576 zone if the C corrective wave unfolds. Nonetheless, the current wave structure shows an increased likelihood of Ethereum surging higher rather than breaking down. The analyst concluded by stating, “We can now confidently scrap the bearish case. The impulse opened the door for potential new highs.”

At the time of writing, Ethereum is trading at $2,493 with a recent intraday high of $2,537.

Ethereum