Probe of Crypto.com, Kalshi’s Super Bowl Bets Is About the Nature of ‘Gaming’: Crypto Lawyer

The recent probe of Crypto.com and Kalshi’s sports contracts all comes down to a single question — are event contracts premised on sports “gaming” within the meaning of the Commodities Exchange Act, said crypto lawyer Aaron Brogan.

The Commodity Futures Trading Commission (CFTC) is probing the Super Bowl events contracts on Crypto.com and Kalshi, according to a Bloomberg report.

“If sports does not constitute gaming, then, given the CFTC’s current legal posture, the CFTC likely does not have the power to prohibit Crypto.com and Kalshi from self-certifying these contracts,” Brogan told CoinDesk.

However, all of this is a bit more complicated than it seems on the surface.

“This is a surprisingly thorny question, which was addressed in the Kalshi ruling,” Brogan said, referring to the ruling from last fall that allowed Kalshi to move forward with its election betting contracts by confirming that they do not fall under the CFTC’s restricted categories.

Brogan explained that the Judge in that ruling defined “gaming” as “playing games” or “playing games for stakes” and specifically cited past discussions in Congress during the writing of the Commodities Exchange Act, during which a lawmaker said the rule against gaming was meant to cover sports betting.

“All that sounds bad for these contracts, but I am not wholly convinced,” Brogan continued. “Judge Cobb’s finding here is dicta—non-binding—and the legislative history is only relevant where the law is ambiguous.”

Brogan also points to the Merriam-Webster dictionary definition of gaming as not “playing games” but “the practice or activity of playing games for stakes.”

“At least in Merriam-Webster, this clearly means gambling, not sports, so I think these prediction markets would have colorable arguments if they had to go to the mats. Some judges might be receptive to this kind of textualist argument,” Brogan said.

And finally, there’s the issue of the changing nature of the CFTC itself. Many believe that the appointment of Republican Caroline Pham as the Commission’s Chair will lead to a more laissez-faire regulatory approach, Brogan said.

“[The Democrats] had been highly skeptical of retail-oriented event contracts and fought hard against first PredictIt and then Kalshi in 2023 and 2024 to attempt to prevent them from offering election contracts,” Brogan continued.

But, how laissez-faire is still something up for debate.

“If they’re probing into these post-inauguration Kalshi contracts, maybe they will still be hawkish on at least some event contracts,” Brogan concluded.

Bitcoin Down 2.5% as China Slaps Retaliatory Tariffs on U.S., Probes Google

Bitcoin (BTC) and Nasdaq futures faced renewed selling pressure during Asia trading hours on Tuesday as China imposed retaliatory tariffs against the U.S.

China also announced an antitrust probe into Google, while moving clothing firm PVH Corp and biotechnology firm Illumina to the list of unreliable entities.

Beijing imposed a 15% duty on U.S. coal and LNG and a 10% tax on crude oil, agricultural machinery, pickup trucks and large-engine cars. The move came after U.S. President Donald Trump’s new 10% tariffs on China came into effect.

On Monday, Trump agreed to a 30-day pause on his tariff threats against Mexico and Canada, offering a relief to BTC. The cryptocurrency’s price staged a remarkable recovery from nearly $92,000 to over $102,000 in hopes that the trade war would be short-lived.

China’s fresh action, however, has dented the recovery, sending BTC down to $98,500 at press time. The Nasdaq futures are down 0.6% with the dollar index drawing safe haven bids.

TRON, Movement Labs Deny ‘Token Swap’ Deal for World Liberty Financial Inclusion

Representatives from two protocols that have tokens held by the treasury of World Liberty Financial (WLFI), a crypto project backed by President Donald Trump and his family, are denying the existence of a token swap agreement that required a $10 million – $15 million buy-in to get included in the project.

A report from Blockworks on Monday alleged that representatives from WLFI had pitched protocol teams on a deal to get included in the project’s treasury. The deal was they could buy $10 million WLFI tokens plus a 10 percent fee, and WLFI will purchase the same amount of their protocol’s tokens.

“There is no token swap agreement,” a spokesperson from TRON told CoinDesk.

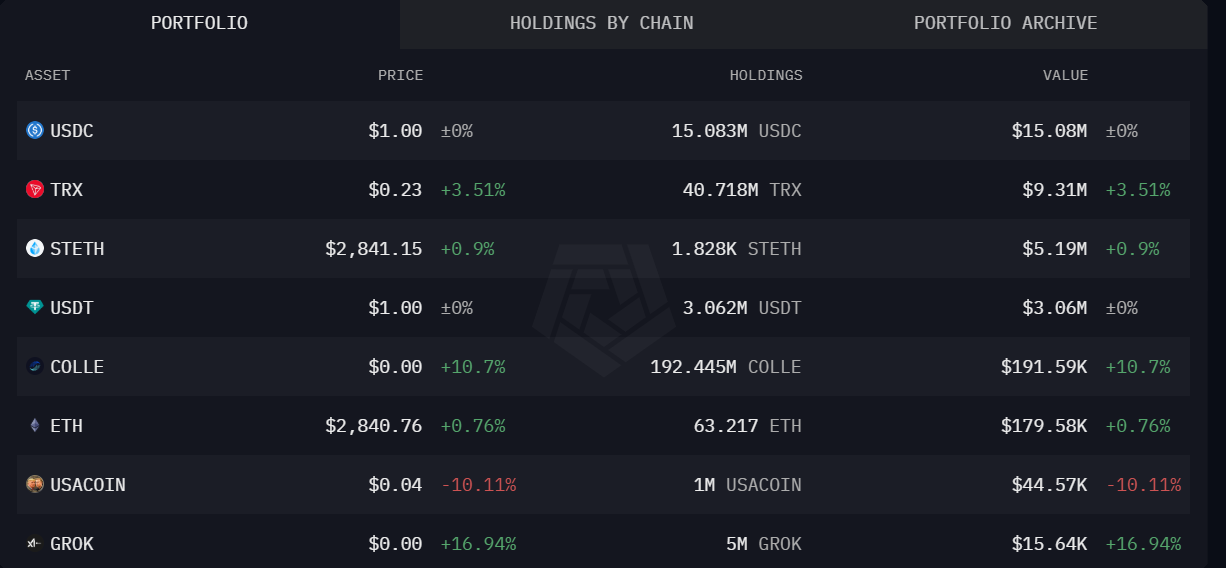
TRON’s TRX is the second largest holding in WLFI’s wallet, according to on-chain data curated by Arkham.

The WLFI wallet currently holds 40.7 million TRX worth $9.3 million. WLFI made these buys in tranches throughout January.

Movement Labs, which saw its MOVE token jump in late January when WLFI purchased $2 million of it, and rumors swirled that the team was in discussion with Elon Musk-led Department of Government Efficiency, also denied that there was a swap agreement in place.

Rushi Manche, co-founder of Movement Labs, told CoinDesk earlier that they did not send tokens to anyone including WLFI.

“There weren’t any deals — any back door deals. It was purely just market buying,” Manche told CoinDesk.

Cardano (ADA) at a Crossroads: Could Bears Take Control Again?

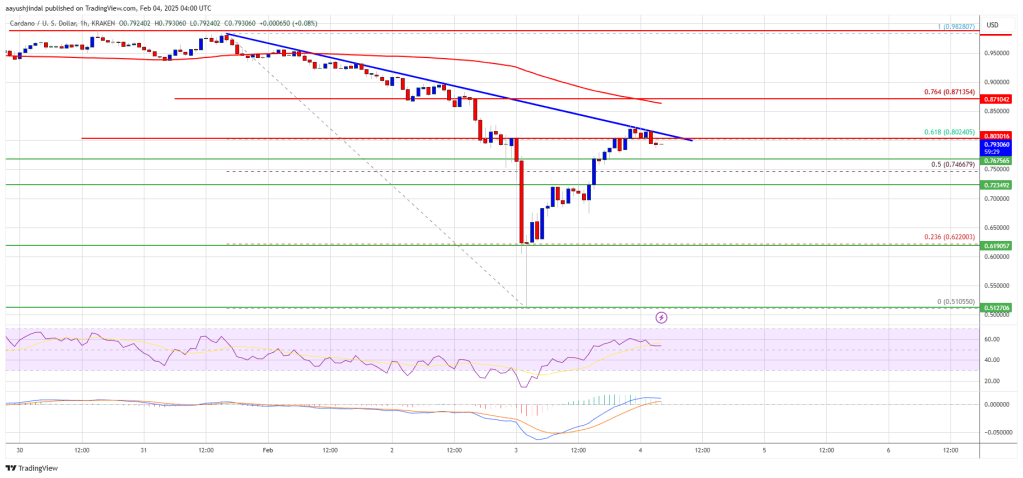
Cardano price started a fresh decline below the $0.9250 zone. ADA is now correcting losses and struggling to clear the $0.80 resistance.

  • ADA price started a fresh decline from the $0.9250 zone.
  • The price is trading below $0.850 and the 100-hourly simple moving average.
  • There is a key bearish trend line forming with resistance at $0.8050 on the hourly chart of the ADA/USD pair (data source from Kraken).
  • The pair could start another decline if it trades below the $0.7650 support zone.

Cardano Price Faces Resistance

After struggling to stay above the $0.950 level, Cardano started a fresh decline like Bitcoin and Ethereum. ADA declined below the $0.90 and $0.850 support levels.

There was a clear move below the $0.60 support zone. A low was formed at $0.5105 and the price recently started a decent upward move. The price cleared the $0.60 and $0.70 resistance levels. The bulls pumped the price above the 50% Fib retracement level of the downward move from the $0.9828 swing high to the $0.5105 low.

However, the bears are now active near the $0.80 zone. There is also a key bearish trend line forming with resistance at $0.8050 on the hourly chart of the ADA/USD pair.

Cardano price is now trading below $0.80 and the 100-hourly simple moving average. On the upside, the price might face resistance near the $0.80 zone and the 61.8% Fib retracement level of the downward move from the $0.9828 swing high to the $0.5105 low.

Cardano (ADA) at a Crossroads

The first resistance is near $0.820. The next key resistance might be $0.850. If there is a close above the $0.850 resistance, the price could start a strong rally. In the stated case, the price could rise toward the $0.9250 region. Any more gains might call for a move toward $1.00 in the near term.

Another Decline in ADA?

If Cardano’s price fails to climb above the $0.80 resistance level, it could start another decline. Immediate support on the downside is near the $0.7650 level.

The next major support is near the $0.7230 level. A downside break below the $0.7230 level could open the doors for a test of $0.6880. The next major support is near the $0.6250 level where the bulls might emerge.

Technical Indicators

Hourly MACD – The MACD for ADA/USD is losing momentum in the bullish zone.

Hourly RSI (Relative Strength Index) – The RSI for ADA/USD is now above the 50 level.

Major Support Levels – $0.7650 and $0.7230.

Major Resistance Levels – $0.8000 and $0.8200.

Bitcoin Market Performance Shows Signs of Distribution Cycle, Analyst Reveals

Bitcoin market activity over the past day has been marked by turbulence, with its value falling to as low as $90,000 levels earlier today before rebounding to just above $94,000.

Despite this partial recovery, the cryptocurrency remains down 5.8% over the past week and more than 13% below its all-time high of $109,000, reached in January.

This recent price movement has led a CryptoQuant analyst to suggest that Bitcoin may be transitioning into a distribution cycle, a phase where price gains start to slow as supply shifts toward newer market participants.

Bitcoin Transitioning From Accumulation to Distribution

The analyst known as Oinonen, discussed the current state of Bitcoin’s market cycle in a recent post titled “Entering the Distribution Cycle.” Oinonen noted that after gaining 129.2% over the past year and surpassing $100,000, Bitcoin might be nearing a “cycle top.”

He cited comments from Ki Young Ju, who suggested that the market is in the “early distribution phase” and could potentially see a few more quarters of growth, influenced by retail investors entering the market and broader promotional efforts.

Applying Dow Theory to Bitcoin’s recent market patterns, Oinonen explained that the cryptocurrency’s market movements can be divided into accumulation and distribution phases.

Bitcoin price chart

He pointed out that while 2022 represented a clear distribution cycle, Bitcoin transitioned into an accumulation cycle in 2023, which extended through 2024.

Now, as 2025 unfolds, Bitcoin appears to be shifting back into a distribution phase. Despite this shift, Oinonen emphasized that the market still has the potential for further price discovery, citing relatively low funding rates and a lack of overleveraged conditions.

Price Supports and Future Outlook

Oinonen also cited Axel Adler Jr, another market observer, who shared similar sentiments, noting that Bitcoin’s current market environment is not overheated and retains the potential for additional growth under stable macroeconomic conditions.

This view is supported by the ongoing institutional demand reflected in MicroStrategy’s recent Bitcoin purchases. The company has continued its pro-cyclical acquisition strategy, adding 10,107 bitcoins in early 2025 and bringing its total holdings to 471,107 BTC.

This sustained institutional interest serves as a leading indicator of market confidence and highlights Bitcoin’s continued appeal as a long-term investment.

Bitcoin (BTC) price chart on TradingView

Oinonen mentioned that as Bitcoin hovers near its “fair price” support level of $87,990—identified by its power-law fit—further developments should be watched out for. The analyst added:

Despite the approaching distribution cycle, Bitcoin might still reach significantly higher spot price levels. Bitcoin’s funding rate is relatively low and comparable to summer 2024 levels. We’re far from an overleveraged market, and the structure supports further spot price discovery.

Featured image created with DALL-E, Chart from TradingView

XRP Price Explodes 25%: Will The Recovery Sustain or Fizzle Out?

XRP price recovered most losses and rallied over 25%. The price is back above $2.65 and now faces hurdles near the $2.820 level.

  • XRP price started a strong upward move above the $2.50 level.
  • The price is now trading below $2.80 and the 100-hourly Simple Moving Average.
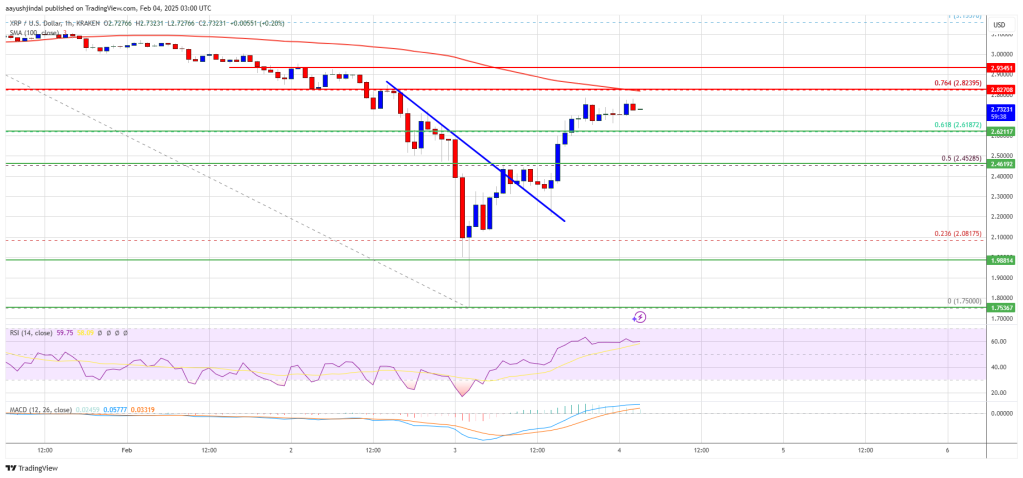
  • There was a break above a connecting bearish trend line with resistance at $2.420 on the hourly chart of the XRP/USD pair (data source from Kraken).
  • The pair might start a fresh increase if it clears the $2.820 resistance zone.

XRP Price Recovers Over 25%

XRP price started a fresh decline below the $2.850 zone, like Bitcoin and Ethereum. The price declined heavily below the $2.50 and $2.350 support levels. The bears even pushed it below $2.00.

There was a sharp drop of over 25% and the price tested the $1.75 zone. A low was formed at $1.75 and the price recently started a sharp recovery wave. The bulls pumped the price above the $2.20 and $2.50 levels. There was a move above the 61.8% Fib retracement level of the downward move from the $3.155 swing high to the $1.750 low.

Besides, there was a break above a connecting bearish trend line with resistance at $2.420 on the hourly chart of the XRP/USD pair. The price is now trading below $2.80 and the 100-hourly Simple Moving Average.

On the upside, the price might face resistance near the $2.80 level. The first major resistance is near the $2.820 level and the 76.4% Fib retracement level of the downward move from the $3.155 swing high to the $1.750 low. The next resistance is $2.940.

XRP Price

A clear move above the $2.940 resistance might send the price toward the $3.00 resistance. Any more gains might send the price toward the $3.050 resistance or even $3.120 in the near term. The next major hurdle for the bulls might be $3.20.

Another Decline?

If XRP fails to clear the $2.820 resistance zone, it could start another decline. Initial support on the downside is near the $2.620 level. The next major support is near the $2.50 level.

If there is a downside break and a close below the $2.50 level, the price might continue to decline toward the $2.450 support. The next major support sits near the $2.350 zone.

Technical Indicators

Hourly MACD – The MACD for XRP/USD is now gaining pace in the bullish zone.

Hourly RSI (Relative Strength Index) – The RSI for XRP/USD is now above the 50 level.

Major Support Levels – $2.620 and $2.450.

Major Resistance Levels – $2.80 and $2.820.

Bitcoin 4-Hour RSI Hits Oversold Zone – Is A BTC Rebound Near?

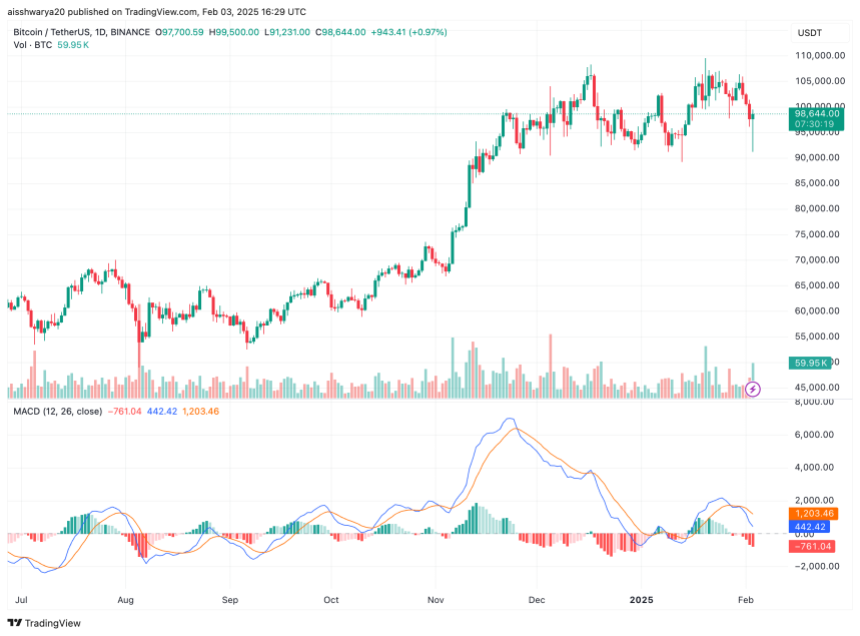
Bitcoin (BTC) has had a volatile 24 hours, plunging from $99,500 to as low as $91,231 amid mounting concerns over impending US trade tariffs on Canada, Mexico, and China. However, some crypto analysts see this sharp decline as a buying opportunity, suggesting that BTC may be oversold and poised for a rebound.

Is Bitcoin Poised For A Relief Rally?

Yesterday, the crypto market experienced one of its largest sell-offs in history, with over $2.3 billion in liquidations affecting more than 742,000 traders. This level of liquidations surpasses those seen during the COVID market crash in March 2020 and the FTX collapse in November 2022.

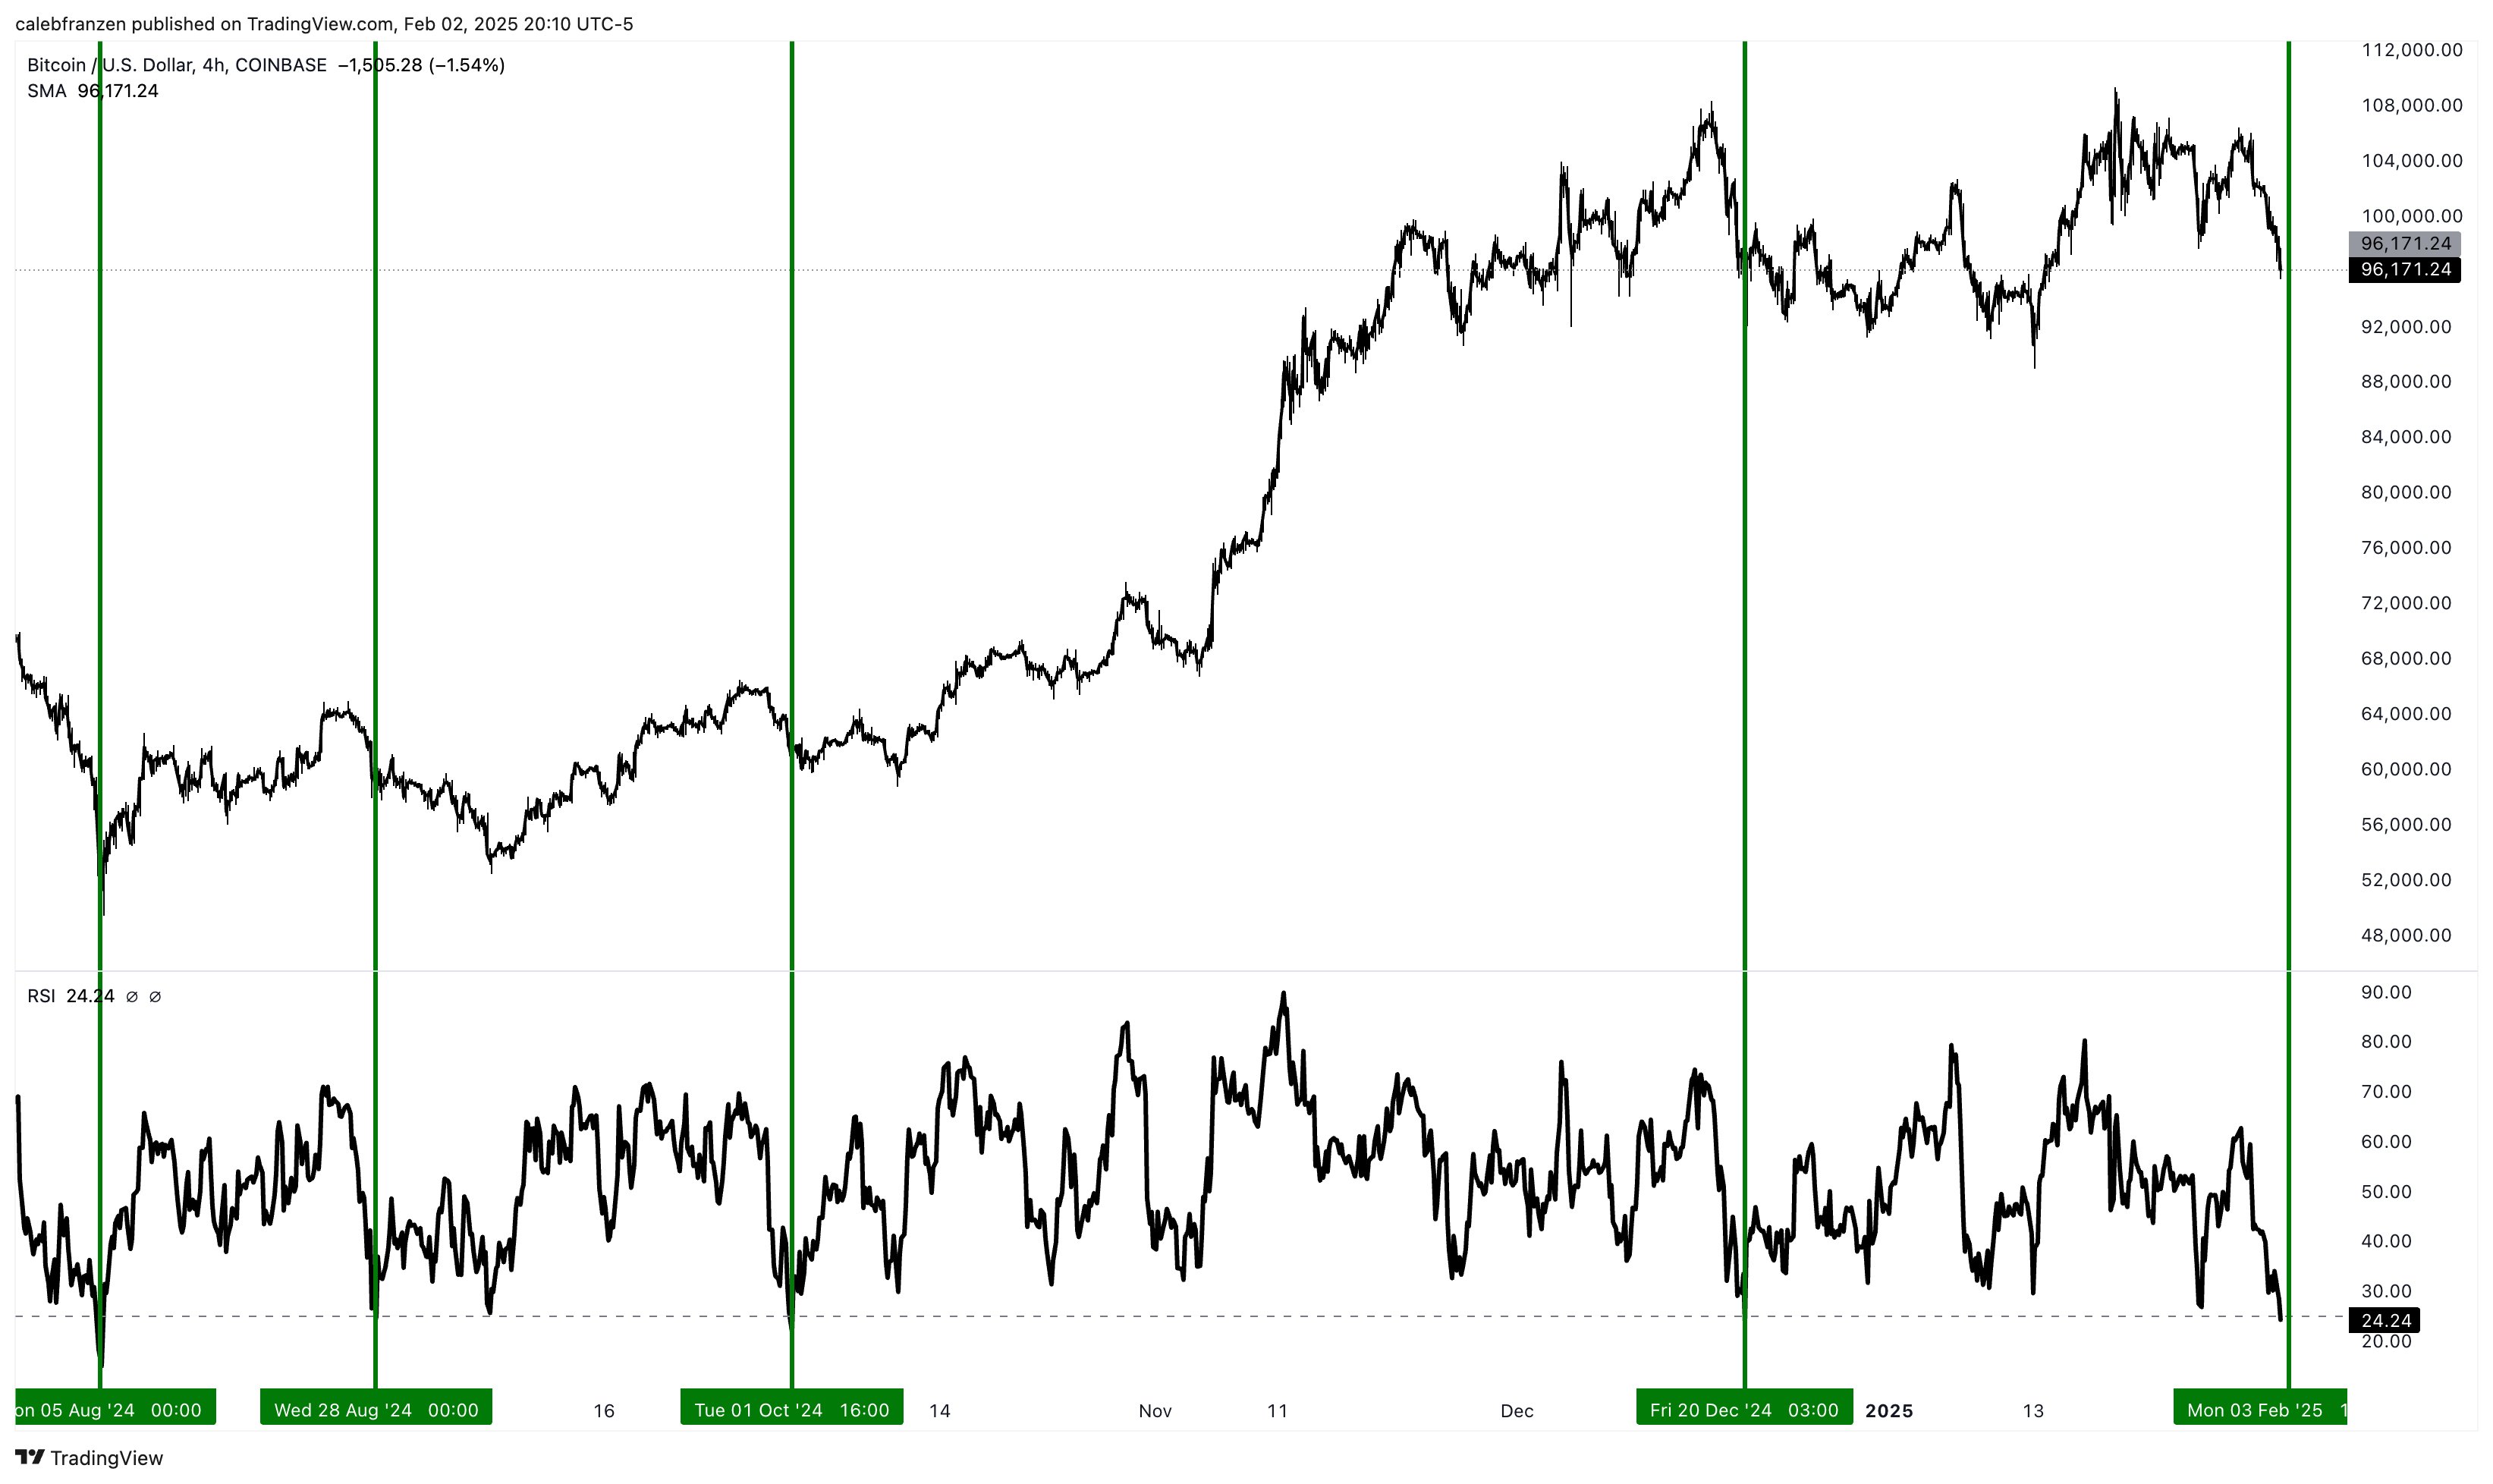
Despite the downturn, some analysts argue that BTC may have entered oversold territory, signaling a potential relief rally. Crypto analyst Caleb Franzen shared insights in a post on X, highlighting that Bitcoin’s 4-hour Relative Strength Index (RSI) has dipped into oversold levels. He noted:

For the 5th time since August 2024, Bitcoin’s 4-hour RSI is becoming oversold. Each of the prior signals were attractive accumulation periods, even if price made new short-term lows after the signal flashed.

For the uninitiated, the RSI is a momentum indicator that measures the speed and magnitude of recent price changes to determine whether BTC is overbought or oversold. A reading above 70 suggests overbought conditions – potential for a pullback – while a reading below 30 indicates oversold conditions – potential for a rebound.

According to Franzen’s chart, Bitcoin’s current RSI is hovering around 24 on the 4-hour timeframe, indicating that BTC may be in an attractive accumulation zone. If historical trends hold, BTC could be on the verge of a short-term recovery.

RSI

Is There More Trouble For BTC Ahead?

As of the latest updates, Donald Trump and his Mexican counterpart Claudia Sheinbaum have agreed to temporarily delay the proposed trade tariffs, offering some relief to financial markets. However, uncertainty remains regarding trade negotiations with Canada, leaving investors cautious about BTC’s next move.

Meanwhile, fellow crypto analyst Johnny’s analysis indicates that “the meat” of BTC’s current down move is likely over. The analyst added that as long as BTC continues to trade above range lows and the yearly open, it will “look good compared to the rest of the market.”

However, not all experts are optimistic. Renowned businessman and author Robert Kiyosaki warns that BTC could face further downside pressure if Trump follows through with his tariff plans. 

According to Kiyosaki, increased tariffs could strengthen the US dollar, potentially driving investors away from risk assets like Bitcoin in the short term. At press time, BTC trades at $98,644, up 0.4% in the past 24 hours.

bitcoin

Ethereum Price Recovery Stalls at Resistance: Can Bulls Break Through?

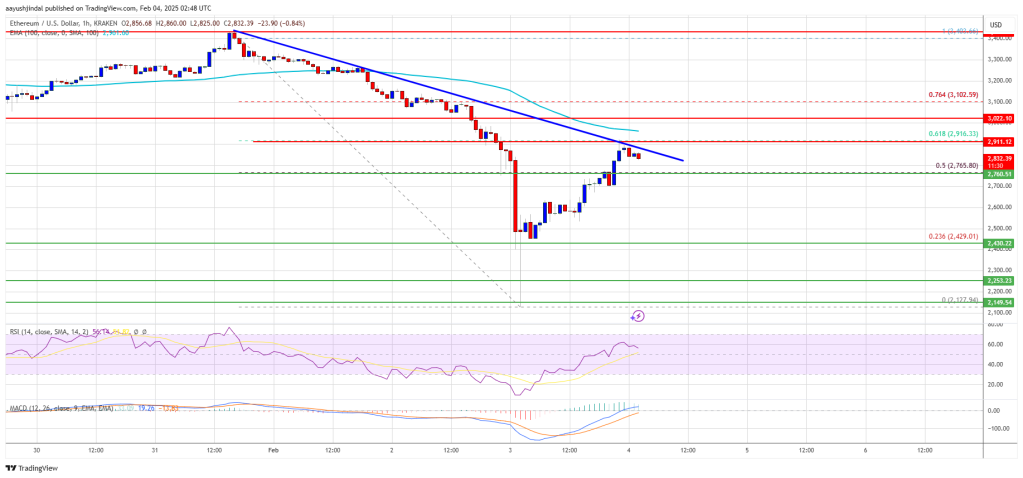
Ethereum price started a recovery wave above the $2,500 zone. ETH is up nearly 10% and now faces a major resistance near $2,920.

  • Ethereum started a decent upward move above the $2,500 support zone.
  • The price is trading below $2,900 and the 100-hourly Simple Moving Average.
  • There is a key bearish trend line forming with resistance at $2,920 on the hourly chart of ETH/USD (data feed via Kraken).
  • The pair could start a fresh decline if it stays below the $2,920 level.

Ethereum Price Attempts Recovery

Ethereum price started a major decline below the $2,800 level, underperforming Bitcoin. ETH declined below the $2,650 and $2,500 levels to enter a bearish zone.

There was a clear move below the $2,200 level. The price declined over 25% and tested the $2,120 zone. A low was formed at $2,127 and the price recently started a fresh upward move. There was an increase above the $2,500 level.

The price surpassed the 50% Fib retracement level of the downward move from the $3,403 wing high to the $2,127 swing low. However, the bears are now active near the $2,900 zone. There is also a key bearish trend line forming with resistance at $2,920 on the hourly chart of ETH/USD.

Ethereum price is now trading below $2,900 and the 100-hourly Simple Moving Average. On the upside, the price seems to be facing hurdles near the $2,900 level. The first major resistance is near the $2,920 level and the trend line or the 61.8% Fib retracement level of the downward move from the $3,403 wing high to the $2,127 swing low.

Ethereum Price

The main resistance is now forming near $3,000. A clear move above the $3,000 resistance might send the price toward the $3,120 resistance. An upside break above the $3,120 resistance might call for more gains in the coming sessions. In the stated case, Ether could rise toward the $3,250 resistance zone or even $3,320 in the near term.

Another Drop In ETH?

If Ethereum fails to clear the $2,900 resistance, it could start another decline. Initial support on the downside is near the $2,765 level. The first major support sits near the $2,650.

A clear move below the $2,650 support might push the price toward the $2,500 support. Any more losses might send the price toward the $2,420 support level in the near term. The next key support sits at $2,350.

Technical Indicators

Hourly MACDThe MACD for ETH/USD is gaining momentum in the bullish zone.

Hourly RSIThe RSI for ETH/USD is now above the 50 zone.

Major Support Level – $2,765

Major Resistance Level – $2,920

U.S. Prosecutors Charge Canadian Man With $65M Hacks of Indexed Finance, KyberSwap

U.S. prosecutors have charged a 22-year-old Canadian man with stealing a combined $65 million in crypto through two separate decentralized finance (DeFi) hacks — the 2021 Indexed Finance exploit and the 2023 KyberSwap hack.

In a newly-unsealed indictment filed in the Eastern District of New York (EDNY), prosecutors say Andean “Andy” Medjedovic was the mastermind behind both exploits. Though Medjedovic’s alleged role in the KyberSwap exploit was previously unknown, he has publicly admitted to being the Indexed Finance attacker, wiping $16 million from the DeFi platform when he was still a teenager.

Read more: After Stealing $16M, This Teen Hacker Seems Intent on Testing ‘Code is Law’ in the Courts

Medjedovic did little to hide his identity as the Indexed Finance hacker because he professed to believe he wasn’t actually doing anything illegal. Another DeFi hacker, Avraham “Avi” Eisenberg, took a similar “code is law” position after his 2022 Mango Markets exploit, claiming that siphoning $110 million from the decentralized exchange was fair game. A New York jury disagreed, finding Eisenberg guilty of fraud and market manipulation. He will be sentenced later this year, and faces up to 20 years in prison.

Medjedovic has been on the run since December 2021, when a Canadian court issued a warrant for his arrest. In 2023, he told a DeFi Llama reporter that it was “exhausting” living as a fugitive, saying that he had been bouncing around through Europe, South America and an unnamed island nation while on the lam. A spokesperson for the Eastern District of New York (EDNY) told CoinDesk that Medjedovic remains “at large” and is not believed to be in the U.S.

Eight months after telling the same reporter that he was now a whitehat hacker, prosecutors say Medjedovic stole about $50 million from KyberSwap. According to the indictment, Medjedovic planned the KyberSwap hack for months before acting, writing to himself “Find time to Strike!” and creating a “POST-EXPLOITATION” plan for himself.

In one file, Medjedovic allegedly mused on his past mistakes, writing “Going On the run / Yes / Chance of getting caught

Medjedovic has been charged with one count of wire fraud, one count of unauthorized damage to a protected computer, one count of attempted Hobbs Act extortion, one count of money laundering conspiracy and one count of money laundering. He faces a maximum penalty of 90 years in prison.

Bitcoin Price Climbs Back to $100K: Is This Just the Beginning?

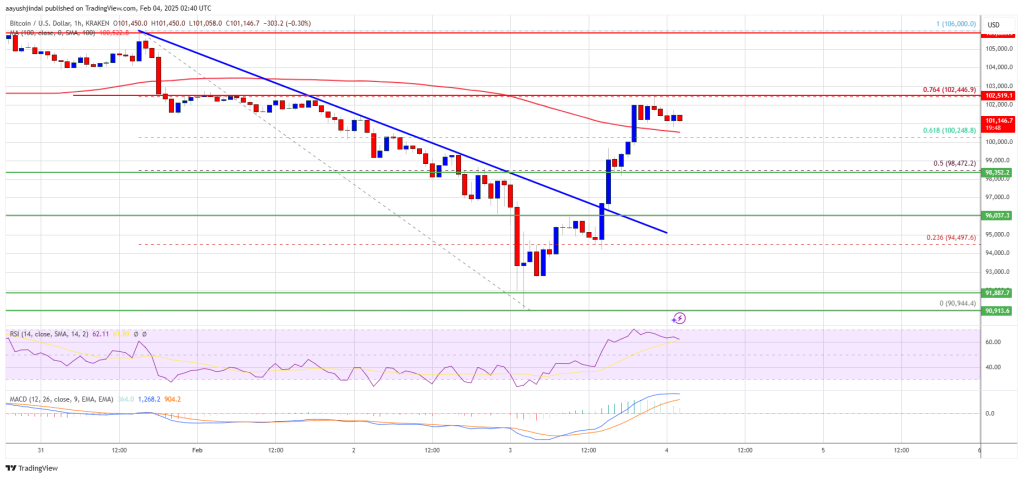
Bitcoin price started a fresh upward move above the $98,000 zone. BTC is trimming losses but might struggle to settle above the $103,000 zone.

  • Bitcoin started a fresh upward move above the $100,000 level.
  • The price is trading above $99,500 and the 100 hourly Simple moving average.
  • There was a break above a key bearish trend line with resistance at $96,000 on the hourly chart of the BTC/USD pair (data feed from Kraken).
  • The pair could start another increase if it stays above the $100,000 zone.

Bitcoin Price Reclaims $100,000

Bitcoin price started another decline below the $95,000 zone. BTC gained bearish momentum for a move below the $93,500 and $92,000 levels. It even dived below $91,000.

A low was formed at $90,944 and the price recently started a decent recovery wave. There was a move above the $95,500 level. The price cleared the 50% Fib retracement level of the downward move from the $106,000 swing high to the $90,945 low.

Moreover, there was a break above a key bearish trend line with resistance at $96,000 on the hourly chart of the BTC/USD pair. Bitcoin price is now trading above $98,000 and the 100 hourly Simple moving average.

On the upside, immediate resistance is near the $102,000 level. The first key resistance is near the $102,500 level or the 76.4% Fib retracement level of the downward move from the $106,000 swing high to the $90,945 low. The next key resistance could be $103,200.

Bitcoin Price

A close above the $103,200 resistance might send the price further higher. In the stated case, the price could rise and test the $105,000 resistance level. Any more gains might send the price toward the $107,000 level.

Another Decline In BTC?

If Bitcoin fails to rise above the $103,200 resistance zone, it could start a fresh decline. Immediate support on the downside is near the $100,500 level. The first major support is near the $100,000 level.

The next support is now near the $98,000 zone. Any more losses might send the price toward the $96,500 support in the near term.

Technical indicators:

Hourly MACD – The MACD is now gaining pace in the bullish zone.

Hourly RSI (Relative Strength Index) – The RSI for BTC/USD is now above the 50 level.

Major Support Levels – $100,500, followed by $100,000.

Major Resistance Levels – $102,000 and $103,200.

Why Bitcoin’s Price Crash Could Be a Buying Opportunity for Big Players

Bitcoin (BTC) has experienced a significant drop, with its value plunging to $91,000 in the early hours of Monday. The decline follows unfavorable macroeconomic developments, including newly imposed US tariffs.

This price movement has left investors and analysts closely scrutinizing the market for signs of a reversal or further downturn. According to a recent analysis by CryptoQuant analyst TraderOasis, Bitcoin’s decline below critical support levels has resulted in increased panic selling.

Despite this, the Coinbase premium index indicates that institutional investors are continuing to accumulate BTC rather than offloading their holdings. This contrast between retail-driven selloffs and institutional accumulation suggests that larger players are using the current dip to boost their positions.

Bitcoin Market Dynamics And Institutional Activity

TraderOasis highlights several key market indicators that shed light on the current dynamics. Open interest—a measure of active trading positions—has dropped significantly, pointing to a wave of forced liquidations as leveraged traders exit their positions. Oasis wrote:

A drop in funding rates suggests that market participants are taking short positions (betting on a price decrease) and that bearish sentiment is increasing.

Notably, this ongoing pattern described by the analyst hints at a strategic accumulation phase by so-called “whales,” or large-scale investors.

Bitcoin spot price and volume on all exchanges

Oasis mentioned that while retail traders face stop-loss liquidations, these larger entities appear to be absorbing Bitcoin at discounted prices. This accumulation during periods of panic is not uncommon and often precedes a market recovery.

Rising Liquidations and Signs of Recovery

Another CryptoQuant analyst, Mignolet, echoed these observations, emphasizing the scale of recent long-position liquidations.

Bitcoin long liquidations on all exchanges.

The current liquidation volume is reportedly the highest since September 2023, with many traders caught off guard by the abrupt price drop. Mignolet compares this event to past market shocks, including the FTX collapse and the COVID-induced crash.

Despite the significant liquidations, there are signs of optimism on the horizon. The Coinbase Premium Gap (CPG) data points to aggressive buying by institutional investors, who are capitalizing on the sudden influx of liquidity.  While the market remains volatile, this accumulation activity suggests that larger players anticipate a reversal soon.

Bitcoin (BTC) price chart on TradingView

Featured image created with DALL-E, Chart from TradingView

Crypto Market Enters Step 2 Of Benjamin Cowen’s Guide For 2025, What’s Next On The List?

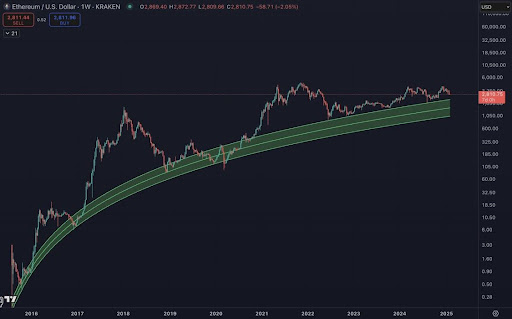
According to a recent analysis by Benjamin Cowen, CEO and Founder of ITC Crypto, the crypto market has entered “Step 2” of his guide for 2025. The analyst pinpointed Ethereum (ETH) in his price chart, emphasizing that the second-largest cryptocurrency is set to decline further, in line with his earlier predictions. 

Step 2: Crypto Market Sells Off As ETH Goes Home

Ethereum is currently experiencing widespread market sell-offs as investors react to its bearish price action and tightening liquidity conditions. Failing to meet investors’ expectations, the price of Ethereum has struggled to maintain strong momentum in this bull market. 

Cowen’s chart analysis suggests that the current downtrend aligns with the broader market cycle, where Bitcoin’s dominance rises above 60%, leading to capital flows from altcoins like Ethereum. The analyst announced that the crypto market is currently in the second phase of his guide for 2025’s market trajectory. 

In a previous X post on January 29, Cowen outlined a structured six-step roadmap for his 2025 market cycle theory. The first step highlights an increase in Bitcoin’s dominance to over 60%. This occurs when investors leave altcoins and move into Bitcoin, seeking stability amidst the volatility and uncertainty of the crypto market. During this time, Ethereum and most altcoins underperform due to the lack of interest and demand from investors. 

Crypto

Now, in Step 2 of Cowen’s 2025 guide, the crypto market has entered a correction phase, with Ethereum declining sharply. Cowen claims that ETH will eventually “go home,” meaning the cryptocurrency will undergo a severe decline to long-term key support levels. In this second phase, the broader market also experiences a sell-off as investors take profit amidst volatility and ongoing declines in cryptocurrencies. 

Despite rising to $3,000 earlier in this bull market, Ethereum has failed to maintain positive momentum, recording steep declines as its price struggles to find stable support. According to data from CoinMarketCap, ETH is currently trading at $2,594, reflecting a massive 16.4% price crash in the last 24 hours. 

Over the past weeks, Ethereum has performed poorly, experiencing a sharp decline to new lows while other cryptocurrencies have gained momentum. The altcoin’s price has plunged to new lows, dropping by more than 27.6% in just a month. This downturn has also significantly impacted its market capitalization, which has fallen to $312.6 billion. 

Cowen’s 2025 Market Guide: What’s Next?

In Step 3 of his market cycle theory for 2025, Cowen predicts that the Federal Reserve (FED) will shift its policy and end quantitative tightening, which has been draining liquidity from the financial markets. This decision is critical, as easing monetary conditions would pave the way for the analyst’s fourth step — a bullish phase fueled by market rallies. 

In the fifth step, Cowen predicts that macroeconomic conditions will deteriorate later in the year. This could include factors like inflation, interest rate, geopolitical stability, and others. The final step in his 2025 market cycle guide forecasts a full-blown recession. Cowen projects that this recession would lead to a bear market, aligning with historical midterm election year cycles, where markets tend to face deeper corrections.

Crypto