Few things in crypto are as elusive and misunderstood as the concept of an “altcoin season.” Traditionally, this term referred to a brief window — usually 2–3 months — following a Bitcoin (BTC) price rally, where altcoins outperform BTC in cumulative returns. That pattern held in the 2015–2018 and 2019–2022 cycles, but the verdict is not yet in on whether the current bull market has had its altcoin season.
The Blockchain Center defines an altcoin season as a period when 75% of the top 50 altcoins outperform Bitcoin over a rolling 90-day timeframe. Its Altseason Index registered upticks in March 2024 and again in January 2025 — but neither lasted long enough to qualify as a full-fledged altseason.

Altcoin season index. Source: Blockchain Center
Some analysts argue that memecoins drained liquidity from the broader altcoin market. Others blame the oversaturation of crypto investment products — particularly ETFs — which cater to institutions and spotlight only the largest altcoins. A third explanation calls for a deeper rethink of what altcoins actually are. Within this view, altcoins are perceived as a unified asset class but are a diverse collection of crypto assets with different functions, value structures, and growth potential.
Memecoins stole the spotlight
For the crypto analyst Miles Deutscher, the launch of Pump.fun is directly correlated to the destruction of the altcoin market vs BTC.
“The reason we’ve seen no major “altseason” across majors is because the speculative capital that would’ve once poured into top 200 assets, instead decided to jump the gun and flood into onchain low caps instead.”
Deutscher notes that the early birds and insiders got insanely rich from this, but most retail investors who entered late lost. This was also the case in previous altcoin cycles. However, unlike 2022, where the losses were mainly limited to CEX altcoins with solid liquidity, they got stuck into illiquid onchain memecoins, which quickly retraced 70%-80%. This led to a “wealth destruction event greater than the early 2022 bear (LUNA aside),” even though BTC (and some majors) are still in a macro bull trend.

Solana TVL vs Top 125 Alts (excl. Top 10). Source: Miles Deutscher
Politics in the United States added fuel to the memecoin craze. For example, President Donald Trump’s public embrace of memecoins sparked momentum — but the results quickly disappointed. TRUMP and MELANIA tokens have dropped 83% and 95%, respectively, since launching at the end of January, delivering another hit to retail sentiment.
Related: Will new US SEC rules bring crypto companies onshore?
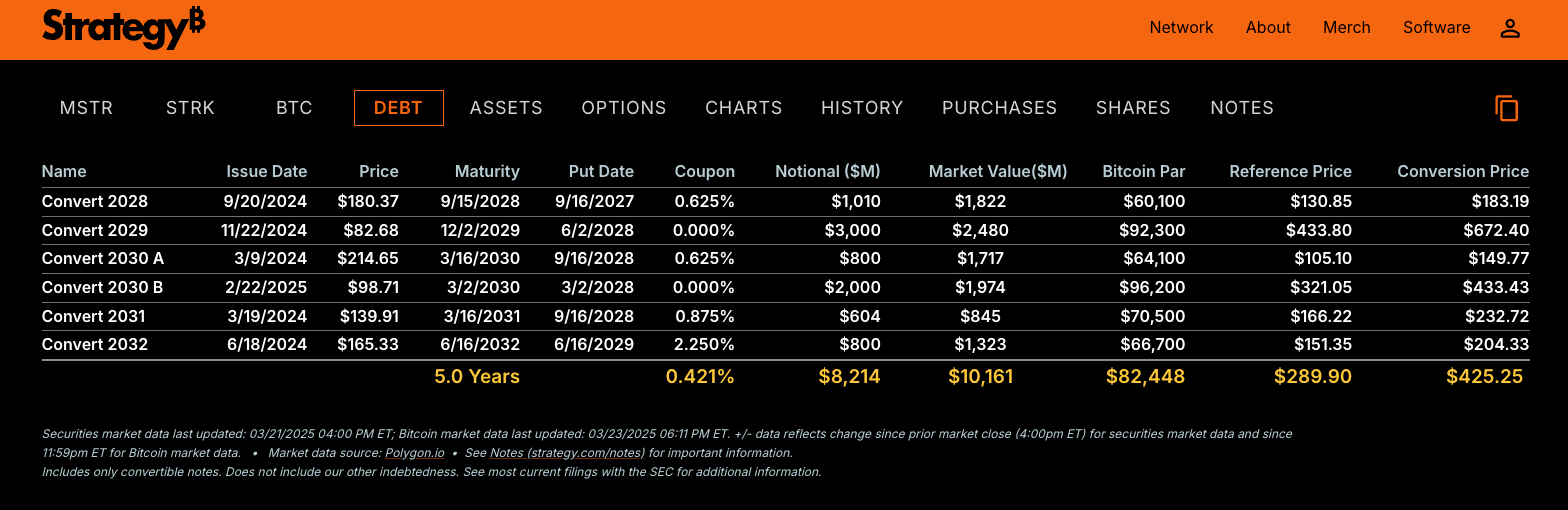
Institutional investors and ETFs shifted the tide
Another factor impacting the strength of the current bull market’s altcoin season was the arrival of Wall Street. The launch of spot Bitcoin ETFs in January 2024 brought $129 billion in inflows as investors rushed into familiar structures with custody, regulation, and easy access. BlackRock’s IBIT became a dominant vehicle, and the introduction of ETF options in July 2024 added even more depth.
Some analysts believe that the safety and scalability of spot BTC ETFs sucked capital away from speculative assets. With the ability to hedge through options and futures, the incentive to gamble on illiquid, low-volume altcoins diminishes significantly.

But this explanation has limits. Crypto is not a zero-sum market — global liquidity is growing, and capital entering the space can flow in many directions. If anything, institutional demand could expand the total crypto pie.
Furthermore, some altcoins already have their ETFs as well. Spot Ether ETFs debuted in July 2024 and have since registered a modest net inflow of $565,000, according to CoinGlass. Such a drastic difference in scale with spot BTC ETFs suggests that the ETF structure alone isn’t enough; investor conviction still matters.
Altcoin’s function and their rallies became more nuanced
The term “altcoin” emerged when any non-Bitcoin token was novel. But in today’s ecosystem, the term lumps together wildly different assets: blockchain-native coins, governance tokens, stablecoins, memecoins, DApp tokens, and real-world asset protocol tokens — each with distinct functions and investor profiles. Just as it wouldn’t make sense to group gold, Nvidia stock, and the US dollar into a single index in traditional finance, it makes little sense to treat all altcoins as one unified category.
A closer look at price action supports this idea. According to CoinGecko data, major altcoin categories have diverged sharply this cycle. Real-world asset (RWA) tokens surged 15x. GameFi, by contrast, lost half its market cap. This shows that narratives play a growing role in driving investors’ capital allocation decisions.

Crypto categories market cap. Source: CoinGecko
Even core blockchain tokens have started to specialize. Ethereum remains the hub for DeFi. Solana dominates memecoins. Tron now holds second place in stablecoin transfers. ImmutableX is carving out its territory in the gaming space. In each case, token performance is increasingly tied to ecosystem activity. This means that we might want to abandon the term “altseason” and start to pay more attention to specific narratives within the crypto space.
Altcoins aren’t moving as a pack anymore, and that might be the biggest signal of how the crypto market is maturing.
This article does not contain investment advice or recommendations. Every investment and trading move involves risk, and readers should conduct their own research when making a decision.